Up to 83 elements of the periodic table can be measured in samples of multiple forms and nature when using Wavelength-Dispersive X-Ray Fluorescence (WD-XRF): solids or liquids, conductive or non-conductive.
Thanks to simple sample preparation, fast analysis, precision, stability, accuracy, and broad dynamic range (from ppm levels to 100%), it is advantageous to use XRF instead of other techniques.
The effects of particle size and mineralogy may compromise the powder analysis precision. Despite particle size effects and inhomogeneities often being minimized by grinding less than 50 microns and pelletizing at high pressure, mineralogical effects often may not be able to be removed in full or harder particles and thus may not be able to be broken down lower than the necessary size.
The ideal way of entirely eradicating both mineralogical impacts and grain size is fusing these oxidic materials. The procedure is made up of a heated mixture of borate flux and sample – the flux being either lithium tetraborate and lithium metaborate (or both) at high temperature (1000°-1200°) to melt the flux and dissolve the sample.
It is vital for the cooling conditions and the overall composition to combine perfectly so that the resultant product after cooling is a one phase glass.
Users can calibrate the Thermo Scientific™ ARL™ 9900 Series X-Ray Fluorescence Spectrometer as a comprehensive analytical package. This flexibility gives them the option to use the usual oxide calibration established by a sample preparation by fusion (Figure 2) to analyze a great assortment of minerals (Figure 1).
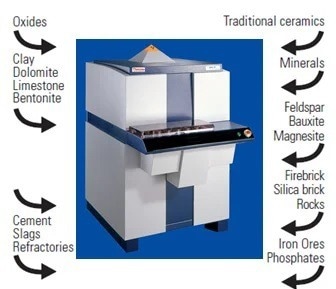
Figure 1. Many different materials can be analyzed with an ARL 9900 spectrometer calibrated with our General Oxide calibration. Image Credit: Thermo Fisher Scientific - Elemental Analyzers and Phase Analyzers.
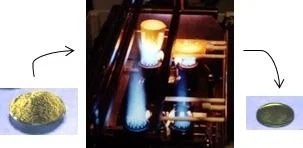
Figure 2. Transformation of the powder material into a glassy sample by fusion at high temperature. Image Credit: Thermo Fisher Scientific - Elemental Analyzers and Phase Analyzers
Calibration Ranges & Results
Table 1 displays the types of oxides that are addressed and the concentration ranges. A working curve is identified for each element utilizing the multivariable regression incorporated in the market-leading Thermo Scientific™ OXSAS™ Software package.
Theoretical alpha factors are used for each matrix correction. For correction purposes, loss on ignition values, which spread up to 47%, may be used in the multi-variable regression.
The standard error of estimate (SEE) is the measure of the accuracy of the analysis. SEE is the characteristic error between the certified concentrations of the standard samples and the calibration curve for a given oxide.
The limits of detection (LOD) are listed in Table 2, which are determined at low concentrations with precision tests for the various oxides when the universal goniometer is used.
Depending on the element and the accuracy required, the analysis time for each element may range between 4 to 40 seconds. The counting time can be decreased considerably when fixed channel monochromators are used for several elements/oxides.
Table 1. Concentration ranges of the various oxide types with the Standard Errors of Estimate (SEE) achieved. Source: Thermo Fisher Scientific - Elemental Analyzers and Phase Analyzers
| Elements |
Range [%] ignited samples |
SEE [%] |
| Al2O3 |
0.04 - 89.2 |
0.16 |
| CaO |
0.006 - 94.4 |
0.32 |
| Cr2O3 |
0.05 - 17.2 |
0.03 |
| Fe2O3 |
0.05 - 93.9 |
0.15 |
| K2O |
0.06 - 15.4 |
0.03 |
| MgO |
0.03 - 96.7 |
0.22 |
| MnO |
0.01 - 5.2 |
0.03 |
| Na2O |
0.03 - 10.06 |
0.05 |
| P2O5 |
0.01 - 37.83 |
0.15 |
| SO3 |
0.015 - 2.95 |
0.05 |
| SiO2 |
0.26 - 99.9 |
0.23 |
| TiO2 |
0.01 - 3.8 |
0.03 |
Table 2. Typical limits of detection on ARL 9900 Intellipower Series in 100s obtained on various oxides (fusions with 1:12 dilution). Source: Thermo Fisher Scientific - Elemental Analyzers and Phase Analyzers
| |
3600 W
(3σ) [ppm] |
2500 W
(3σ) [ppm] |
1200 W
(3σ) [ppm] |
| CaO |
12 |
14 |
20 |
| SiO2 |
13 |
15 |
22 |
| Al2O3 |
32 |
38 |
55 |
| Fe2O3 |
12 |
14 |
20 |
| MgO |
74 |
89 |
128 |
| Na2O |
143 |
172 |
248 |
| SO3 |
17 |
20 |
29 |
| K2O |
10 |
12 |
17 |
| P2O5 |
17 |
20 |
29 |
| MnO |
8 |
9 |
13 |
| Cr2O3 |
7 |
8 |
12 |
| TiO2 |
7 |
8 |
12 |
Sample Preparation
As can be seen in Figure 2, standard samples are dried before being fused. For ignited or non-ignited powder, standards are prepared as 35 mm diameter fused beads. Ignition takes place for one hour at 1050 °C when necessary.
0.7 grams of sample, 7.7 grams of Fluorex 65 and 0.02 grams of LiBr (dilution 1:11) are used on a Katanax electrical fusion machine or a gas fusion machine (Vulcan or Fluxana) to produce the fusion. There can be two forms of sample preparation employed:
a. No Calcination of Samples: Quicker Preparation for Clean Oxides.
It is vital for all elements to be measured for this automatic correction to work, given that the software estimates loss on ignition. The loss on ignition should be presented through manual input if additional elements/oxides to the 12 measured are present, so the accuracy of analysis is improved.
It is important to note that if small metallic particles are present in the sample, fusion from non-ignited samples may be fatal to the Pt-Au crucible.
b. Fusion from Ignited Samples: Better Accuracy and Safer Fusion.
When samples are ignited for one hour at 1050 °C, loss of ignition (LOI) is determined. Samples are prepared as 35 mm diameter fused beads from ignited powder. If there is a chance that small metallic particles are present, it is safer and simpler to fuse ignited samples. In order to analyze samples prepared by both methods, the same calibration curves can be used.
Factory Pre-Calibration
Before supplying the spectrometer to the client, it is possible to directly carry out the pre-calibration of the ARL 9900 WDXRF Spectrometer in the factory itself. The certified standard samples used are prepared on either a Katanax electrical fusion machine or a gas fusion machine (Vulcan VAA2 or Fluxana subject to customer selection.
This pre-calibration delivers no standard samples, with the exception of a set of six stable and polished setting-up samples for the upkeep of the calibration curves over time. In order to permit the customer to calibrate the instrument on-site using their own sample preparation equipment, a kit of 24 international certified standards of oxide materials is accessible.
Conclusion
A variety of minerals, raw materials and oxidic products can be analyzed with high precision and accuracy by coupling sample preparation and wavelength dispersive X-Ray fluorescence as fusion beads, as is demonstrated by these findings. Without needing external water cooling due to efficient management of power, the ARL 9900 Intellipower Spectrometers can operate up to 2500 W.
This, therefore, means that neither tap water nor a water cooler is necessary in these instances. Reduced energy consumption and less stress on the X-Ray tube are accomplished at greater power levels (3.6 kW or 4.2 kW) thanks to intelligent management of the X-Ray tube.
With just one sequential goniometer or by adding fixed channels to speed up the response time, the configuration of the ARL 9900 Intellipower Spectrometers can be selected. The state-of-the-art OXSAS Analytical Software under Windows® 10, therefore, offers ease of use and comprehensive analytical functions.
Acknowledgments
Produced from materials originally written by Didier Bonvin From Thermo Fisher Scientific.

This information has been sourced, reviewed and adapted from materials provided by Thermo Fisher Scientific - Elemental Analyzers and Phase Analyzers.
For more information on this source, please visit Thermo Fisher Scientific - Elemental Analyzers and Phase Analyzers.