Within both manufacturing and academic contexts, X-Ray diffraction is an established procedure that is employed in the investigation of pharmaceutical compounds and formulations. it is mandated by FDA regulations that an Active Pharmaceutical Ingredients (API) examination is supplemented with XRD data.
There is an associated demand for increasingly versatile X-Ray diffractometers. These are required to maintain research and validation levels thanks to the growing sophistication required of contemporary APIs to participate in a competitive market focused on maintaining societal health.
Stringent screening criteria must be satisfied by APIs and other compounds, such as salt, co-crystal, and polymorphism, throughout research, production and QA/QC. Powder X-Ray diffraction can be used to expediently overcome these issues, as it is capable of differentiating multiple crystallographic structures and possesses an intrinsic sensitivity.
Moreover, dynamic studies are able to be performed, and it is also possible to monitor the crystallization behavior of compounds in various solvents or alternative crystallization scenarios.
It is even possible to habitually extrapolate the crystal structure of new compounds from powder data. Finally, researchers can refine processes by tracking impurities during synthesis thanks to X-Ray diffraction.
Instrument
The Thermo Scientific™ ARL™ EQUINOX 100 is comprised of mirror optics supporting a bespoke Cu (50 W) or Co (15 W) high-brilliance micro-focus tube.
The instrument is completely portable, thanks to the fact that it expends minimal power, which therefore eliminates the requirement for an external water chiller. Convenient inter-laboratory transportation is permitted by this portability, for which specific infrastructure is no longer needed.
Compared to competing diffractometers, the ARL EQUINOX 100 provides extremely rapid data acquisition rates. This rapidity arises as a result of its special curved position sensitive detector (CPS). The CPS is, therefore, able to calculate all diffraction peaks concurrently and in real-time and therefore is ideally suited for both transmission and reflection calculations (Figure 1).
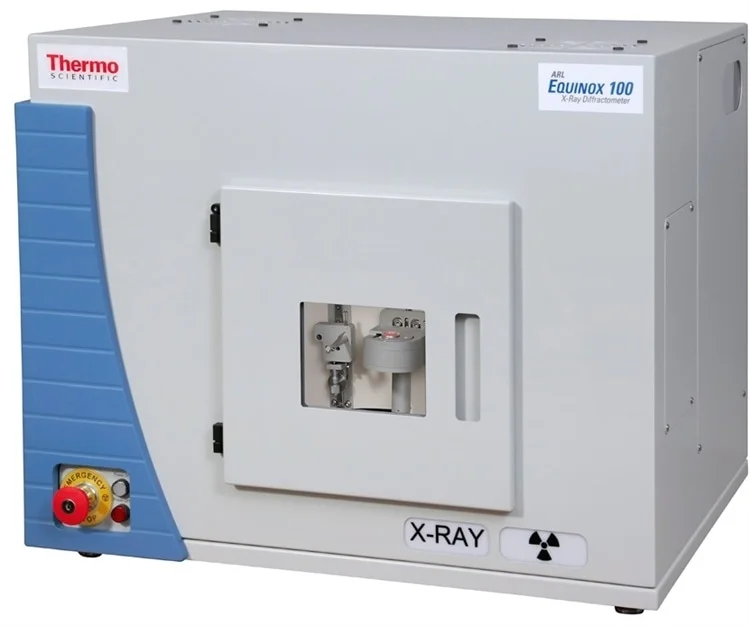
Figure 1. ARL EQUINOX 100 X-ray diffractometer. Image Credit: Thermo Fisher Scientific - Elemental Analyzers and Phase Analyzers
Experimental
An examination of branded acetaminophen was performed by first granulating the samples and subsequently inserting them into reflection sample holders. With the assistance of a capillary attachment, a sample was also studied in transmission mode. An examination was performed under Cu Kα (1.541874 Å) radiation for five minutes, with the samples revolving throughout the analysis.
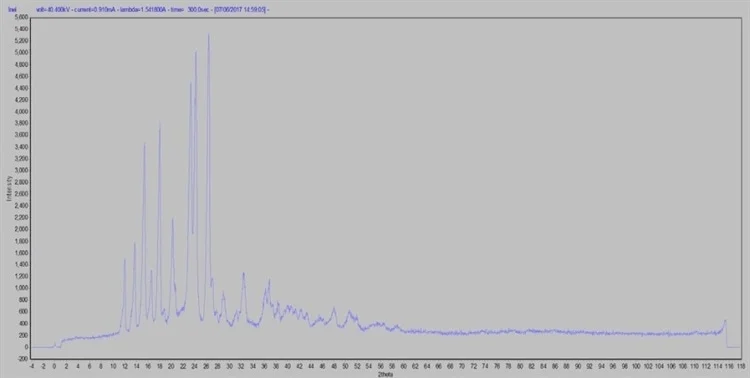
Figure 2. Brand name raw data in reflection mode. Image Credit: Thermo Fisher Scientific - Elemental Analyzers and Phase Analyzers
I_MAD was used to perform raw data determination (Figures 2 and 3). MDI JADE 2010 enabled the execution of data processing and evaluation, furnished with the Crystallographic Open Database (COD) for qualitative and quantitative phase analysis, comprising whole pattern fitting Rietveld refinement (WPF).
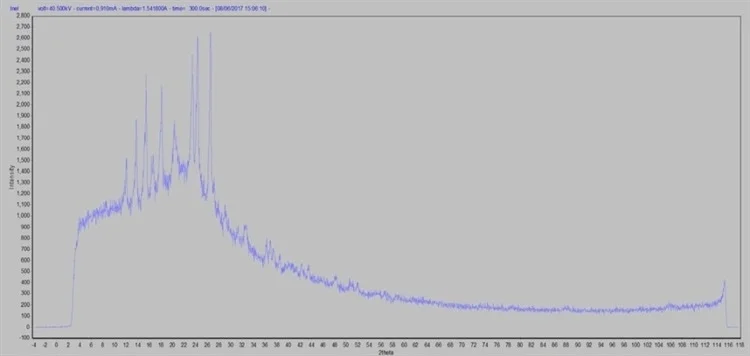
Figure 3. Brand name raw data in capillary transmission mode. Image Credit: Thermo Fisher Scientific - Elemental Analyzers and Phase Analyzers
Furthermore, with direct methods, the utilization of EXPO2014 permitted the determination of a crystal structure solution for the sample. The crystal structure was optimized via the implementation of additional Rietveld calibrations following the location of a suitable solution.
Results
The API is comprised of acetaminophen products alongside a range of compounds which typically vary between vendors. In such mixtures, the explicit differentiation of the crystalline phases becomes feasible by examining the samples utilizing XRD.
It is similarly possible to undertake a range of different other experimental determinations, including structure solution and refinement, crystallite size analysis, and crystallinity proportion, as well as others. The data exhibited below is for both samples and their associated analyses.
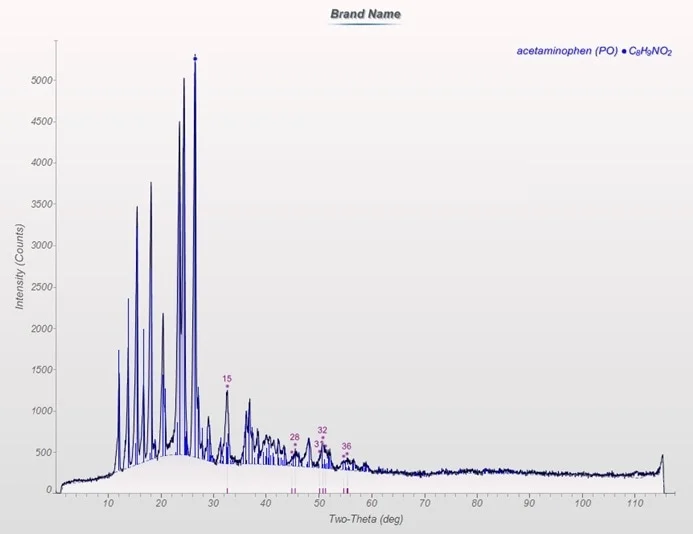
Figure 4. Diffraction pattern of brand name sample in reflection geometry. Image Credit: Thermo Fisher Scientific - Elemental Analyzers and Phase Analyzers
The brand-name sample is made up of an amorphous element coupled with a singular crystalline phase, acetaminophen (Figure 3). The crystallinity proportion of the sample was 60.71%.
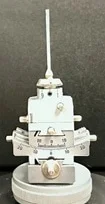
Figure 5. Brand name sample in glass capillary attachment. Image Credit: Thermo Fisher Scientific - Elemental Analyzers and Phase Analyzers
The same sample was then inserted into a glass capillary (Figures 5 and 6) and subsequently placed onto a goniometer head, and the capillary attachment was utilized to examine in transmission mode (Figure 7).
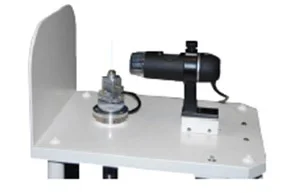
Figure 6. Capillary attachment shown on alignment tool. Image Credit: Thermo Fisher Scientific - Elemental Analyzers and Phase Analyzers
The observation of meta-stable phases, materials in the mother liquor, small sample volumes, and materials that are disposed to preferred orientation are permitted by examining samples in a capillary, as well as other properties.
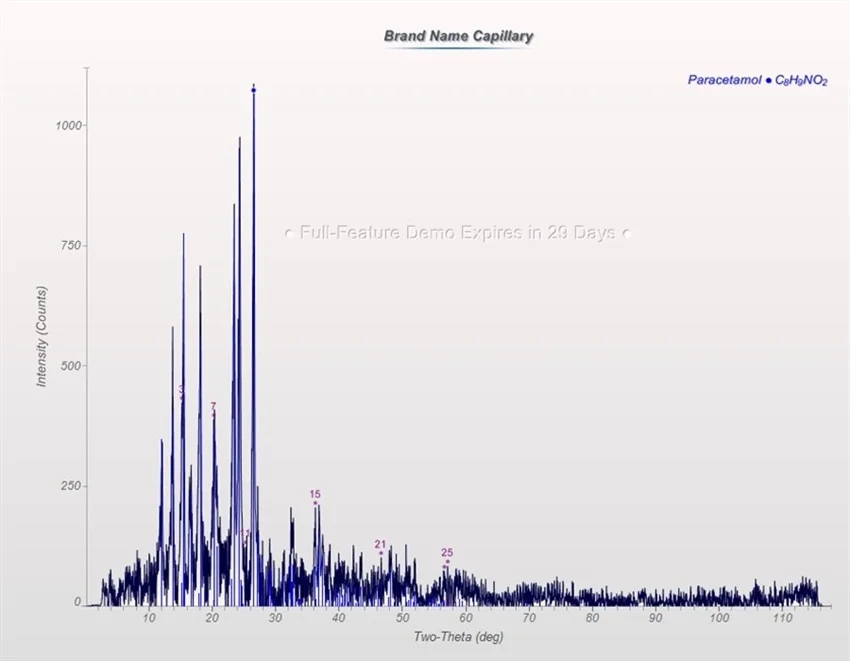
Figure 7. Diffraction pattern of brand name sample in a capillary. Image Credit: Thermo Fisher Scientific - Elemental Analyzers and Phase Analyzers
The determination of a structural solution on the reflection geometry sample is enabled by implementing the program EXPO2014 with direct methods. Powder diffraction data in the software is capable of deciphering crystal structures through utilizing thermal annealing or alternatively with direct methods.
The complete solution process pathway is therefore implemented: space group ascertainment, indexing, ab initio and a priori structure solution, evaluation of the integrated intensities, and Rietveld refinement. For the refined structure, the consequent Rwp = 6.981, with a unit cell of a = 12.92452, b = 9.41834, c =7.11006 and β = 115.762, with cell volume = 779.47, and SG = P21/a (Figure 8).
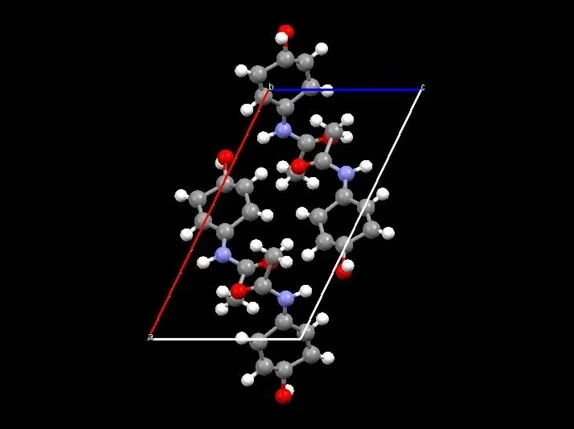
Figure 8. Crystal structure of acetaminophen from reflection sample. Image Credit: Thermo Fisher Scientific - Elemental Analyzers and Phase Analyzers
In the following table, atomic fractional coordinates are provided.
Table 1. Atomic fractional coordinates of Acetaminophen. Source: Thermo Fisher Scientific - Elemental Analyzers and Phase Analyzers
| Atom |
X |
y |
z |
| C1 |
0.4294 |
0.3701 |
0.8347 |
| C2 |
0.5101 |
0.3446 |
0.7307 |
| C3 |
0.6089 |
0.2557 |
0.8481 |
| C4 |
0.6225 |
0.1620 |
0.9874 |
| C5 |
0.5610 |
0.1808 |
0.1188 |
| C6 |
0.4727 |
0.2653 |
0.0121 |
| C7 |
0.2862 |
0.4919 |
0.5828 |
| C8 |
0.1675 |
0.5790 |
0.5613 |
| N1 |
0.3377 |
0.4517 |
0.7753 |
| O1 |
0.7280 |
0.0958 |
0.0675 |
| O2 |
0.3078 |
0.5038 |
0.4415 |
| H1 |
0.7057 |
0.9870 |
0.0771 |
| H2 |
0.4957 |
0.4101 |
0.6108 |
| H3 |
0.6631 |
0.2569 |
0.7817 |
| H4 |
0.5754 |
0.1153 |
0.2387 |
| H5 |
0.4185 |
0.2641 |
0.0784 |
| H6 |
0.1250 |
0.6091 |
0.4118 |
| H7 |
0.1199 |
0.5212 |
0.6124 |
| H8 |
0.1905 |
0.6605 |
0.662 |
| H9 |
0.3068 |
0.4621 |
0.8815 |
Conclusion
The ability to clearly characterize phases in pharmaceutical compounds is enabled by the resolution and speed of the ARL EQUINOX 100.
To execute WPF quantitative phase analysis crystallinity proportion measurements, and even, using direct methods, a structure solution of the crystalline phase, a five-minute calculation time is adequate.
The ARL EQUINOX 100, as a result, is a very practicable instrument for all aspects of production and pharmaceutical research, spanning from QA/QC of the final drug product all the way down to pre-formulation research and development.

This information has been sourced, reviewed and adapted from materials provided by Thermo Fisher Scientific - Elemental Analyzers and Phase Analyzers.
For more information on this source, please visit Thermo Fisher Scientific - Elemental Analyzers and Phase Analyzers.