The essential titanium ore, Ilmenite (FeTiO3), accounts for up to 47% of the aggregate global production of a whitening pigment called TiO2. Australia is the leading worldwide provider of ilmenite ore, closely followed by China, South Africa, and Canada.
The ore takes the form of two alternative morphologies: hard rock, and heavy sand ilmenite, the most utilized morphology. Ilmenite can more broadly be defined as (Fe, Mg, Mn) TiO3 and is made up of a solid solution series with geikielite (MgTiO3) and pyrophanite (MnTiO3).
To determine the ore grade, it is essential to understand both the chemical and mineralogical configuration of the sample, which are typically examined using X-ray diffraction (XRD) and X-ray fluorescence spectroscopy (XRF), respectively.
XRD is most frequently carried out using Cu-Kα (1.54 Å) radiation, which conjointly stimulates the FeKα (1.94 Å) line and, as a result, engenders X-Ray fluorescence, generating a noisy XRD pattern. Co-Kα radiation (1.79 Å), or shielding the front of the detector with a PVC filter, is a potential resolution to this issue, which will absorb the low energy fluorescence.
Instruments
A bespoke Cu (50 W) or Co (15 W) micro-focus tube supported by mirror optics is utilized by the Thermo Scientific™ ARL™ EQUINOX 100 X-Ray diffractometer. It is completely portable, thanks to the minimal power expended by the instrument, which removes the need for an external water chiller.
Convenient inter-laboratory transportation is permitted by this portability, for which specific infrastructure is no longer needed.
Extremely rapid data acquisition rates are offered by the ARL EQUINOX 100 instrument in comparison to competing diffractometers, thanks to its distinctive curved position sensitive detector (CPS). This calculates all diffraction peaks simultaneously and in real-time and is thus ideally suited for both reflection and transmission calculations (Figure 1).
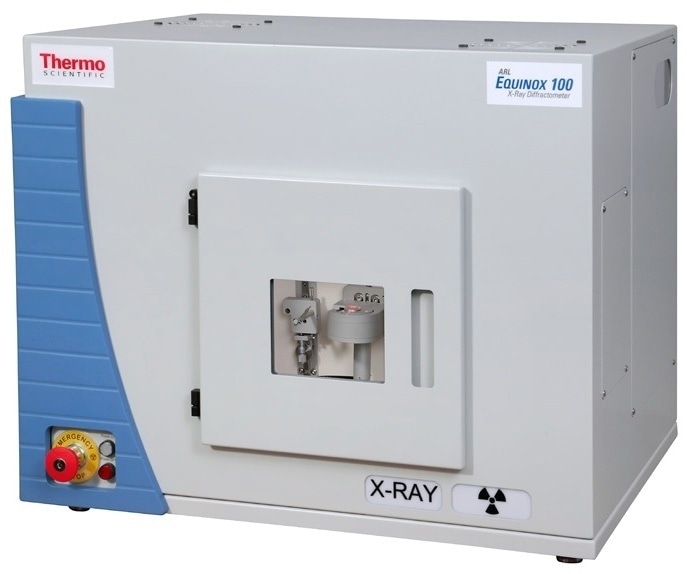
Figure 1. ARL EQUINOX 100 X-ray diffractometer. Image Credit: Thermo Fisher Scientific - Elemental Analyzers and Phase Analyzers
An extremely sensitive silicon drift detector (SDD) is employed by the Thermo Scientific™ ARL™ QUANT’X energy-dispersive XRF spectrometer to differentiate between the incoming radiation energy.
The Thermo Scientific™ ARL™ QUANT’X energy-dispersive XRF spectrometer is thus capable of measuring every element between Na (Z = 11) and U (Z = 92). A 50 W Rh or Ag tube is fitted in the instrument, which can operate at voltages pushing 50 kV.
The Fundamental Parameters (FP) derived UniQuant standard-less package is used to attain the transformation of spectra into elemental/oxide concentrations. The minimal requirement for external maintenance, coupled with the robust, densely packed design, helps to characterize the ARL QUANT'X analyzer as a market-leading solution within manufacturing contexts (Figure 2).
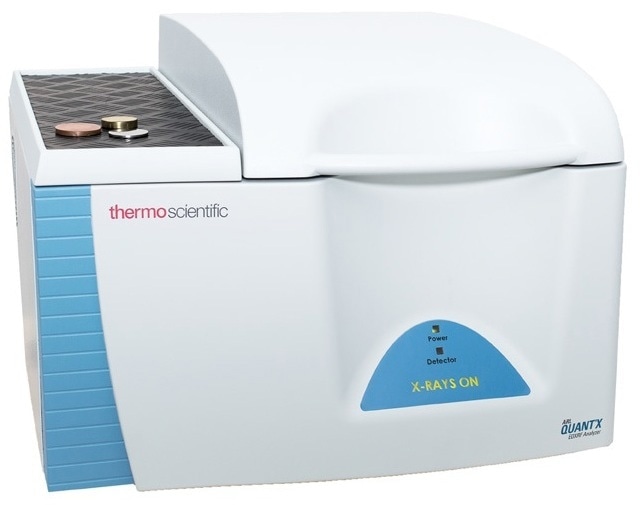
Figure 2. ARL QUANT'X EDXRF spectrometer. Image Credit: Thermo Fisher Scientific - Elemental Analyzers and Phase Analyzers
Experimental
Samples of ilmenite ore from China and Australia were crushed and computed in reflection geometry for 15 minutes for XRD calculations. This was performed under Cu-Kα radiation with a PVC filter and alongside Co-Kα radiation to minimize the fluorescence from Fe.
The MDI JADE 2010 was utilized to perform qualitative and quantitative examinations of the ICDD PDF4+ database. Samples were crushed, subsequently screened to 200 mesh with vibromill, and pressed prior to the EDXRF experiment. In accordance with exclusive Thermo Scientific™ UniQuant™ software, the EDXRF semi-quantitative experiment results were acquired.
Results
Similar results were obtained by qualitative and quantitative phase examination of Ilmenite samples with Co-Kα radiation and the PVC filter. Chemical configuration from XRF and XRD (c.f., Figure 3) is correlated in Table 1.
Table 1. Chemical composition of ilmenite samples from Australia and China measured with XRF. Source: Thermo Fisher Scientific - Elemental Analyzers and Phase Analyzers
| Element |
Australia (in %) |
China (in %) |
| XRF |
XRD |
XRF |
XRD |
| Cu |
Co |
Cu |
Co |
| MgO |
0.27 |
- |
- |
1.19 |
3.0 |
5.3 |
| Al2O3 |
5.27 |
- |
- |
5.77 |
1.3 |
2.5 |
| SiO2 |
1.21 |
- |
- |
5.58 |
3.9 |
8.5 |
| CaO |
0.01 |
- |
- |
2.73 |
1.4 |
2.7 |
| TiO2 |
42.00 |
54.3 |
50.4 |
39.87 |
47.2 |
46.6 |
| MnO |
1.52 |
- |
- |
0.92 |
3.7 |
1.8 |
| Fe2O3 |
48.14 |
50.2 |
54.2 |
42.53 |
43.6 |
38.0 |
| ZrO2 |
0.16 |
- |
- |
0.02 |
- |
- |
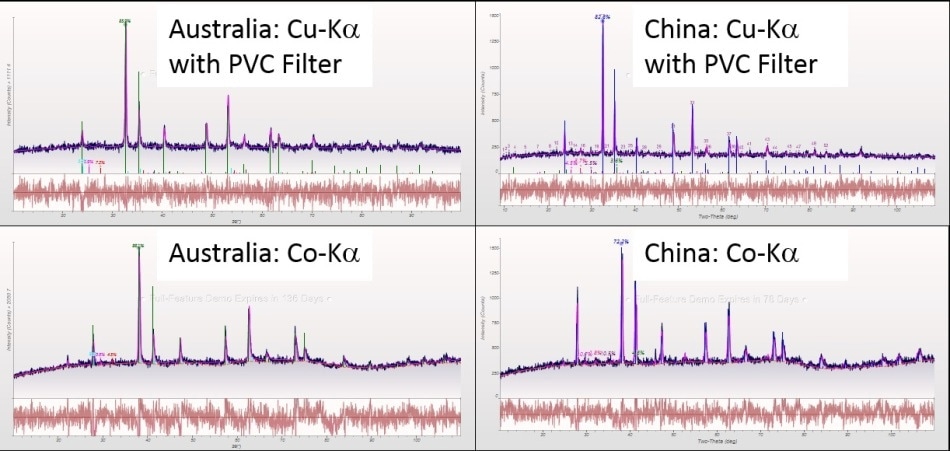
Figure 3. Diffraction patterns of ilmenite ore from Australia (left) and China (right) measured with Cu-Kα and PVC filter (top) and Co-Kα bottom. Image Credit: Thermo Fisher Scientific - Elemental Analyzers and Phase Analyzers
It is important to note that there are solid solutions for multiple compounds within the samples, and the capacity of XRD measurements is restricted by the fact that some compounds may seem formless. Nonetheless, this facilitates clear identification of the primary mineralogy of the samples.
Explicit discrepancies are demonstrated by the mineralogy of the samples between the deposit sources. There are moderate differences between Cu-Kα and Co-Kα measurements, while Australian ore samples comprise only anticipated minerals (valuable raw materials).
In each case, the broad trend is comparable (c.f., Table 2). A more extensive assortment of mineral phases is exhibited by the Chinese ore samples (c.f. Table 3), all of which are linked to ilmenite deposits. Most probably, as a consequence of the enhanced resolution acquired with Co-Kα radiation in comparison to Cu-Kα, there remains a divergence in the Cu-Kα and Co-Kα measurements.
Conclusion
In collaboration with the ARL QUANT’X analyzer, the ARL EQUINOX 100 is an extremely effective analytical introduction into both the field of a comprehensive investigation of ilmenite ore samples and determining their quality.
Integrating a PVC filter into the detector of apparatus also fitted with a Cu-Kα source is an appropriate arrangement to minimize Fe fluorescence. This then enables measurements to be determined, which form the basis of quantitative and qualitative phase analysis.
Furthermore, the collection of XRD data with enhanced resolution is possible by implementing Co-Kα radiation. This data allows for more accurate quantification, especially if phases containing closely spaced reflections or heavy peaks overlap. MDI JADE is an entirely industrialized and user-friendly Rietveld-based software package.
The computation of XRD data takes place alongside the PDF4+ database, which allows the efficient qualification and quantification of samples by the operator, even in batch operation mode. The UniQuant function for XRF, on the other hand, is perfectly designed for use in the chemical analysis of any type of known or unknown samples without necessitating prior calibration measurements.

This information has been sourced, reviewed and adapted from materials provided by Thermo Fisher Scientific - Elemental Analyzers and Phase Analyzers.
For more information on this source, please visit Thermo Fisher Scientific - Elemental Analyzers and Phase Analyzers.