The resulting spectrum reveals electronic transitions within a molecule, offering insights into molecular structure, concentration, purity, and functional groups.1
This article provides a beginner-friendly guide to interpreting UV-Vis spectra and understanding their key features.

Image Credit: Rabbitmindphoto/Shutterstock.com
Understanding the UV-Vis Spectrum
The UV-Vis spectrum is a graphical representation of light absorption. Wavelength (nm) is shown on the x-axis, representing the energy of absorbed light; absorbance or transmittance is plotted on the y-axis. Peaks correspond to specific electronic transitions within molecules.
X-axis: Wavelength
The x-axis shows the wavelength of light, which relates to the energy involved in transitions between molecular orbitals. The ultraviolet region (190–400 nm) reveals higher-energy transitions like σ→σ* and n→σ*, while the visible region (400–800 nm) shows lower-energy transitions such as π→π* and n→π*.
This range helps identify chromophores based on their characteristic absorption wavelengths.
Y-axis: Absorbance
The y-axis represents absorbance, which quantifies the light absorbed by the sample. It is calculated using the logarithmic ratio of incident to transmitted light intensities (A = log(I0/I)).
Higher absorbance values indicate stronger light absorption at specific wavelengths, reflecting the presence and concentration of chromophores within the sample.
Peaks and Absorbance Bands
Each peak corresponds to an electronic transition within a molecule. These transitions occur between different molecular orbitals, such as π→π* transitions in conjugated systems, n→π* transitions in carbonyl compounds, and charge transfer transitions in metal complexes.
The position and shape of these peaks provide insights into the electronic configuration and molecular identity of unknown compounds.1,2
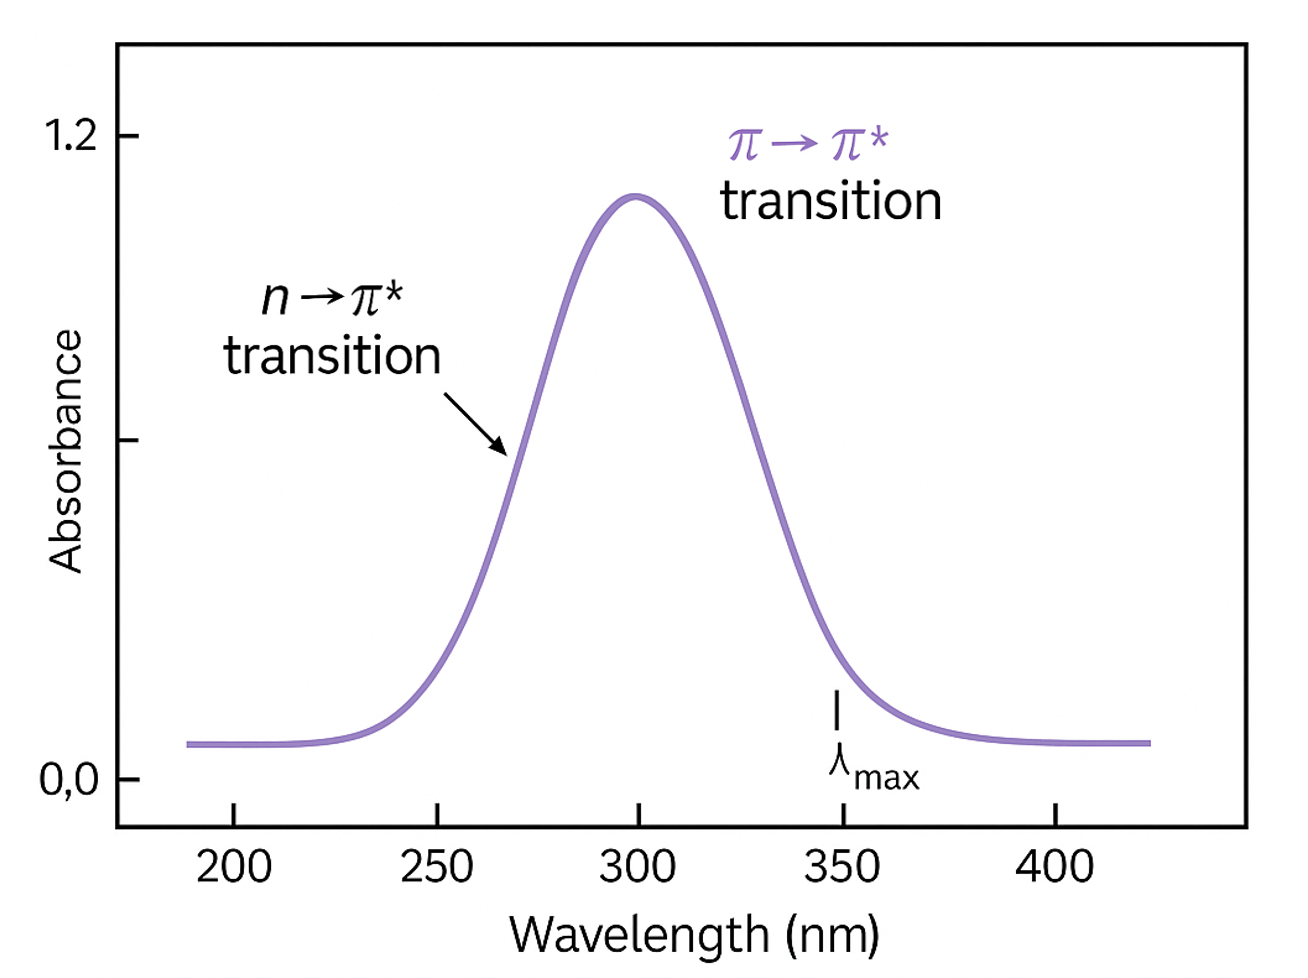
Example of a stylized UV-Vis spectrum highlighting key features. The x-axis indicates the wavelength, and the y-axis represents the absorbance. A single peak corresponding to the λmax (wavelength of maximum absorbance) is labeled, along with n→π* and π→π* electronic transitions. Image generated by ChatGPT (2025).
Key Features of a UV-Vis Spectrum
Several important parameters should be considered when analyzing a UV-Vis spectrum.
Lambda Max
Lambda max (λmax) represents the wavelength at which a compound exhibits its highest absorbance, reflecting the energy required for specific electronic transitions. It is a distinguishing feature for identifying functional groups based on their characteristic absorption behavior.
For example, carbonyl compounds typically show n→π* transitions around 270–300 nm, aromatic compounds display π→π* transitions near 250–280 nm, and conjugated dienes absorb at approximately 220–250 nm.
Peak Intensity
Peak intensity refers to the height of a peak in the absorption spectrum, representing the amount of light absorbed by a sample at a specific wavelength. It is commonly used to estimate the concentration of an absorbing species, as absorbance is directly proportional to concentration, path length, and molar absorptivity.
Higher intensities are typically associated with allowed electronic transitions such as π→π*, while lower intensities are characteristic of forbidden transitions like n→π*, offering insight into the molecular electronic structure.
Shape and Number of Peaks
The shape and number of peaks reflect the molecular complexity and electronic environment of the chromophores.
Sharp, distinct peaks suggest pure samples with discrete transitions, while broad or overlapping peaks can indicate multiple chromophores, molecular aggregation, or solvent interactions. In addition, molecules with several chromophores, or a single chromophore capable of multiple transitions, may exhibit multiple absorption bands.
These spectral features enable the structural characterization of complex systems, including dyes, metal complexes, and biological macromolecules.2,3
How to Interpret Results?
Step 1: Analyzing the Overall Spectrum Pattern
The overall absorption pattern reveals the number and type of chromophores in a molecule. Each chromophore contributes one or more absorption bands based on its electronic transitions.
For example, a nitro group typically exhibits two distinct bands: a weak n→π* transition in the 350–400 nm range and a more intense π→π* transition between 200–250 nm.
The number, position, and intensity of these bands provide information about the type and quantity of chromophores, degree of conjugation, and possible substituent effects, helping to guide initial structural interpretation of the molecule.
Step 2: Identifying Chromophores and Functional Groups
Identifying the chromophores and functional groups in the sample is key to interpreting the spectrum. This involves analyzing the positions and intensities of absorption bands, which correspond to specific electronic transitions characteristic of various functional groups.
These features help differentiate functional groups within a molecule, enabling structural interpretation based on established spectral reference data.
For example, absorption between 250–290 nm typically indicates π→π* transitions in aromatic systems, while bands around 270–300 nm are characteristic of n→π* transitions in carbonyl compounds; σ→σ* transitions in saturated hydrocarbons generally appear below 200 nm.
However, extended conjugation can cause bathochromic shifts, moving the absorption bands to longer wavelengths. For instance, conjugated dienes produce a π→π* band that shifts to longer wavelengths (220–280 nm) with increasing conjugation, reflecting extended electron delocalization.
Step 3: Quantitative Analysis Using Beer-Lambert Law
The Beer-Lambert Law is used to quantitatively determine a sample’s concentration based on its absorption spectrum.
This involves measuring absorbance at the compound’s λmax and applying a calibration curve generated from standards with known concentrations. The slope of this curve represents the product εl (molar absorptivity × path length), allowing for accurate concentration calculations within the linear absorbance range of approximately 0.1 to 1.0
However, deviations from linearity may occur at higher absorbance values due to instrumental limitations or intermolecular interactions, necessitating proper sample dilution for reliable results.
Step 4: Analyzing Spectral Shifts
Spectral shifts provide valuable insight into the molecular environment and interactions affecting the chromophores.
A bathochromic shift (redshift) occurs when absorption moves to longer wavelengths. This is often caused by increased conjugation, solvent polarity effects, or the presence of auxochromes. In contrast, a hypsochromic shift (blueshift) moves absorption to shorter wavelengths, typically indicating reduced conjugation or changes in molecular conformation.
Hyperchromic effects, which increase absorption intensity, are often a result of conformational changes that enhance transition probabilities, while hypochromic effects, which decrease absorption intensity, may suggest aggregation or interactions that restrict electronic transitions.
These shifts and effects help elucidate the structural and environmental factors influencing the absorption characteristics of the compound.
Download your PDF copy now!
Step 5: Correlating Spectra with Possible Structures
Interpreting a UV-Vis spectrum using known spectral data helps identify potential molecular structure. Characteristic absorption bands, along with their wavelengths and intensities, are compared to reference data to identify functional groups and chromophores.
The number, position, and shape of absorption peaks help determine the degree of conjugation, the presence of auxochromes, and specific electronic transitions.
This interpretive process supports the development of plausible structural candidates that align with the observed spectral features.
Step 6: Evaluating Spectral Quality and Reliability
Reliable UV-Vis interpretation depends on the overall quality of the spectrum. This includes verifying baseline stability, minimizing noise, and confirming that key parameters (such as sample concentration, scanning speed, and slit width) are correctly set.
A stable, drift-free baseline reflects proper sample preparation and instrument calibration. Absorbance values within the optimal range (typically 0.1–1.0) also support accurate and reproducible results.
These measures collectively enhance the reliability of the spectral analysis.3-5
Common Mistakes & Troubleshooting
Solvent Selection Errors
Improper solvent selection can significantly impact the UV-Vis spectrum, leading to inaccurate interpretations. For instance, solvents that absorb in the same wavelength range as the sample, such as carbonyl-containing solvents like acetone, can obscure sample absorption, resulting in artifacts.
Solvent polarity can also induce solvatochromic shifts, altering λmax values and complicating analysis. Additionally, hydrogen-bonding solvents like water or alcohols may interact with chromophores, further distorting the spectrum.
Sample Preparation Issues
Errors in sample preparation, such as improper dilution, weighing mistakes, or incomplete dissolution, can cause inaccurate absorbance readings. This can lead to deviations from the Beer-Lambert Law, potentially resulting in non-linear responses or detector saturation.
Incomplete dissolution can scatter light, particularly at shorter wavelengths, masking the true molecular absorption spectrum. Chemical degradation during preparation may also generate new chromophores or modify existing ones, introducing misleading spectral features.
Instrumental Factors
Instrumental limitations can compromise spectrum quality. For instance, stray light from imperfect monochromators may reduce absorbance readings at high concentrations, lowering quantitative accuracy.
Bandwidth effects can cause peak broadening and reduce resolution, making it harder to distinguish closely spaced absorption bands.
Cuvette-Related Problems
Scratched or dirty cuvettes scatter light, increasing apparent absorbance and distorting baseline measurements. Fingerprints or residues on optical surfaces absorb light and introduce artifacts in the spectrum.
Mismatched cuvettes between the sample and reference can introduce systematic errors due to differences in path length or transmission characteristics. To avoid this, use optically matched cuvettes from the same manufacturing batch.
Light Scattering and Interference
Light scattering caused by suspended particles, air bubbles, or contaminants in the sample can distort absorbance readings and reduce reproducibility, particularly at shorter wavelengths. Ensuring sample clarity and proper handling is crucial for accurate results.
Additionally, the presence of multiple absorbing species with overlapping spectra can complicate spectral interpretation, requiring the isolation of individual contributions for accurate analysis.1,5
Interpreting UV-Vis spectra involves analyzing key features such as absorption peaks and λmax values, while accounting for factors like sample preparation, solvent effects, and instrument calibration. Accurate interpretation depends on careful control of these variables, ensuring reliable insights into a compound’s structure, concentration, and functional groups.
For a detailed walkthrough of UV-Vis spectroscopy, watch:
UV/Vis spectroscopy | Spectroscopy | Organic chemistry | Khan Academy
To learn more about spectroscopy, visit: The Different Types of Spectroscopy for Chemical Analysis
References and Further Reading
- Tom, J. (2023). UV-Vis Spectroscopy: Principle, Strengths and Limitations and Applications. [Online]. Available at: https://www.technologynetworks.com/analysis/articles/uv-vis-spectroscopy-principle-strengths-and-limitations-and-applications-349865
- Dr. Dietmar Kennepohl, Steven Farmer, William Reusch, Professor Emeritus. (2025). Interpreting UV Spectra. [Online]. Available at: https://courses.lumenlearning.com/suny-mcc-organicchemistry/chapter/interpreting-uv-spectra/
- William Reusch. (2013). Visible and Ultraviolet Spectroscopy. [Online]. Available at: https://www2.chemistry.msu.edu/faculty/reusch/virttxtjml/spectrpy/uv-vis/spectrum.htm
- Pratiwi, R. A., & Nandiyanto, A. B. D. (2022). How to read and interpret UV-VIS spectrophotometric results in determining the structure of chemical compounds. Indonesian Journal of Educational Research and Technology, 2(1), 1-20. https://doi.org/10.17509/ijert.v2i1.35171
- Akash, M. S. H., & Rehman, K. (2020). Essentials of pharmaceutical analysis (pp. 167-174). Singapore:: Springer. https://doi.org/10.1007/978-981-15-1547-7
Disclaimer: The views expressed here are those of the author expressed in their private capacity and do not necessarily represent the views of AZoM.com Limited T/A AZoNetwork the owner and operator of this website. This disclaimer forms part of the Terms and conditions of use of this website.