Typically, when it comes to quantitative elemental analysis of a range of material types (such as metals, petrochemical and geochemical materials, mining and cement, and glass and ceramics), wavelength dispersive XRF spectrometers are the equipment of choice. These samples are presented as uniform and homogenously prepared samples to the XRF instrument.
A new dimension of analysis is offered by the Thermo Scientific ARL PERFORM’X spectrometer: surface mapping. Users can consider contamination, heterogeneity, segregation, gradient, and inclusion determination, all of which can be taken into account by the mapping capability.
This mapping option of the ARL PERFORM’X also allows the construction of detailed composite maps of elemental distribution in the sample. Excellent analysis for process improvement and problem-solving applications is provided by the fine step resolution of 0.1 mm.
The gap between conventional bulk analysis and standard micro-analysis using microscopic techniques such as scanning electron microscopy (SEM) is therefore bridged by this ability.
Instrument
For these tests, the ARL PERFORM’X spectrometer used was a 4200 W system (Figure 1). The ARL PERFORM’X spectrometer features a standard configuration with four collimators, six primary beam filters, two detectors, up to nine crystals, and five GN Rh X-Ray tubes for best performance, ranging from heavy to ultra-light elements.
Mapping and small spot analysis (1.5 mm and 0.5 mm areas) are also features of the ARL PERFORM’X analyzer.
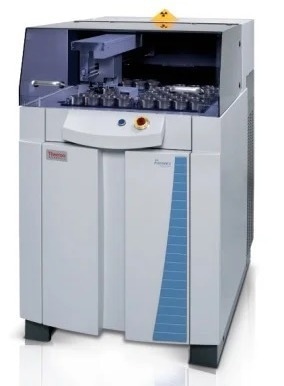
Figure 1. Thermo Scientific ARL PERFORM’X Spectrometer Series. Image Credit: Thermo Fisher Scientific - Elemental Analyzers and Phase Analyzers
Geological Samples: Mapping
The ARL PERFORM’X mapping of the examined geological sample, as shown in the following example, demonstrates the possibility of defining and locating crystalline structures and grain boundaries that are not visible to the naked eye (Figure 2).
Typically, the formation of pseudotachylite is studied without reference to its chemistry, but in this illustration, there is clearly a wealth of chemical information that has a bearing on the genesis of the material. Large gradients are shown by Al, Si, K, Ca and Fe, while there is a more even distribution in Na, Mg, Ti and Sr (Figure 3).
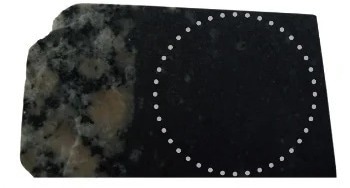
Figure 2. Pseudotachylite sample with analyzed area. Image Credit: Thermo Fisher Scientific - Elemental Analyzers and Phase Analyzers
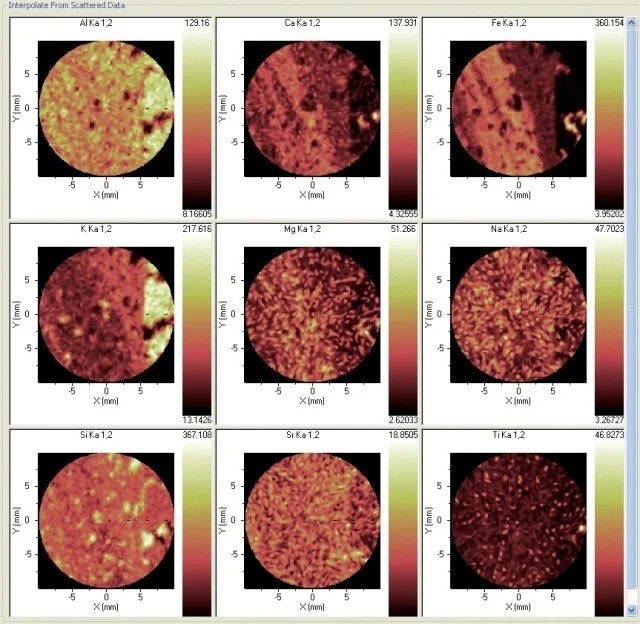
Figure 3. Distribution of nine elements in the sample. Image Credit: Thermo Fisher Scientific - Elemental Analyzers and Phase Analyzers
Figures 4 and 5 offer another example, with a feldspar sample presenting an inhomogeneous structure. The element constituents are determined by the ARL PERFORM’X in the selected section of the sample.
The chemistry differences between the two feldspars are the most interesting aspects of this analysis, as is how the plagioclase comes to mantle the earlier alkali feldspar. A great degree of fundamental information is offered by the chemistry regarding this process.
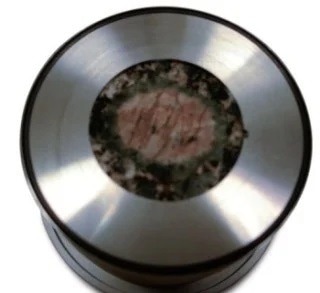
Figure 4. Heterogeneous feldspar sample seen in the 30 mm aperture sample holder. Image Credit: Thermo Fisher Scientific - Elemental Analyzers and Phase Analyzers
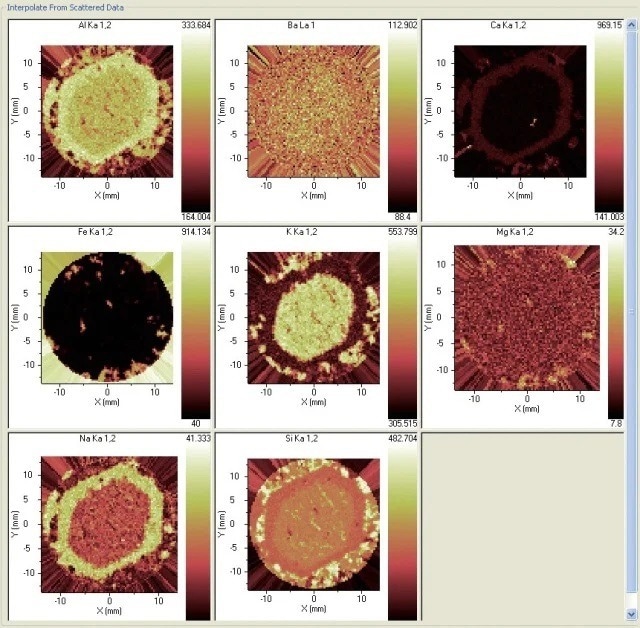
Figure 5. Distribution of eight elements in the sample. Image Credit: Thermo Fisher Scientific - Elemental Analyzers and Phase Analyzers
Metallic Samples: Mapping
When it comes to the identification and quantification of contamination or metallic inclusions, mapping can be utilized to great effect, as shown in figures 6 to 9.
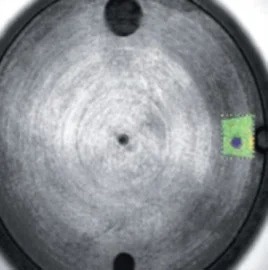
Figure 6. Selected area for mapping in green. Image Credit: Thermo Fisher Scientific - Elemental Analyzers and Phase Analyzers
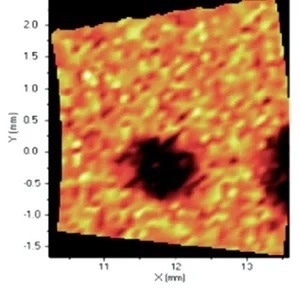
Figure 7. Distribution of Cr. Image Credit: Thermo Fisher Scientific - Elemental Analyzers and Phase Analyzers
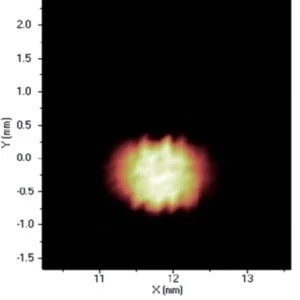
Figure 8. Distribution of Cu. Image Credit: Thermo Fisher Scientific - Elemental Analyzers and Phase Analyzers
Figure 9. Distribution of Fe. Image Credit: Thermo Fisher Scientific - Elemental Analyzers and Phase Analyzers
Standard-Less Analysis for Mapping
The most effective development of XRF analytical programs has been the availability of “standard-less” Thermo Fisher Scientific (Ecublens) SARL, Switzerland (ISO certified).
This allows quantitative data to be obtained even for completely unknown samples. Of course, obtaining any or enough standards to create a calibration is not always possible, as in many real-life situations. Certainly, this is the case regarding the analysis of defects or unknown contamination.
To tackle such situations, the most comprehensive standard-less software on the market is unparalleled: the Thermo Scientific UniQuant package.
Factory calibration is included in the software: based on 64 pure element standards, this calibration uses complex mathematical algorithms for up to 79 elements to determine the concentration of unknown samples in any matrix. These algorithms correct for matrix and inter-elemental effects to provide an accurate quantitative result.
Conclusion
An excellent tool for all applications concerning heterogeneity or concentration gradients in samples, the elemental mapping capability is also vital when inclusions or impurities are found in given specimens.
The ARL PERFORM’X sequential XRF spectrometer can clearly and easily perform analysis using mapping. Easy operational capability is secured, thanks to the sophisticated Thermo Scientific OXSAS software operated using the latest Microsoft Windows 7 packages.

This information has been sourced, reviewed and adapted from materials provided by Thermo Fisher Scientific - Elemental Analyzers and Phase Analyzers.
For more information on this source, please visit Thermo Fisher Scientific - Elemental Analyzers and Phase Analyzers.