Elemental analysis of solid iron and steel samples can be performed by cost-effectively, rapidly and easily using optical emission spectrometry (OES). An OES spectrometer platform, the Thermo Scientific™ ARL iSpark™ Series metals analyzer (Figure 1) delivers superior performance with unprecedented accuracy and precision to analyze steel and iron from trace to alloying element levels.
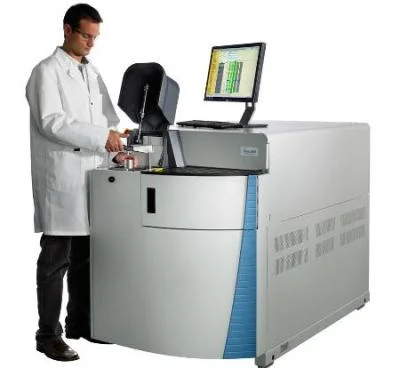
Figure 1. The Thermo Scientific™ ARL iSpark™ Series metals analyzer. Image Credit: Thermo Fisher Scientific - Elemental Analyzers and Phase Analyzers
The ARL iSpark can perform ultra-fast inclusion analysis in addition to spectrochemical analysis using Spark-DAT (Spark Data Acquisition and Treatment) methods. Within the steel industry, methods such as these are gaining attention, particularly for their ability to deliver data during the steel elaboration process about the inclusions.
This article outlines both the Standard Inclusion Analysis option and the Advanced Inclusion Analysis option, which are both available with the Thermo Scientific™ ARL iSpark™ Series metals analyzer.
Principles of the Spark-DAT Analysis
The ARL iSpark enables different treatment principles to be used along side the Spark-DAT methods compared to OES concentration analyses. Rather than integrating and translating into concentration, the light intensity values for all the single sparks are presented to a special mathematical treatment.
The sample composition at the position struck by the corresponding single spark determines the intensity of a single spark signal. The outcome will be an intensity peak if the concentration of an element in the ablated sample material is significantly larger than the concentration of its soluble form in the matrix.
Advantages of ARL iSpark with Optional Spark-DAT Methods
Users can yeild the following benefits when using the ARL iSpark metals analyzer with standard Spark-DAT methods:
- Being able to perform both inclusion analysis and elemental concentration analysis notably reduces investment costs for inclusion analysis
- The ability to provide data on inclusions rapidly after taking a sample, therefore, offers key insights for the in-process control of the metal elaboration
- The convenient detection of randomly distributed exogenous inclusions and rapid analysis of very large surface areas
- Much less time is needed for inclusion analysis and associated sample preparation
- Inclusion analysis performed concurrently with the analysis of elemental concentrations for over 30 samples per hour
- Inclusion analysis can be performed on all samples analyzed by OES
- Minimal time and cost are ensured for operations as sample preparation, maintenance, and service are equal to the standard ARL iSpark spectrometer.
There are, of course, further benefits that are offered by advanced Spark-DAT applications. These include:
- The enabling of quantitative oxygen analysis in killed steels at even lower levels than 30 ppm reducing the requirement for expensive combustion analysis
- The determination of quantitative inclusion size and size distribution, which offers comprehensive inclusion data, particularly during the steel elaboration.
Practical Aspects and Analysis Time
Software and specialized algorithms are included in the Spark-DAT methods and are only offered with PMTs. Single Spark Acquisition (SSA) is used to obtain single spark intensities, which are utilized for conventional elemental concentration analysis and inclusion analysis. SSA can therefore be used to perform the two types of analyses concurrently.
The values pertaining to the data of interest are measured via fast dedicated algorithms, given that the Spark-DAT raw dataset is very large and complex. The analytical software can therefore be used to process the resulting values like traditional OES results.
The Spark-DAT analysis, when performed alone, usually takes 7 seconds for a single measurement, including 2 seconds of Ar flush. This mode is only appropriate for confirmation of inclusion types, rapid counting, and acquiring raw data for off-line interpretation.
Basic Applications of Spark-DAT Methods on Standard Inclusion Analysis Option
The Standard Inclusion Analysis option offered some significant benefits:
- Inclusion control to assist with quality assurance
- Process control through on-line monitoring of inclusions
- Ability to screen hundreds of samples per day for inclusions
- Ability to evaluate the number and type of inclusions
- An effective replacement of time-consuming or expensive analysis techniques.
Soluble/Insoluble Contents of Elements
A long-established and widely-used indicator of the steel fabrication process is the soluble or insoluble part concentration of elements like B, Ti, Ca, and Al. This is why the algorithm Insoluble is one of the more widely used Spark-DAT applications, which depends on estimating the soluble or insoluble part of an element.
The ratio Rinsol of the sum of intensity signals attributable to the matrix insoluble part to the sum of all the intensity signals is calculated by the algorithm Insoluble.
The Insoluble Spark- DAT method does not require calibration samples for soluble/insoluble concentrations, which therefore enables the method to be used for any partly insoluble element – this might include Ti, Ca, and B, or for cases where there is no certified reference material (CRM) available.
The following table shows the accuracy of the Insoluble Spark- DAT method obtained on CKD low alloy steel standards having certified Alsol concentrations:
Source: Thermo Fisher Scientific - Elemental Analyzers and Phase Analyzers
| Sample |
180A |
181A |
182A |
183A |
184A |
| Certified values |
Altot |
0.0001 |
0.016 |
0.023 |
0.15 |
0.022 |
| Al sol |
0.0001 |
0.014 |
0.017 |
0.141 |
0.016 |
| Uncertainty U on Al sol |
0.0001 |
0.001 |
0.002 |
0.006 |
0.002 |
| Spark-DAT values |
Al sol |
0.0001 |
0.0156 |
0.0199 |
0.1491 |
0.0206 |
| Sample |
185A |
186A |
187A |
188A |
189A |
| Certified values |
Altot |
0.06 |
0.042 |
0.019 |
0.093 |
0.041 |
| Al sol |
0.054 |
0.038 |
0.017 |
0.083 |
0.039 |
| Uncertainty U on Al sol |
0.004 |
0.003 |
0.002 |
0.004 |
0.003 |
| Spark-DAT values |
Al sol |
0.0591 |
0.0409 |
0.0189 |
0.0923 |
0.0409 |
Estimation of Number and Type of Inclusions
The simplest application of the Spark-DAT methods is using the algorithm peaks to count intensity peaks on the channel of a specific element. Counting intensity peaks enables the number of inclusions with this element to be calculated.
It is possible, therefore, as delineated in Figure 2, to determine clean and dirty steel samples easily simply through comparison of the number of peaks that are counted on the channels of the inclusion elements.
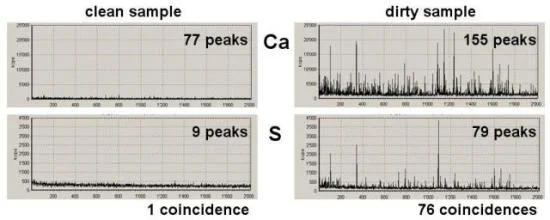
Figure 2. Comparison of the number of peaks counted on the channels of the inclusion elements helps identifying clean and dirty steel samples. Image Credit: Thermo Fisher Scientific - Elemental Analyzers and Phase Analyzers
Coincidental peaks appearing on the channels of different elements simultaneously during the same single spark can be counted by the algorithm Composition.
The algorithm Composition can count coincidences of up to four channels which enables the chemical formulation of inclusion clusters or complicated inclusions (Figure 3). Moreover, ambiguities on the inclusion type are eliminated by the option to check for non-coincidences as well as coincidences.
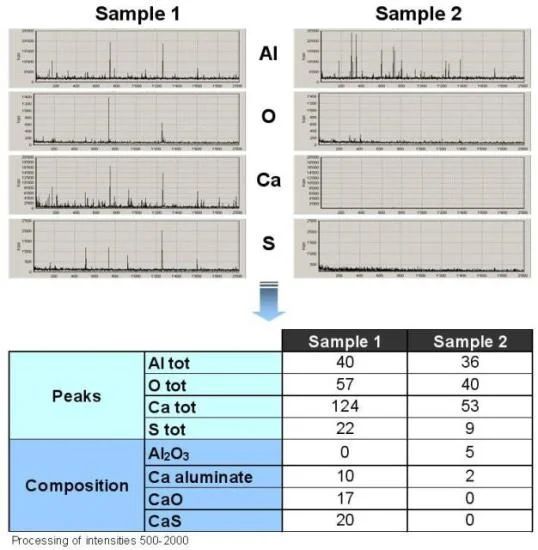
Figure 3. Coincidences of up to four channels can be counted with the algorithm Composition. Image Credit: Thermo Fisher Scientific - Elemental Analyzers and Phase Analyzers
Qualitative Size and Size Distribution
It is essential to understand the size of the inclusions or their size distribution since large inclusions normally affect the metal quality. It is possible to use Peaks and Composition, the two algorithms, to count signals that pertain to different intensity classes. Setting the threshold 3•SD greater than the intensity of the element in the matrix enables all the visible peaks to be counted. Evaluating the inclusions between consecutive threshold values yields the count of inclusions in the size class that they delimit.
Figure 4 highlights an example of the count of peaks and coincidences between 3 and 9.SD relative to small size inclusions, between 9 and 15.SD to medium size inclusions, and over 15 to large size inclusions. Qualitative inclusion size distributions can be produced by such evaluations.
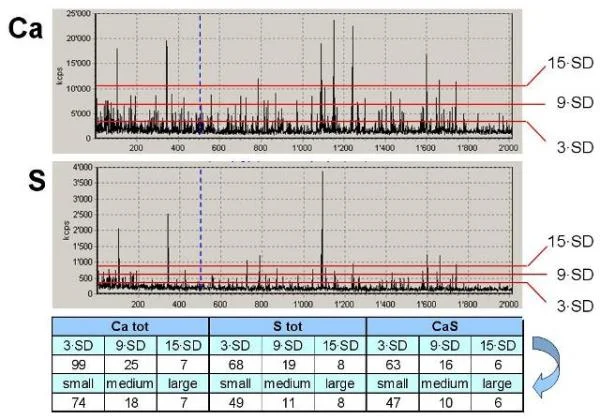
Figure 4. Calculating the inclusions between consecutive threshold values provides the number of inclusions in the size class that they delimit. Image Credit: Thermo Fisher Scientific - Elemental Analyzers and Phase Analyzers
Further Benefits of Advanced Spark-DAT Applications
The algorithm Quantification of Inclusion Content, or QuIC, yields the insoluble fraction of an element owing to its existence in a specific type of inclusion for numerous peak intensity classes. This then facilitates the estimation of the average ESD, or Equivalent Spherical Diameter, of inclusions for the relative size classes.
Quantitative Size Determination
It is vital to understand the size of the inclusions or their size distribution, given that large inclusions typically affect the metal quality.
As mentioned earlier, the algorithms Peaks and Composition can be used for measuring signals relative to classes of different intensity but only facilitate the construction of diagrams of qualitative size distribution.
The Spark-DAT algorithm QuIC, conversely, facilitates quantitative analysis of inclusions in terms of both size and size distribution. An example of a size distribution diagram is illustrated in Figure 5.
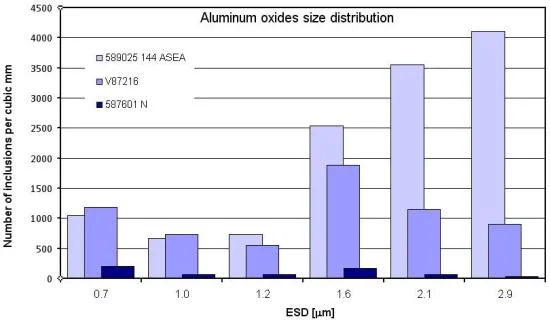
Figure 5. An example of a size distribution diagram. Image Credit: Thermo Fisher Scientific - Elemental Analyzers and Phase Analyzers
Quantitative Oxygen Analysis at Low Concentration
Estimating the total oxygen concentration directly from the data acquired on the oxide inclusions (composition and concentration) is enabled by the Advanced Inclusions Analysis with the Spark-DAT algorithm QuIC. As a quantitative method, it calculates the concentration of oxygen by OES even lower than 30ppm, as delineated in Figure 6.
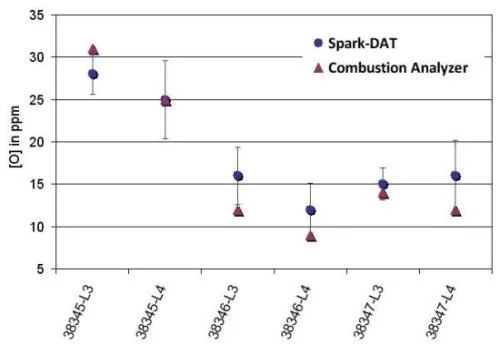
Figure 6. The comparison results obtained with a combustion analyzer for low alloy steel samples taken in the continuous casting mold (samples and combustion results with permission of R. Dumarey and F. Medina, from ArcelorMittal, Gent). Image Credit: Thermo Fisher Scientific - Elemental Analyzers and Phase Analyzers
The quantitative oxygen analysis is illustrated in Figure 7, wherein the Spark-DAT algorithm QuIC is utilized to compare total oxygen concentrations obtained by measuring a number of CRMs with their certified values.
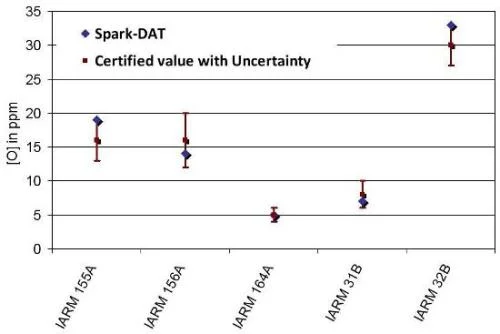
Figure 7. Comparison of total oxygen concentrations obtained by measuring several CRMs with their certified values. Image Credit: Thermo Fisher Scientific - Elemental Analyzers and Phase Analyzers
Other Applications of the Algorithm QuIC
There are a range of other applications of the Algorithm QuIC:
- Area fraction (otherwise known as surface fraction Sf) (i.e., the fraction of the surface occupied by the inclusions of the given type)
- The concentration of an inclusion type
- Insoluble concentration (or fraction) of an element as a specific type of inclusion.
On-Line Analysis and Off-Line Investigations
The Spark-DAT results, count of intensity peaks and coincidental peaks with concentration values can be concurrently monitored with the Spark-DAT results. The Spark-DAT result can then be processed, displayed, transmitted, and stored like any standard OES result.
An OXSAS screen depicting partial results of an analysis, including elemental determinations and inclusion-related data (peak counts, inclusion counts and size), is shown in Figure 8.
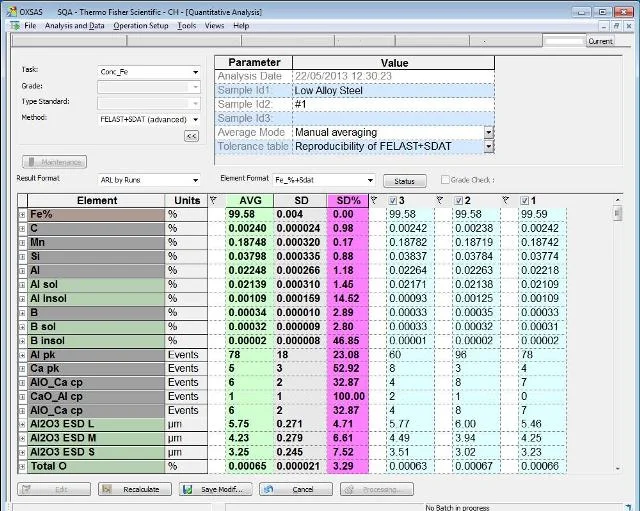
Figure 8. An OXSAS screen depicting partial results of an analysis including elemental determinations and inclusion related information. Image Credit: Thermo Fisher Scientific - Elemental Analyzers and Phase Analyzers
The Spark-DAT intensity data can be stored in standard text (.txt) or comma separated value (.csv) files. These files can then be utilized off-line for research and development of new techniques or algorithm, or subsequent analysis on inclusions. These can then be graphically represented with the Spark-DAT viewer integrated in OXSAS.
Part of Thermo Scientific’s work is to continue improving existing algorithms or creating new algorithms, which existing users can then access together with OXSAS upgrades.
Conclusion
When coupled with the optional Spark-DAT methods, the ARL iSpark metals analyzer transforms into a versatile instrument. Spark-DAT methods offer convenient, rapid, and economical solutions within the steel industry for inclusion analysis for routine use or research.
Ultra-fast on-line qualitative inclusion analysis, like counting of inclusions and determination of their type, is facilitated by the standard Inclusion Analysis Spark-DAT methods.
Quantitative inclusion analysis, including size determination, determination of total oxygen content and other parameters, are all facilitated by the Advanced Inclusion Analysis Spark-DAT method within just a few seconds to a matter of minutes. This, therefore, renders the Advanced Inclusion Analysis Spark-DAT method an effective tool to be used to control steel cleanness and inclusions during production.

This information has been sourced, reviewed and adapted from materials provided by Thermo Fisher Scientific - Elemental Analyzers and Phase Analyzers.
For more information on this source, please visit Thermo Fisher Scientific - Elemental Analyzers and Phase Analyzers.