Within the cement industry, there is increasing interest in the process of monitoring limestone concentration, of which the major constituent is calcium carbonate (CaCO3). Based on the type of cement required, newer European regulations allow for the addition of limestone as filler in concentrations up to 30%.
Image Credit: Thermo Fisher Scientific - Elemental Analyzers and Phase Analyzers
It is therefore economically imperative that cement manufacturers can control calcium carbonate concentrations in their materials to ensure the conformity, uniformity and quality of the final product.
The technique of X-Ray Fluorescence (XRF), among other methods, can facilitate this analysis. It must be noted, however, that XRF analysis is not directly correlated to a phase (e.g., CaCO3), offering instead just the total carbon concentration.
There are also some difficulties with the XRF analysis of carbon (CKα), which include the following challenges:
- There is a poor fluorescence yield of light elements like carbon, and the carbon fluorescence only escapes from a highly thin layer at the surface of the sample (about 0.2 um) thanks to matrix absorption. The volume of sample effectively measured for carbon analysis by XRF is therefore very small.
- Inconsistent XRF results can be produced due to surface contamination and the addition of binding/grinding agents (which are usually organic materials, such as stearic acid) as a result of their carbon content. To enhance the pellet stability under vacuum, binding agents are utilized. Thus, sample homogeneity and preparation have become vital factors when it comes to obtaining a precise analysis of the carbon content using XRF.
- Measurement of carbon by XRF guarantees that all errors are multiplied by a factor of 8 when converting to limestone concentrations. The X-Ray Diffraction (XRD) technique, on the other hand, can analyze only a specific phase (CaCO3 in this case).
Moreover, due to the following factors, XRD intensities are not impacted by the factors mentioned above:
- The analysis of a larger (about 10 times) volume of the sample than with XRF thanks to the high energy of the incident radiation used, which makes the XRD analysis more representative.
- The CaCO3 phase is not contained by surface contamination, organic binders or grinding aids, so they, therefore, do not alter the limestone analysis.
Instrumentation and Samples
The Thermo Scientific ARL 9900 Series (Figure 1) is a spectrometer that can be fitted with several XRF monochromators for major oxides analysis and a diffraction (XRD) system that is able to measure free lime (CaO) and calcite (CaCO3) phases. In addition, for qualitative or semi-quantitative investigations and sequential analysis of any of 83 elements of the periodic table, an XRF goniometer can be installed.
XRF and XRD analysis can be performed on the same sample by this instrument with the same hardware and in the same software environment. Qualitative scans and quantitative analysis can be performed by the diffraction system. The proven technology of the Thermo Fisher Scientific facilities this - namely the Moiré fringe positioning mechanisms.
Peak search and peak integration can be performed for accurate analysis, given that the peak positions and backgrounds in XRD are sensitive to different parameters (e.g., grain size, matrix effects). However, peak intensities have only been used in the following case study due to the fact that no significant peak shifts have been recorded.
Finely ground clinkers, and a series of industrial cement samples classified as grey and white cements, were used as powders. All samples were pressed for 40 seconds at 15 t without a binder.
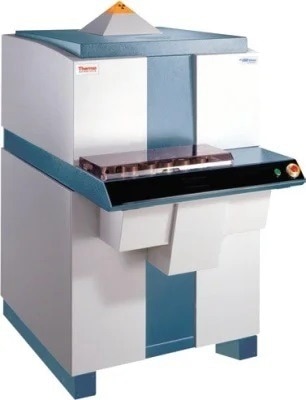
Figure 1. Thermo Scientific ARL 9900 Series. Image Credit: Thermo Fisher Scientific - Elemental Analyzers and Phase Analyzers
Results and Discussion
The XRD scans of three white cement samples, each with different concentrations of CaCO3, are shown in Figure 2. In each of the scans, two distinct peaks can be identified. The peak at 2.447 Å is attributed to the C3S phase, while the diffraction peak at 2.495 Å is assigned to calcite. Quantitative analysis without a correction for overlap is enabled as the two peaks are well-separated.
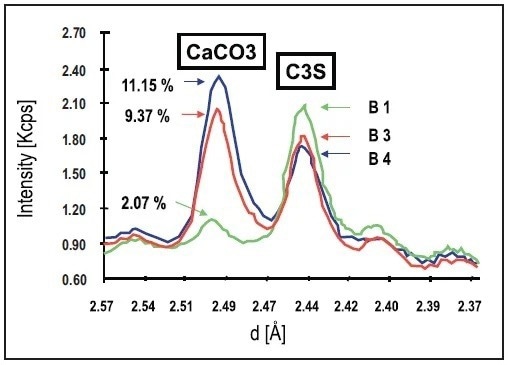
Figure 2. XRD scans on three white cement pellets containing different concentrations of CaCO3. Image Credit: Thermo Fisher Scientific - Elemental Analyzers and Phase Analyzers
The calibration curve obtained using the CaCO3 peak intensity in a set of 6 white cement and clinker standards is presented in Figure 3.
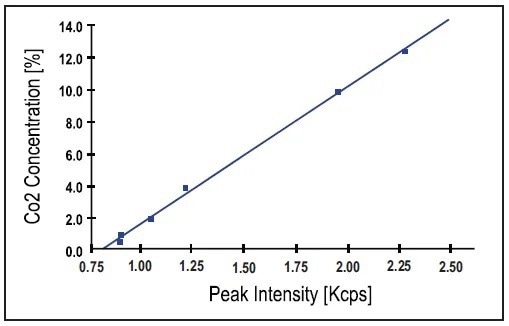
Figure 3. Calibration curve obtained using 6 white cement and clinker standards. Note that CaCO3 peak intensity is used as measured (no background correction). Image Credit: Thermo Fisher Scientific - Elemental Analyzers and Phase Analyzers
Table 1 summarizes the regression results.
Table 1. Regression results on white cements. Source: Thermo Fisher Scientific - Elemental Analyzers and Phase Analyzers
| Sample |
Intensity
[Kcps] |
Concentrations
given [%] |
Found
[%] |
Diff.
[%] |
| Clinker 1 |
0.883 |
0.55 |
0.73 |
0.18 |
| Clinker 2 |
0.890 |
0.80 |
0.78 |
-0.02 |
| Cement B 1 |
1.062 |
2.07 |
2.10 |
0.03 |
| Cement B 2 |
1.233 |
3.65 |
3.41 |
-0.24 |
| Cement B 3 |
2.000 |
9.37 |
9.29 |
-0.08 |
| Cement B 4 |
2.260 |
11.15 |
11.27 |
0.12 |
| Standard error of estimate |
|
|
|
0.17 |
| Sensitivity |
|
|
|
131 cps/% |
| Limit of detection (100s) |
|
|
|
645 ppm |
An excellent correlation between the nominal concentrations (expressed as CO2) and the XRD intensities is enabled by a standard error of estimate (SEE) of 0.17%. Another calibration curve produced with a set of 8 grey cement standards using the relevant parameters in Table 2 is shown in Figure 4.
The quality of the regression – and hence that of the analysis on the Total Cement Analyzer – is shown again as a SEE of 0.08%. Sample Cement 3 underwent short-term and long-term stability tests. The excellent standard deviation of 0.024 % at a level of 7.17 % CO2 (CaCO3 expressed as CO2) was given by an average of 21 analyses (each for 100 seconds).
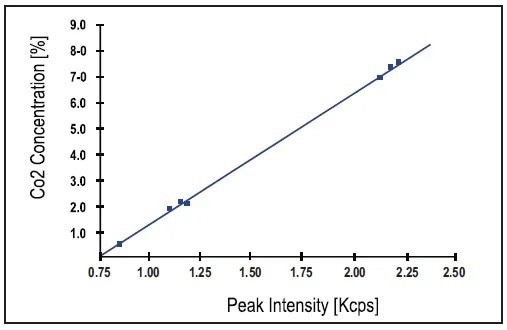
Figure 4. Calibration curve obtained using 8 grey cement standards also with peak intensities. Image Credit: Thermo Fisher Scientific - Elemental Analyzers and Phase Analyzers
Table 2. Regression results on grey cements. Source: Thermo Fisher Scientific - Elemental Analyzers and Phase Analyzers
| Sample |
Intensity
[Kcps] |
Concentrations
given [%] |
Found
[%] |
Diff.
[%] |
| Cement 1 |
1.917 |
7.17 |
7.23 |
0.06 |
| Cement 2 |
1.964 |
7.55 |
7.52 |
-0.03 |
| Cement 3 |
1.946 |
7.45 |
7.41 |
-0.04 |
| Cement 4 |
1.044 |
1.90 |
1.85 |
-0.05 |
| Cement 5 |
1.103 |
2.07 |
2.21 |
0.14 |
| Cement 6 |
1.077 |
2.15 |
2.05 |
-0.10 |
| Cement 7 |
0.815 |
0.45 |
0.44 |
-0.01 |
| Cement 8 |
0.813 |
0.40 |
0.42 |
0.02 |
| Standard error of estimate |
|
|
|
0.08 |
| Sensitivity |
|
|
|
162 cps/% |
| Limit of detection (100s) |
|
|
|
505 ppm |
Conclusion
It is shown by these results that, using the ARL 9900’s integrated diffraction system, CaCO3 (limestone) can be quantified with:
- High sensitivity
- Consistency
- Strong stability of analysis in cements
When coupled with the previous report on free lime analysis in clinkers, this report clearly demonstrates that the same integrated diffraction system can be used to monitor two major phases needed for quality control in cement plants.
Complete quality control of clinker and cement can be provided by the combination of XRF and XRD in the same instrument. This eliminates the need for separate instruments or methods, resulting in notable cost-effectiveness through increased operator efficiency and lower running costs.

This information has been sourced, reviewed and adapted from materials provided by Thermo Fisher Scientific - Elemental Analyzers and Phase Analyzers.
For more information on this source, please visit Thermo Fisher Scientific - Elemental Analyzers and Phase Analyzers.