Single component fused silica (SiO2) is the simplest form of glass. However, it must be noted that this material is both highly expensive and very difficult to process. Thus, in an attempt to help minimize these difficulties, some other oxides are added, offering specific properties to the resultant glass.
Most glasses are made up of approximately 70% silica, which is a glass former, lime as a stabilizer in the form of limestone (about 10%), and soda as a flux in the form of carbonate and sulfate (about 14%).
Other types of oxides enhance the physical characteristics of glass, like alumina or magnesia, and particularly improve the resistance to atmospheric conditions. The incorporation of different metallic oxides, such as chromium, iron, manganese or copper oxides, ensures in-depth coloring.
Instrumentation
An ARL OPTIM’X XRF spectrometer from Thermo Electron (Figure 1) has been used within this study to derive limits of precision and detection for the analysis of glass.
As a wavelength dispersive system which offers superior resolution and light elements capability, the ARL OPTIM’X has a maximum power of 50 W and is fitted with an air-cooled Rh End-Window Tube featuring a thin Be window (0.075 mm).
The performance of the ARL OPTIM’X is similar to a 200 W conventional WD-XRF instrument as a result of the close coupling between the X-Ray tube anode and the sample. The instrument can be integrated with the unique SmartGonio, a series of Multichromators, or both.
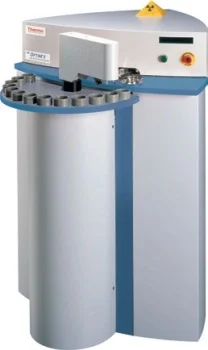
Figure 1. ARL OPTIM’X XRF Spectrometer. Image Credit: Thermo Fisher Scientific - Elemental Analyzers and Phase Analyzers
Limits of Detection & Calibration
An ARL OPTIM’X was used to measure a series of pressed glass samples. Relating intensities for each oxide (or element) to concentrations in standard samples was performed to derive calibration curves.
Though X-Ray fluorescence measures pure elements, the results can be directly related to the oxide forms of such elements (when there is only one single form present in the sample). Limits of detection have been derived utilizing the calibration curves and deploying SmartGonio for the most common oxides/elements found in soda-lime glasses (Figure 2).
Limits of detection for various elements in soda-lime glasses prepared as pressed powders are shown in Figure 1.
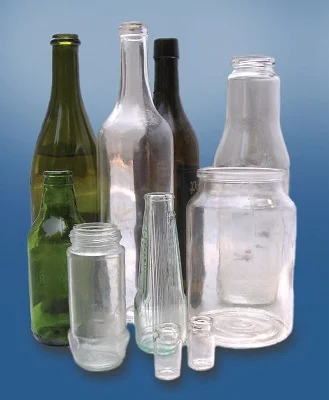
Figure 2. Soda-lime glasses. Image Credit: Thermo Fisher Scientific - Elemental Analyzers and Phase Analyzers
Table 1. Analytical parameters and limits of detection for various oxides/element in soda-lime glass (100 sec. counting time). Source: Thermo Fisher Scientific - Elemental Analyzers and Phase Analyzers
| OXIDE/ELEMENT |
LINE |
CRYSTAL |
DETECTOR |
LOD [PPM] |
| Na2O |
Kα1,2 |
AX-06 |
FPC |
100 |
| MgO |
Kα1,2 |
AX-06 |
FPC |
60 |
| Al2O3 |
Kα1,2 |
PET |
FPC |
47 |
| SiO2 |
Kα1,2 |
PET |
FPC |
N.R. |
| P2O5 |
Kα1,2 |
PET |
FPC |
48 |
| SO3 |
Kα1,2 |
PET |
FPC |
23 |
| Cl |
Kα1,2 |
PET |
FPC |
24 |
| K2O |
Kα1,2 |
LiF 200 |
FPC |
14 |
| CaO |
Kα1,2 |
LiF 200 |
FPC |
12 |
| TiO2 |
Kα1,2 |
LiF 200 |
FPC |
12 |
| Cr2O3 |
Kα1,2 |
LiF 200 |
FPC |
9 |
| MnO |
Kα1,2 |
LiF 200 |
FPC |
9 |
| Fe2O3 |
Kα1,2 |
LiF 200 |
FPC |
9 |
| ZnO |
Kα1,2 |
LiF 200 |
SC |
3.6 |
| SrO |
Kα1,2 |
LiF 200 |
SC |
2.4 |
| ZrO2 |
Kα1,2 |
LiF 200 |
SC |
1.8 |
| BaO |
Lβ1 |
LiF 200 |
FPC |
51 |
| PbO |
Lβ1 |
LiF 200 |
SC |
9 |
N.R. = LoD is not relevant for major elements.
FPC = flow proportional counter.
SC = scintillation counter.
Excitation conditions: 40 kV/1.25 mA.
Collimator: 0.29°.
Precision Tests
Repeatedly analyzing the same pressed pellet sample for eleven consecutive analyses was the method used for precision tests. Utilizing a counting time of 36 seconds per analytical line, eighteen elements/oxides were determined.
The results are summarized below for two different glass samples shown in Tables 2 and 3. Counting time can be increased for higher precision. Doubling the counting time results in an improvement in the precision by a factor of about 1.4 (square root of 2).
Table 2. Repeatability for the analysis of the major and minor oxides in sample A. Source: Thermo Fisher Scientific - Elemental Analyzers and Phase Analyzers
| RUN |
Na2O % |
MgO % |
Al2O3 % |
SiO2 % |
K2O % |
CaO % |
Fe2O3 % |
SO3 PPM |
TiO2 PPM |
P2O5 PPM |
Cl PPM |
Cr2O3 PPM |
MnO PPM |
As2O3 PPM |
SrO PPM |
ZrO2 PPM |
BaO PPM |
PbO PPM |
| Time (s) |
36 |
36 |
36 |
36 |
36 |
36 |
36 |
36 |
36 |
36 |
36 |
36 |
36 |
36 |
36 |
36 |
36 |
36 |
| Run 1 |
13.98 |
0.185 |
1.79 |
72.59 |
0.588 |
10.85 |
0.330 |
582 |
579 |
166.9 |
113.4 |
93.6 |
48.4 |
101.6 |
127.4 |
209.1 |
454.3 |
228.2 |
| Run 2 |
13.93 |
0.193 |
1.81 |
72.60 |
0.582 |
10.82 |
0.333 |
640 |
563 |
146.3 |
129.5 |
91.4 |
44.7 |
101.5 |
124.8 |
204.6 |
392.6 |
218.9 |
| Run 3 |
13.97 |
0.177 |
1.80 |
72.64 |
0.588 |
10.82 |
0.330 |
608 |
563 |
193.3 |
111.2 |
91.1 |
43.8 |
95.9 |
127.1 |
207.0 |
361.8 |
197.8 |
| Run 4 |
14.01 |
0.178 |
1.80 |
72.64 |
0.582 |
10.87 |
0.330 |
645 |
581 |
199.2 |
104.6 |
96.2 |
29.9 |
103.8 |
127.0 |
205.4 |
375.7 |
234.6 |
| Run 5 |
13.95 |
0.182 |
1.80 |
72.60 |
0.588 |
10.83 |
0.329 |
576 |
564 |
158.1 |
111.8 |
94.6 |
41.8 |
103.7 |
122.7 |
204.7 |
385.2 |
228.5 |
| Run 6 |
13.94 |
0.177 |
1.81 |
72.61 |
0.589 |
10.82 |
0.329 |
573 |
569 |
171.3 |
107.9 |
85.2 |
49.5 |
95.0 |
126.3 |
203.8 |
355.4 |
194.8 |
| Run 7 |
13.86 |
0.185 |
1.80 |
72.64 |
0.588 |
10.83 |
0.330 |
658 |
569 |
203.6 |
113.4 |
88.9 |
40.3 |
96.0 |
125.0 |
205.4 |
434.1 |
234.4 |
| Run 8 |
13.92 |
0.186 |
1.81 |
72.59 |
0.585 |
10.84 |
0.331 |
652 |
566 |
190.4 |
135.6 |
94.5 |
44.7 |
96.8 |
125.9 |
203.4 |
315.1 |
207.3 |
| Run 9 |
13.94 |
0.184 |
1.81 |
72.63 |
0.591 |
10.82 |
0.334 |
651 |
579 |
150.7 |
110.1 |
88.6 |
43.1 |
114.9 |
127.1 |
206.6 |
401.2 |
220.8 |
| Run 10 |
13.98 |
0.183 |
1.80 |
72.63 |
0.586 |
10.87 |
0.332 |
617 |
526 |
255.0 |
104.0 |
83.6 |
41.9 |
99.2 |
125.8 |
206.2 |
402.2 |
214.6 |
| Run 11 |
13.95 |
0.188 |
1.78 |
72.62 |
0.588 |
10.83 |
0.330 |
619 |
561 |
218.3 |
97.9 |
80.6 |
38.9 |
97.7 |
126.8 |
203.1 |
429.8 |
197.8 |
| Avg. |
13.95 |
0.183 |
1.80 |
72.62 |
0.587 |
10.84 |
0.331 |
620 |
565 |
186.6 |
112.7 |
89.9 |
42.4 |
100.5 |
126.0 |
205.4 |
391.6 |
216.1 |
| Std. Dev. |
0.04 |
0.005 |
0.01 |
0.02 |
0.003 |
0.02 |
0.0015 |
32 |
15 |
32.5 |
11 |
5 |
5.2 |
5.7 |
1.4 |
1.8 |
39.7 |
15 |
Table 3. Repeatability for the analysis of the major and minor oxides in sample B. Source: Thermo Fisher Scientific - Elemental Analyzers and Phase Analyzers
| RUN |
Na2O % |
MgO % |
Al2O3 % |
SiO2 % |
K2O % |
CaO % |
Fe2O3 % |
SO3 PPM |
TiO2 PPM |
P2O5 PPM |
Cl PPM |
Cr2O3 PPM |
MnO PPM |
As2O3 PPM |
SrO PPM |
ZrO2 PPM |
BaO PPM |
PbO PPM |
| Time (s) |
36 |
36 |
36 |
36 |
36 |
36 |
36 |
36 |
36 |
36 |
36 |
36 |
36 |
36 |
36 |
36 |
36 |
36 |
| Run 1 |
13.35 |
0.180 |
1.67 |
73.07 |
0.556 |
10.77 |
773.3 |
0.177 |
556.0 |
200.6 |
100.7 |
63.4 |
9.3 |
118.2 |
122.4 |
227.2 |
883.9 |
895.6 |
| Run 2 |
13.33 |
0.180 |
1.68 |
73.08 |
0.564 |
10.76 |
757.9 |
0.181 |
568.0 |
159.5 |
111.2 |
65.9 |
3.9 |
112.0 |
122.2 |
226.1 |
960.6 |
914.5 |
| Run 3 |
13.28 |
0.186 |
1.67 |
73.08 |
0.554 |
10.81 |
789.6 |
0.180 |
555.1 |
193.3 |
115.7 |
64.7 |
18.2 |
115.6 |
119.3 |
225.3 |
925.4 |
911.5 |
| Run 4 |
13.28 |
0.185 |
1.66 |
73.11 |
0.559 |
10.83 |
768.2 |
0.186 |
587.2 |
156.6 |
103.5 |
74.7 |
8.7 |
105.6 |
126.5 |
225.1 |
891.3 |
900.0 |
| Run 5 |
13.35 |
0.181 |
1.67 |
73.05 |
0.554 |
10.79 |
763.9 |
0.181 |
594.7 |
187.4 |
97.9 |
63.6 |
12.3 |
106.8 |
126.3 |
226.2 |
948.8 |
904.8 |
| Run 6 |
13.32 |
0.172 |
1.67 |
73.11 |
0.566 |
10.80 |
767.3 |
0.186 |
541.4 |
183.0 |
114.6 |
59.5 |
14.7 |
115.2 |
125.5 |
226.3 |
960.5 |
904.6 |
| Run 7 |
13.33 |
0.185 |
1.67 |
73.06 |
0.554 |
10.79 |
758.9 |
0.180 |
570.3 |
193.3 |
101.8 |
67.9 |
6.1 |
113.5 |
124.9 |
226.9 |
960.6 |
910.1 |
| Run 8 |
13.26 |
0.185 |
1.69 |
73.04 |
0.555 |
10.78 |
771.7 |
0.185 |
565.2 |
191.8 |
95.2 |
66.9 |
9.3 |
101.6 |
124.7 |
227.4 |
918.0 |
919.7 |
| Run 9 |
13.33 |
0.180 |
1.64 |
73.11 |
0.561 |
10.82 |
775.7 |
0.183 |
553.7 |
219.7 |
113.4 |
61.5 |
9.3 |
109.6 |
124.6 |
222.9 |
916.9 |
913.4 |
| Run 10 |
13.30 |
0.193 |
1.68 |
73.08 |
0.556 |
10.80 |
764.1 |
0.188 |
572.6 |
243.2 |
101.3 |
64.4 |
1.0 |
103.4 |
123.0 |
226.0 |
980.8 |
912.7 |
| Run 11 |
13.31 |
0.184 |
1.66 |
73.06 |
0.561 |
10.78 |
785.3 |
0.186 |
566.0 |
191.8 |
109.0 |
70.8 |
13.8 |
106.9 |
122.1 |
227.7 |
950.9 |
875.6 |
| Avg. |
13.31 |
0.183 |
1.67 |
73.08 |
0.558 |
10.80 |
770.5 |
0.183 |
566.4 |
192.8 |
105.8 |
65.8 |
9.7 |
109.9 |
123.8 |
226.1 |
936.2 |
905.7 |
| Std. Dev. |
0.03 |
0.01 |
0.01 |
0.03 |
0.004 |
0.02 |
10 |
0.003 |
15 |
24.2 |
7.2 |
4.3 |
4.9 |
5.4 |
2.2 |
1.4 |
31.2 |
12 |
Conclusion
It was shown for all limits of detection obtained that the ARL OPTIM’X can offer adequate analysis results, significantly for bottle glass application.
For major and minor elements - even for Na2O and MgO - the repeatability of the analysis is high. Should elements present below 100 ppm need to be controlled precisely, a longer counting time may be utilized.
As is shown by these results, the ARL OPTIM’X spectrometer is ideally suited for the generation of precision results regarding the coloring agents in glasses and the determination of the main oxides.

This information has been sourced, reviewed and adapted from materials provided by Thermo Fisher Scientific - Elemental Analyzers and Phase Analyzers.
For more information on this source, please visit Thermo Fisher Scientific - Elemental Analyzers and Phase Analyzers.