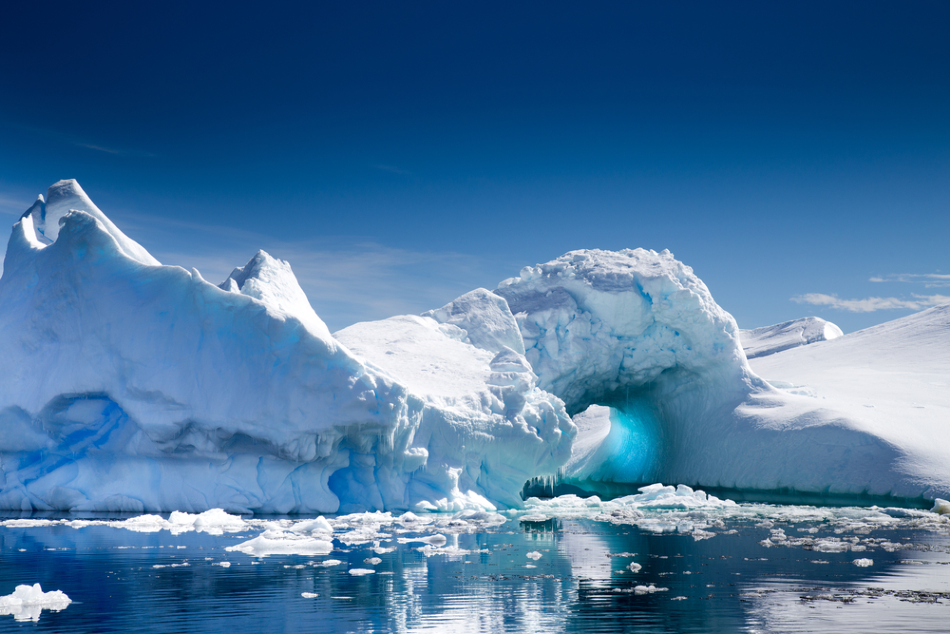
Image Credit: robert mcgillivray/Shutterstock.com
Using a state-of-the-art laser instrument onboard NASA's Ice Cloud and land Elevation Satellite-2 (ICESat-2), scientists at the US space agency have made detailed measurements of ice sheet elevations in Greenland and Antarctica, revealing how much they have shifted over the past 16 years.
According to a new study published in the journal Science, NASA scientists have gathered enough data to determine the impact of changes on global sea level rise.
To take measurements for the study, the laser altimeter onboard ICESat-2 sent 10,000 laser pulses per second down to the ice sheets and determined the amount of time it took for each pulse to return to the satellite, down to the nanosecond. The altimeter's pulse rate allowed for the creation of a highly detailed map of ice sheet surfaces. Researchers then used a blend of ICESat-2 data and other information to determine the thickness of the ice sheets.
Spanning from 2003 to 2009, NASA's first ICESat mission found Arctic sea ice thickness decreased dramatically in the early 21st Century. The European Space Agency's CryoSat-2 satellite was launched in 2010. It found that Arctic sea ice has maintained a reasonably regular thickness over the past 10 years.
ICESat-2 researchers could not calculate the thickness of ice sheets based solely on altimeter data. They had to rely on other information to establish comprehensive measurements. For instance, the scientists painted a more accurate picture by subtracting the height of accumulated snow on ice sheets, which was determined by computer models based on snowfall data.
To reach their conclusions, researchers took elevation measurements from 2003 and overlaid data from 2019. They then analyzed where the datasets intersected to see where ice was lost or gained. This process provided the data on the elevation change, but to calculate how much ice has been gained or lost, the scientists created a computer model to transform volume change information to mass change.
Introduction to ICESat-2
Video Credit: National Snow and Ice Data Center/YouTube.com
What has the ICESat-2 Found?
The study team found that the Antarctic ice sheet, the largest of all the ice sheets, has been growing – but that growth is more than offset by increased losses coming from the West Antarctic ice sheet, which is thinning very rapidly as it responds to warmer ocean temperatures in the Amundsen Sea.
The study paid particular attention to ice shelves – the floating areas of ice located where a glacier passes over the ocean. Because these areas rise and fall based on the tides, they can be challenging to evaluate. Many of them have uneven surfaces, massive cracks, and ridges that can make calculations tricky. However, the accuracy and resolution of ICESat-2 permitted scientists to evaluate overall shifts in ice shelves.
This study is the first time laser altimetry has been used to evaluate the change in floating ice shelves surrounding Antarctica concurrent with a decrease in the continent's overall ice sheet. The scientists discovered the ice shelves shedding the most mass are in West Antarctica, which is home to the continent's quickest-moving glaciers. More specifically, the Crosson and Thwaites ice shelves have experienced the most thinning: approximately 5 meters and 3 meters each year, respectively.
Click here for more information on laser technology.
NASA researchers said they saw significant thinning on the ice shelves that causes a draw-down on the inland ice located upstream. The thinning is being produced by changes in ocean heat flux underneath the ice shelves. As a result, the grounded ice in Antarctica is flowing faster into the ocean, causing sea level rise.
In Greenland, there has been greater ice accumulation at the center of its ice sheet. However, scientists have found that it is thinning overall.
These study results confirm the conclusions made by many other research efforts. For example, in Greenland, there is considerable thinning of the Kangerdulgssuaq and Jakobshavn coastal glaciers. They are losing 4 to 6 meters of elevation each year, which is equivalent to 16 gigatons and 22 gigatons, respectively.
Each year, approximately 200 gigatons of ice are flowing into the oceans. This is enough to raise sea level by around two-thirds of a millimeter per year. When that is combined with the almost 118 gigatons of Antarctic ice flowing into the ocean each year, sea level has risen a total of 14 millimeters over the 16 years covered by the study. These changes project a 4 feet sea level rise by 2100, which will leave many infrastructures built around the coasts vulnerable.
The potential impact of sea level is a critical motivation for the continued study of ice sheet mechanics. If scientists can understand the mechanisms driving ice sheet loss, responses can be much more targeted and efficient.
References and Further Reading
Ramsayer, K. (2020) NASA's ICESat-2 Measures Arctic Ocean's Sea Ice Thickness, Snow Cover. [Online] NASA. Available at: https://www.nasa.gov/feature/goddard/2020/icesat-2-measures-arctic-sea-ice-thickness-snow-cover (Accessed on 21 May 2020).
Optics.org (2020) ICESat-2 laser scan reveals extent of polar ice loss. [Online] Available at: https://optics.org/news/11/5/7 (Accessed on 21 May 2020).
Ramsayer, K. (2020) NASA Space Laser Missions Map 16 Years of Ice Sheet Loss. [ Online] NASA. Available at: https://www.nasa.gov/feature/goddard/2020/nasa-space-laser-missions-map-16-years-of-ice-sheet-loss (Accessed on 21 May 2020).
Smith, B. et al. (2020) Pervasive ice sheet mass loss reflects competing ocean and atmosphere processes. Science. Available at: https://doi.org/10.1126/science.aaz5845
Disclaimer: The views expressed here are those of the author expressed in their private capacity and do not necessarily represent the views of AZoM.com Limited T/A AZoNetwork the owner and operator of this website. This disclaimer forms part of the Terms and conditions of use of this website.