Microplastics occur in water, soil, sediments, food, consumer products, and industrial settings. As regulatory requirements and research activities grow, labs need analytical techniques that deliver precise polymer identification, particle counts, and size distributions.
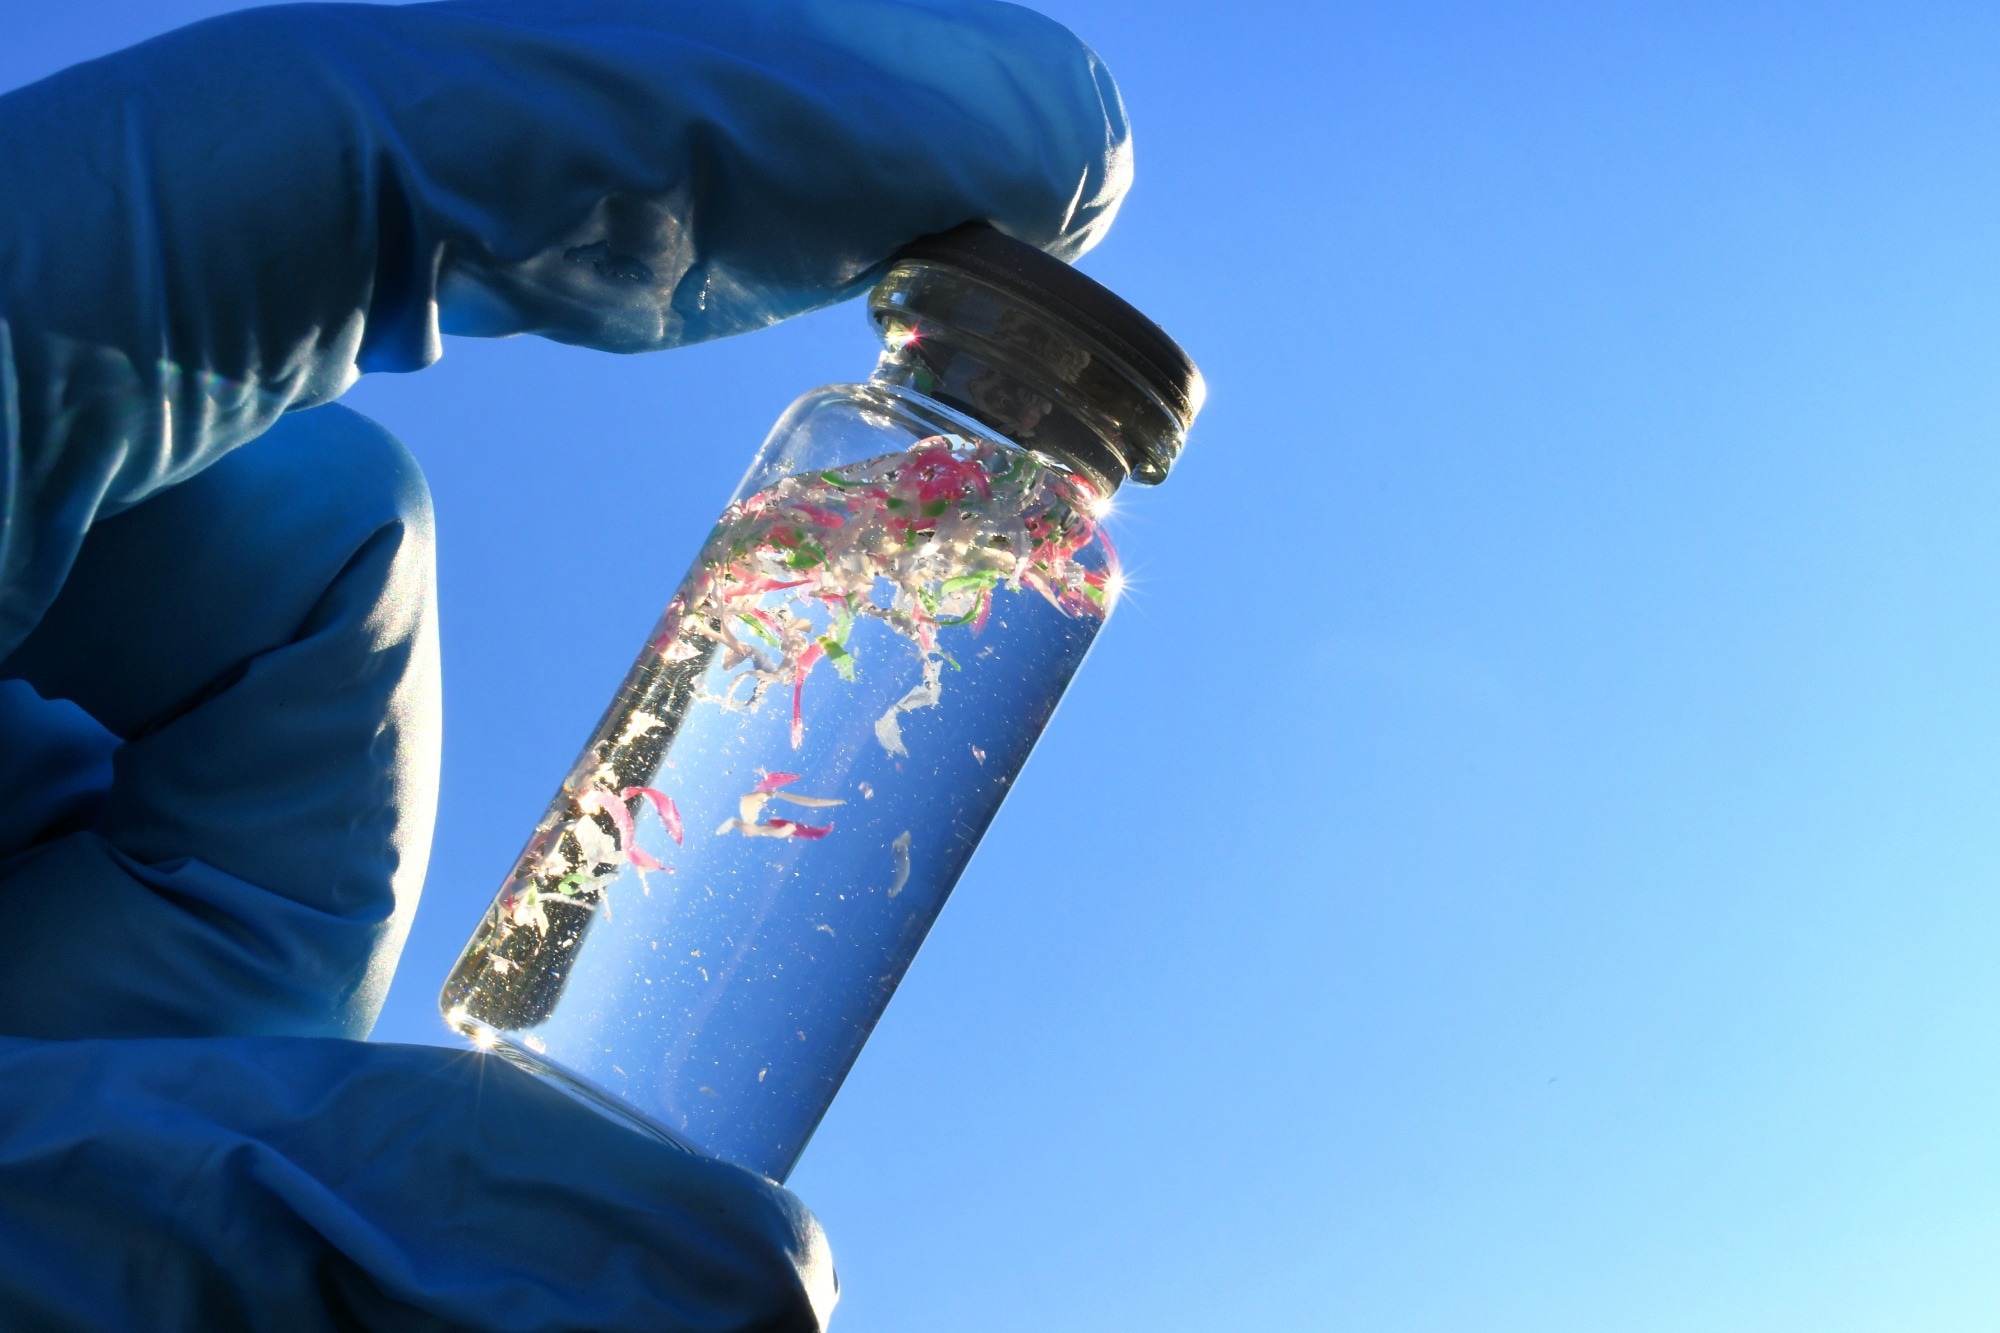
Image Credit: MargJohnsonVA/Shutterstock.com
Bruker equips microplastics scientists and testing labs globally with a comprehensive range of spectroscopic solutions. Whether the focus is high-throughput screening, sub-micron particle analysis, or standards-compliant reporting, the company helps clients find the strategy that best matches their analytical needs.
Bruker’s solutions enable dependable evaluation of:
- Polymer identification
- Particle counts
- Particle size distributions
- Shape, fiber, and fragment classification
- Weathered and degraded polymers
- Mixed-material samples
- Regulatory reporting criteria
Microplastics can be analyzed and detected in:
- Drinking, waste, and surface water
- Marine and ocean samples
- Sediments and soil
- Food and beverages
- Consumer products
- Industrial process streams
- Airborne particle monitoring
Frequently Asked Questions About Microplastics Analysis
This FAQ provides straightforward answers to the most important questions: which method is appropriate for a specific application, what regulations specify, and where the trade-offs lie.
Microplastics Basics
What is microplastics analysis?
Microplastics analysis refers to the scientific process of detecting, identifying, counting, and characterizing plastic particles under 5 mm in biological samples, water, food, or the environment. A thorough evaluation determines not just whether microplastics are present, but how many, what size, what shape, and especially what polymer type they are.
Where have microplastics been detected?
Microplastics have been found in deep-sea sediments, ocean water, Arctic ice, agricultural soil, indoor air, bottled water, tap water, human lung tissue, blood, and placental tissue. They have been documented across marine and freshwater environments, air, soils, food and drinking water, and biological samples.
Choosing the Right Microplastics Analysis Method
What are the two primary approaches to microplastics analysis?
The two primary approaches are mass-driven analysis and particle-driven analysis. Although mass-driven techniques such as pyrolysis-GC/MS measure polymer concentration by mass, they destroy the sample and therefore cannot provide information on particle counts, sizes, or morphology. Particle-driven techniques, including IR or Raman microscopy, identify and characterize individual particles while retaining particle-level information.
What are the three primary spectroscopic methods for microplastics analysis?
The three methods are FT-IR, IR Laser (imaging), and Raman microscopy. Each technique couples microscopy with spectroscopy to measure a particle’s molecular vibration spectrum. They provide distinct trade-offs in sample compatibility, spectral range, throughput, and spatial resolution.
How do FT-IR, IR Laser Imaging, and Raman microscopy differ?
FT-IR microscopy is an established method for routine microplastics analysis. It combines infrared spectroscopy with microscopy to identify polymers while also providing particle size and morphology information. It is well suited to automated filter analysis and is widely used when robust, routine particle characterization is required.
IR Laser Imaging Microscopy (ILIM) also uses infrared spectroscopy, but relies on tunable quantum cascade lasers (QCLs) for rapid hyperspectral imaging. Its main advantage is speed: large filter areas can be chemically mapped much faster than with conventional FT-IR approaches, making ILIM especially attractive for high-throughput and full-filter analysis.
Raman microscopy uses visible or near-infrared excitation rather than mid-infrared radiation. Because these wavelengths are shorter, Raman provides higher spatial resolution and is particularly useful for very small particles, including particles around 1 µm and, under suitable conditions, below this range. It can also provide additional information on pigments, fillers, and inorganic components.
Particle Identification and Detection Limits
Why is chemical identification needed in microplastics analysis?
Visual inspection alone cannot differentiate a synthetic polymer particle from a natural one, such as cellulose or a mineral fragment. However, this information is valuable for determining particle origin and source. Chemical identification, such as through spectroscopy, is crucial for verifying polymer identity and differentiating plastic particles from visually similar natural or mineral particles.
What are the detection limits and where do they come from?
The spatial resolution of optical microscopy is fundamentally limited by diffraction and therefore by the wavelength of the light used. Because mid-infrared radiation has wavelengths in the micrometer range, both FT-IR microscopy and QCL-based IR imaging eventually reach a physical resolution limit as particle size decreases.
For routine microplastics analysis, interpretable IR spectra can typically still be obtained from particles down to the low-micrometer range. Around 5 µm, however, reliable particle-specific identification becomes increasingly difficult because the particle dimensions approach the spatial resolution limit of the measurement.
For smaller particles, Raman microscopy becomes advantageous. Raman uses much shorter visible or near-infrared wavelengths and therefore achieves substantially higher spatial resolution, allowing characterization of particles around 1 µm and, under suitable conditions, below this range.
What are nanoplastics and how are they evaluated?
Nanoplastics are typically defined as plastic particles smaller than 1 µm. At this scale, characterization becomes increasingly difficult because particles approach or fall below the resolution limits of conventional optical techniques.
Raman microscopy is therefore commonly used for very small particles, while characterization further into the nanoscale may require specialized techniques such as enhanced Raman or other nanoscale analytical methods.
Throughput, Full-Filter Analysis, and Subsampling
What is subsampling in microplastics analysis?
Subsampling involves evaluating only a representative portion of a filter or sample rather than the entire filter. It is frequently applied to shorten measurement times in particle-based spectroscopic workflows, particularly when particle loads are high. However, because particles can be unevenly distributed across a filter, subsampling may introduce uncertainty through spatial bias, handling losses, overcrowding, or measuring too few particles.
Why can subsampling be risky in microplastics analysis?
Although subsampling can shorten measurement times, the measured fraction may not fully represent the entire filter. Edge effects, clustering, uneven particle distribution, and handling losses can impact reported particle counts, polymer composition, and size distributions.
Bruker’s full-filter IR imaging workflows avoid this additional sampling stage. ILIM allows evaluation of entire 25 mm filters in under 30 minutes, including spectral acquisition and automated data analysis, enabling high-throughput evaluation without subsampling.
Sample Preparation and Filter Selection
Why is sample preparation so valuable in microplastics analysis?
Sample preparation is the largest source of variability among labs. Failing to adequately remove organic and inorganic matrix material results in unreliable outcomes and false identifications. Contaminants can be tolerated to a certain degree and identified as such by the software. However, when these contaminants obscure or mask microplastic particles, even the software cannot compensate for what arrives on the filter.
What filter should be used for microplastics analysis?
Measurement methods dictate filter choice. Anodisc (aluminum oxide) filters are commonly employed for IR transmission. Silicon membrane filters provide broad mid-IR spectral access while remaining compatible with Raman.
Gold-coated polycarbonate filters are ideal for Raman and IR transreflectance measurements. Although PTFE, metal mesh, and nitrocellulose filters have considerable restrictions for imaging workflows, they may suit single-point measurements with ATR.
Can the same filter be used for both IR and Raman analysis?
Silicon membrane filters can be used for both IR transmission and Raman measurements. Gold-coated polycarbonate filters are suitable for Raman and IR transreflectance measurements. Anodisc filters are unsuitable for Raman analysis because they have a rough surface at high magnification and fluoresce under laser excitation.
Data Quality and Classification
How is spectroscopic data evaluated in microplastics analysis?
For imaging approaches, automated software such as Bruker's MPID transforms millions of raw spectra into a particle list containing the identity, size, shape, and count of each detected particle. Manual evaluation is impractical at scale. Automated software can enhance classification robustness compared with traditional library matching, especially when handling weathered or contaminated samples.
Why does classical library matching fail for environmental microplastics?
Contamination, chemical weathering, and UV exposure degrade environmental particles, shifting spectra away from clean reference standards in ways that straightforward template matching cannot reliably handle. Where library matching fails, a neural network trained on real-world degraded spectra preserves precision.
What is a confidence score (HIT score) in microplastics classification?
A confidence score indicates how closely the spectral feature vector of an identified particle matches a validated reference spectrum for that polymer class. It lets analysts set a threshold and accept only high-confidence identifications, balancing sensitivity (detecting more particles) and specificity (avoiding incorrect classification).
Regulatory Requirements and Reporting
Which spectroscopic techniques are recognized for regulatory microplastics analysis?
For microplastics analysis in drinking water, Commission Delegated Decision (EU) 2024/1441 recognizes vibrational spectroscopy techniques, including μ-FTIR, μ-Raman, and equivalent methods such as QCL-IR. This lets laboratories choose the method that best suits their requirements for particle size, throughput, and analytical detail.
Which regulations govern microplastics analysis in water?
The principal regulatory and standardization documents are EU Directive 2020/2184, which establishes the EU drinking-water framework; Commission Delegated Decision (EU) 2024/1441, which defines vibrational spectroscopy methods, including μ-FTIR, μ-Raman, and equivalent approaches such as QCL-IR; ISO 24187:2023, which establishes general principles for microplastics analysis across environmental matrices; and ISO 16094-2:2025, which addresses vibrational spectroscopy techniques for drinking water and waters with low levels of suspended solids. ASTM WK87463 is currently being developed as a test method to identify and quantify microplastics in water using IR spectroscopy.
Do regulations require FT-IR or Raman methods?
EU Commission Delegated Decision (EU) 2024/1441 does not mandate a single specific vibrational spectroscopy method. It allows techniques including μ-FTIR, μ-Raman, and equivalent methods such as QCL-IR (IR Laser Imaging) for the compositional evaluation of microplastic fibers and particles. The most appropriate method therefore depends on variables including particle size, sample type, throughput, and analytical criteria.
What is the difference between ISO 24187 and ISO 16094?
ISO 24187:2023 defines general principles and minimum requirements for analyzing microplastics across environmental matrices. ISO 16094-2:2025 provides more detailed requirements for particle-based microplastics analysis via vibrational spectroscopy in drinking water and waters with low suspended-solids content. For this reason, labs analyzing these water samples should take standards into consideration.

This information has been sourced, reviewed and adapted from materials provided by Bruker Optics.
For more information on this source, please visit Bruker Optics.