Microplastics research first gained attention through studies of marine pollution, but the analytical scope has broadened considerably. Today, microplastics are investigated in drinking water, food, air, soils, and biological samples, driven by growing interest in environmental exposure, human health, and regulatory monitoring. This expansion has increased the need for analytical methods that can reliably identify, count, and characterize particles across very different sample types.
Which Analytical Approach is Best Suited for a Specific Laboratory?
This article discusses how to select spectroscopic techniques, filter substrates, and data analysis workflows for particle-based microplastics analysis, emphasizing practical trade-offs, regulatory relevance, and known analytical constraints.
#1 What Microplastics Analysis Measures
Microplastics are solid polymer particles under 5 mm, ranging from millimeter-scale fragments visible to the naked eye to particles of 5 to 10 micrometers that require microscopy to detect.
Within that range, size, shape, and polymer type each have scientific significance. The question an analysis must answer is not merely whether microplastics are present, but how many, how large, what shape, and what they are made of.
Microplastics have been detected in ocean surface water, deep-sea sediments, Arctic ice, agricultural soil, indoor air, and the human food chain. Published research frequently documents microplastic contamination in both bottled and tap water, with observed prevalence varying widely by analytical approach, particle-size threshold, and identification standards.
Multiple widely cited surveys reported microplastics in up to 87% of analyzed tap water samples worldwide and in up to 93% of tested bottled water brands. They have also been detected in human lung tissue, blood, and placenta. Of course, reported detection rates should be interpreted in the context of the analytical approaches and detection limits applied in each study.
In short, the scale of environmental distribution is no longer in question. It is massive.
Primary microplastics are produced intentionally (such as abrasive blast media, plastic pellets, cosmetic microbeads) and represent a smaller fraction of the overall environmental burden.
Secondary microplastics are created through the physical, chemical, and biological degradation of larger plastic objects and make up the vast majority of what environmental samples contain.
Here, tire and road wear particles (TRWP) are widely acknowledged as a primary source of microplastics released into the environment. Tire and road wear particles are major sources of microplastic emissions, and in Germany tire abrasion has been estimated at approximately 60,000–100,000 t/a, with peer-reviewed modeling studies reporting comparable values of 75,200–98,400 t/a for coarse non-airborne tire wear particles.
Additional relevant secondary microplastic sources include emissions from waste disposal and plastic packaging, agricultural plastics, paints, textile washing, pellet losses, and abrasion of asphalt-bound polymers.
Nanoplastics, generally particles less than 1 µm, are a novel focus in toxicology and health research. Due to their small size, they can cross biological barriers, including cell membranes and, potentially, the blood-brain barrier. As challenging samples, nanoplastics often require a more time-intensive analytical method than conventional microplastics work.
The key analytical challenge across all these size ranges remains the same: environmental samples are complex mixtures. Synthetic polymer particles arrive alongside natural particles, including mineral fragments, cellulose fibers, and biological material. Visual inspection alone cannot differentiate a polyethylene fragment from a cellulose fiber. Chemical identification of each individual particle is mandatory, as it forms the foundation of any meaningful result.
What are Microplastics?
Source: Bruker Optics
Contaminant
Classification |
Physical
Size Boundaries |
Primary
Environmental
Genesis |
Predominant
Analytical
Challenges |
Key
Representative
Examples |
Primary
Microplastics |
5 µm to 5 mm |
Intentionally manufactured for specific industrial functions or consumer product formulations. |
Locally concentrated near industrial sites; requires differentiation from secondary background fragments. |
Cosmetic microbeads, raw manufacturing resin pellets (nurdles), abrasive blast media. |
Secondary
Microplastics |
5 µm to 5 mm |
Progressive physical, chemical, and biological degradation of larger
macro-plastic waste. |
Extreme structural heterogeneity; often
heavily weathered, bio-fouled, or embedded in matrix residues. |
Tire and Road Wear Particles (TRWP), synthetic textile wash fibers, fragmented agricultural films. |
| Nanoplastics |
Sub-micron
(< 1 µm / < 1000 nm) |
Advanced fragmentation
and continuous degradation of microplastic particles. |
Sits below the optical diffraction limit of
standard mid-infrared microspectroscopy. |
Sub-micron polymer colloids, weathered synthetic dusts capable of cellular translocation. |
Natural/
Inorganic
Background Matrix |
Highly variable
(< 0.1 µm to
> 5 mm) |
Naturally occurring biotic and abiotic environmental components. |
Inflicts heavy spectral interference; can completely mimic plastic particles under visual inspection. |
Cellulose (cotton/wood fibers), chitin, mineral shards (silica/quartz), biofilms. |
#2 Choosing Between Mass-Based and Particle-Based Methods
Microplastics analysis encompasses a wide variety of analytical questions, including particle number and size distribution, polymer mass concentration, and chemical composition. No individual technique can address all these questions concurrently. The two dominant methods in microplastics studies are based on different principles and produce fundamentally distinct outputs.
Mass vs. Particle Metrics
Source: Bruker Optics
Metric
Category |
Primary
Technique |
Data
Output |
Core
Advantages |
Critical
Limitations |
| Mass-Driven |
Pyrolysis GC/MS (Pyro-GC/MS); TED-GC/MS |
Total polymer mass concentration profile (mg/kg or µg/L). |
Quantifies total polymer burden; high matrix tolerance. |
Destructive; entirely blind to particle count, size distribution, and morphology. Pre-separation via sifting introduces uncertainty in particle loss. |
| Particle-Driven |
FT-IR Microscopy, Quantum Cascade Laser (QCL) IR, Raman Microscopy |
Spatially resolved particle counts, discrete sizing, morphology metrics, and chemical typing. |
Matches toxicological exposure models; non-destructive nature permits archival storage and retrospective audit. |
Requires rigorous sample preparation to mitigate spectral interference from co-extracted matrices. |
Mass-Driven Analysis
Pyrolysis GC/MS (Pyro-GC/MS) is an intrinsically destructive analytical method. The sample undergoes thermal decomposition, the resulting fragments are separated by gas chromatography, and polymers are identified and quantified by mass spectrometry. The output is a quantitative polymer profile that reports which polymers are present and their concentrations by mass.
As a result, Pyro-GC/MS is a robust tool for questions of total polymer burden. Its main limitation is that it is indifferent to particle size. To put it simply, a single large plastic fragment will give the same result as an entire population of particles in diverse sizes that add up to equal mass.
After pyrolysis, no particle remains in the sample. Size distribution, morphology, fiber-versus-fragment classification, and particle counts do not survive the analysis, and the sample cannot be archived or reevaluated.
Consequently, for regulatory and biological questions that increasingly drive monitoring efforts, mass-based approaches cannot provide particle-level metrics, but they are important for delivering complementary polymer mass data.
As a "workaround" to reintroduce some size resolution into mass-based analyses, size fractionation can be applied before chemical measurement. Size fractionation is usually achieved using sieving, filtration cascades, or sequential separation steps, often combined with density separation, to divide samples into discrete size classes before evaluation via Pyro-GC/MS or related methods (e.g., TED-GC/MS).
Frequently reported fractions include coarse (> 500 or > 300 µm), intermediate (100–500 µm), and fine (< 100 µm) classes, though precise cutoffs vary according to matrix, analytical sensitivity, and study objectives.
While this strategy does not preserve individual particle identity, it allows polymer mass to be attributed to size ranges more directly relevant to exposure modeling, transport behavior, and risk-oriented evaluations.
However, size fractionation itself introduces additional sources of uncertainty that must be considered. Particle losses can occur during sieving or filtration due to adhesion to equipment surfaces, clogging, or incomplete transfer between stages, with fine and fibrous particles being especially vulnerable.
Mechanical handling may also cause fragmentation or deformation, changing the apparent size distribution. For this reason, size-fractionated mass-based methods are seldom used in microplastics studies, largely because the field focuses on particle-level identification.
This guide focuses on particle-driven microplastics analysis and explores the analytical metrics currently used in regulatory and standardization frameworks, as well as the type of data produced by particle-driven evaluation methods. In practice, however, particle-driven and mass-driven techniques are often used in tandem, depending on the analytical objectives and regulatory context.
Particle-Driven Analysis
Infrared (IR) and Raman microscopy are inherently particle-resolved approaches. The sample remains intact, with particles immobilized on a filter and analyzed individually or as a whole population. The analytical output is particle-level data, including polymer identity, size, morphology, and particle count for each detected item on the filter. This is important for two reasons:
- It reflects how microplastics interact with biological systems. Particle size, shape, and form directly affect transport, deposition, and biological response: a 10 µm fiber and a 500 µm fragment of the same polymer represent inherently distinct exposure scenarios. Similarly, a high abundance of small particles has different biological and toxicological implications than a low abundance of larger particles. Collapsing these distinctions into a single mass-based metric obscures the characteristics that fuel exposure evaluation and risk analysis.
- The non-destructive nature of spectroscopic evaluation enables sample archiving. Filters evaluated today remain available for reevaluation under future regulatory specifications, revised size classifications, or updated polymer libraries, without requiring recollection of the original sample. As regulatory and standardization frameworks continue to change, this retrospective evaluation capability represents a major operational and scientific advantage.
Accordingly, regulatory frameworks have increasingly adopted particle-based metrics that require data on particle count, size distribution, and morphology. EU Commission Delegated Decision (EU) 2024/1441, implementing the Drinking Water Directive (EU) 2020/2184, specifies a harmonized methodology for drinking-water microplastics analysis based on particle-level characterization using vibrational micro-spectroscopy.
ISO 24187:2023 takes a similar approach by establishing general principles for particle-based microplastics analysis across environmental matrices, including water, sediment, and biota. In these frameworks, microplastics are reported mainly by particle number and size class rather than total polymer mass.
Particle-driven analysis thus depends on a method's ability to chemically identify individual particles without destroying them, a capability intrinsic to vibrational microspectroscopy. Here, each polymer carries a distinctive spectral fingerprint, allowing for discrimination of plastic and non-plastic, synthetic and natural, and even between particle polymer types.
FT-IR, IR laser, and Raman microscopy all identify particles using vibrational spectra; however, they differ in spatial resolution, throughput, spectral coverage, and minimum reliable particle size. The choice between these methods is therefore not arbitrary, and the technique-specific sections provide a detailed discussion.
All three methods follow the same workflow: sample collection, preparation, filtration, spectroscopic measurement, and data analysis. The main analytical distinction is whether spectra are collected from optically selected particles individually or from a spatially resolved chemical image of a defined filter region.
#3 Building a Reliable Analytical Workflow
Spectroscopic microplastics analysis follows the same five-step sequence regardless of the method used, and each step, to some degree, affects data quality.
- Sample Collection
- Sample Preparation
- Filtration and Filter Selection
- Spectroscopic Measurement
- Data Analysis and Reporting
Step 1 | Sample Collection: Building a Representative Starting Point
The quality of a microplastics result is constrained by the sample that enters the laboratory. Sampling should therefore capture the variability of the material being investigated while controlling contamination introduced during collection and handling. The appropriate strategy depends on the matrix and study objective, and blank samples are commonly used to quantify background contamination.
However, this guide does not cover specific sampling protocols.
ISO 24187:2023 describes general principles for microplastics analysis, while ISO 16094-2:2025 addresses drinking water and waters with low suspended-solids content.

Collection of a representative environmental or product sample while minimizing contamination. Image Credit: Bruker Optics
Step 2 | Sample Preparation: Reducing Matrix Interference
Sample preparation is a major source of variability in microplastics analysis because different sample matrices require different levels of cleanup. Drinking water may need little treatment, whereas sediments, food, and biological samples can contain substantial organic or mineral material that interferes with spectroscopic identification.
Common preparation methods include density separation, chemical or enzymatic digestion, and sieving. The objective is to reduce matrix interference while preserving the original particle population. Insufficient cleanup can obscure particles, while overly aggressive treatment can cause particle loss or damage. Please note, this guide is not a detailed description of sample preparation protocols.
ISO 24187:2023 provides method-specific guidance, including preparation criteria for environmental samples.
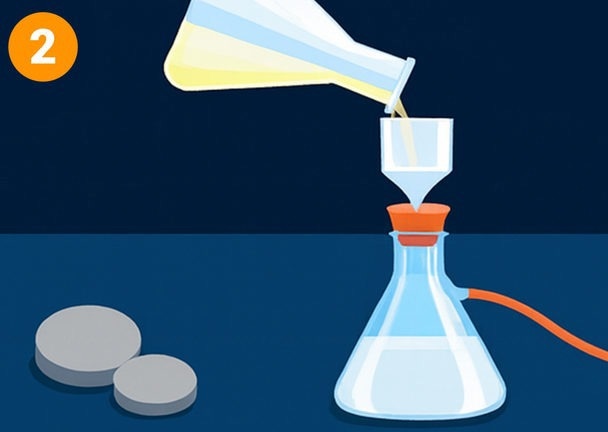
Remove interfering matrix components and concentrate microparticles for analysis. Image Credit: Bruker Optics
Step 3 | Matching the Filter to the Measurement
Filtration concentrates the prepared particles onto a substrate for spectroscopic analysis. Filter selection affects both particle recovery and the quality of the subsequent measurement. Pore size determines which particles are retained, while the optical properties of the filter determine whether it is suitable for IR transmission, transflection, Raman, or other measurement modes.
The filter should therefore be selected with the downstream analytical technique in mind, and is discussed extensively in its dedicated section #4.
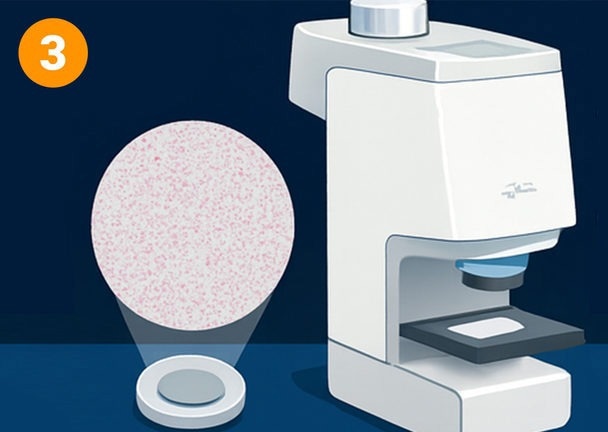
Filtered particle suspension deposited on an analytical substrate suitable for spectroscopic measurement. Image Credit: Bruker Optics
Step 4 | Spectroscopic Measurement: Acquiring Reliable Chemical Information
During spectroscopic measurement, molecular vibration spectra are collected from particles on the filter to determine their chemical identity. FT-IR, IR Laser Imaging, and Raman microscopy use different light sources and measurement principles, resulting in differences in spatial resolution, acquisition speed, and spectral performance.
Measurement parameters must provide sufficient spectral quality for reliable polymer identification while avoiding effects such as poor signal-to-noise or, in Raman analysis, excessive laser exposure. A distinction should be made between micro-spectroscopy and spectroscopic imaging, which is discussed in Section #5.
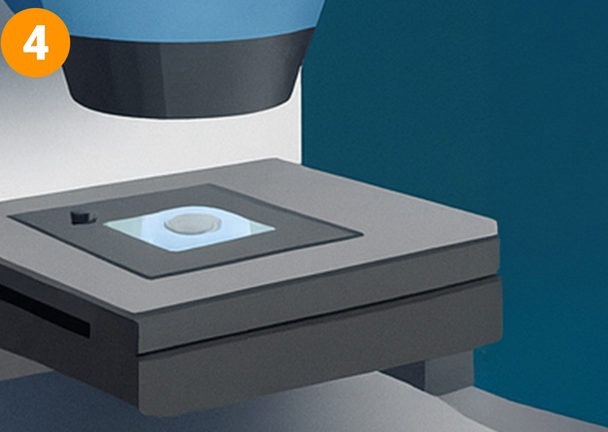
Chemical characterization of particles on the filter using FT-IR, Raman, or IR laser microscopy. Image Credit: Bruker Optics
Step 5 | Data Evaluation: Turning Spectra Into Particle Information
The final step converts spectral measurements into information such as particle count, polymer identity, size, and morphology. The evaluation strategy depends on how the data were acquired: individual point spectra require a different workflow from hyperspectral images containing large numbers of spectra.
Reliable classification also depends on the quality of the reference data and analysis method, particularly for weathered, contaminated, or chemically altered particles that may differ substantially from ideal laboratory reference spectra.
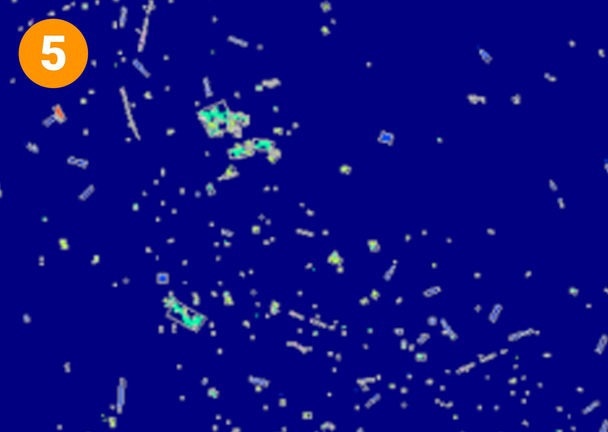
Automated identification, sizing, counting, and polymer classification of particles using advanced analysis software and AI-assisted spectral interpretation. Image Credit: Bruker Optics
Source: Bruker Optics
Workflow
Phase |
Core Analytical Objective |
Dominant Reagents
& Hardware |
Critical Data
Quality Hazards |
Quality Assurance & Mitigation Controls |
| 1. Sample Collection |
Gathering a statistically representative sample while eliminating background contaminants. |
Neuston nets, stainless-steel grabs, glass containers, bypass filter rigs. |
Airborne synthetic fiber fallout; cross-contamination from plastic sampling gear. |
Mandatory execution of field and procedural blank filters; absolute exclusion of consumer plastic clothing/gear. |
| 2. Sample Preparation |
Complete isolation of target polymers via mineral separation
and organic destruction. |
High-density salts (ZnCl2, NaI); oxidative solutions (H2O2, Fenton's reagent); enzymes. |
Chemical degradation or melting of vulnerable polymers; particle loss via physical handling errors. |
Precise temperature caps (< 40–50 °C); use of non-destructive enzymatic cascades or specialized catalyst controls. |
| 3. Filtration |
Concentrating isolated particles onto an optically compatible substrate disc. |
Glass vacuum filter assemblies; Anodisc, Silicon, or Metal-coated polycarbonate discs. |
Particle clustering/clogging; substrate distortion; passage of fine particles through oversized pores. |
Careful calculation of split-sample loading densities; optimization of substrate pore size configurations (0.2 µm). |
| 4. Spectroscopic Measurement |
Acquiring descriptive molecular vibration signatures from target particles. |
FT-IR, IR Laser, and Raman microscopes. |
Signal-to-noise degradation; thermal degradation from over-powered lasers; background interference. |
Optimization of scan integration parameters; execution of daily background single-beam reference scans. |
| 5. Data Evaluation |
Converting raw
spectral arrays into verified particle counts and morphology lists. |
Automated baseline algorithms; library
search engines; trained neural networks. |
False positives from weathered profiles; false negatives; sizing errors due to overlapping particles. |
Utilization of machine learning models trained on heavily degraded real-world polymers; strict verification thresholds. |
#4 Selecting the Right Filter for the Measurement Technique
In microplastics analysis, the filter serves both as a collection medium and as the measurement substrate. This means filter choice affects not only which particles are retained, but also the quality and compatibility of the spectroscopic measurement.
Pore size determines the particle range captured, while the substrate’s optical properties influence whether it can be used for IR transmission, Raman, or other measurement modes.
Because the filter remains in the optical path during analysis, its material directly influences the measurement. IR transmission requires a substrate that transmits the relevant infrared wavelengths, while Raman analysis benefits from a flat, low-fluorescence surface that contributes minimal background signal.
Filter properties also affect particle recovery. Pore size defines the smallest particles retained, while surface characteristics influence how securely particles remain attached during handling and measurement. A poorly matched substrate can therefore lead to weaker spectra, higher background, particle loss, or incompatibility with the intended measurement mode.
For this reason, filter selection should be made together with the spectroscopic method and target particle-size range, rather than treated as a separate filtration decision.
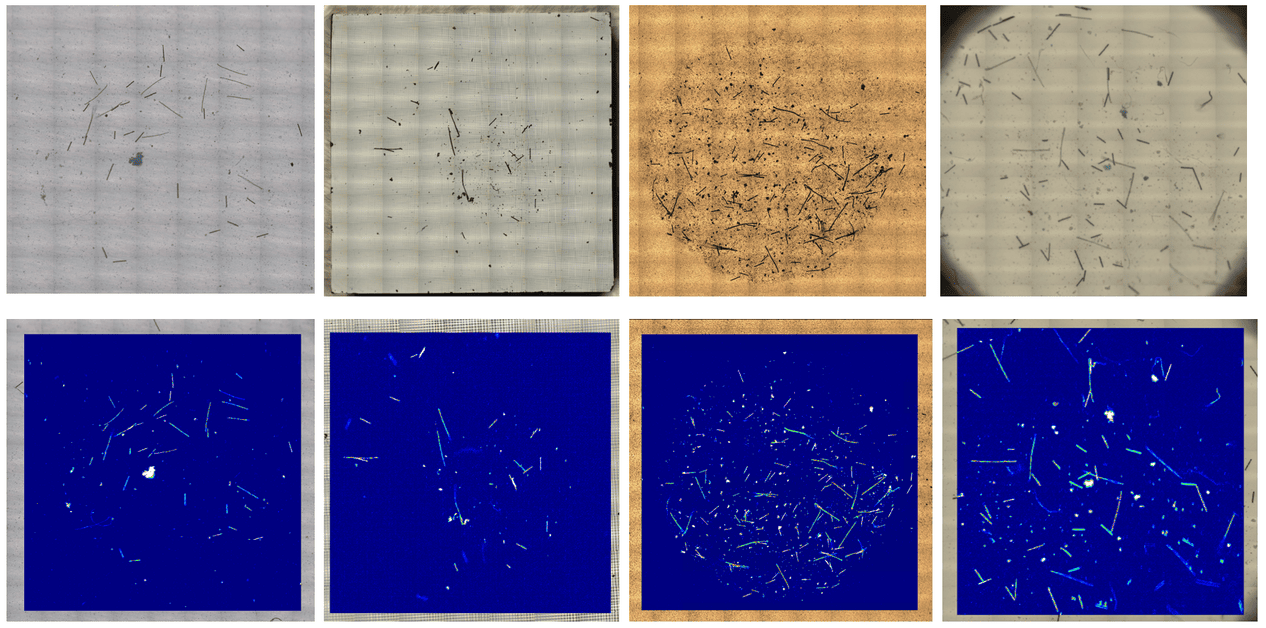
Top: visual images of Anodisc, Silicon, Gold and PTFE Filter. Bottom: Chemical images of particles as overlay. Image Credit: Bruker Optics
Filter Compatibility at a Glance
Source: Bruker Optics
Anodisc (Aluminum Oxide Membrane)
Anodisc filters are commonly used for IR transmission-based microplastics analysis. The aluminum oxide membrane provides good infrared transmission above approximately 1250 cm-¹, covering the spectral region used for identifying most common polymers. Below this range, transmission decreases substantially, but this generally does not prevent routine polymer classification.
With pore sizes typically around 0.2 µm, Anodisc membranes can retain particles well below the practical size range of conventional IR microspectroscopy. They are also relatively inexpensive, although the ceramic membrane is mechanically fragile.
Their main limitation is Raman analysis. Aluminum oxide can produce strong fluorescence under laser excitation, while the comparatively rough surface becomes problematic at high magnification. Anodisc is therefore primarily suited to IR transmission rather than Raman or combined IR–Raman workflows.
- Compatible with: IR transmission
- Not suitable for: Raman
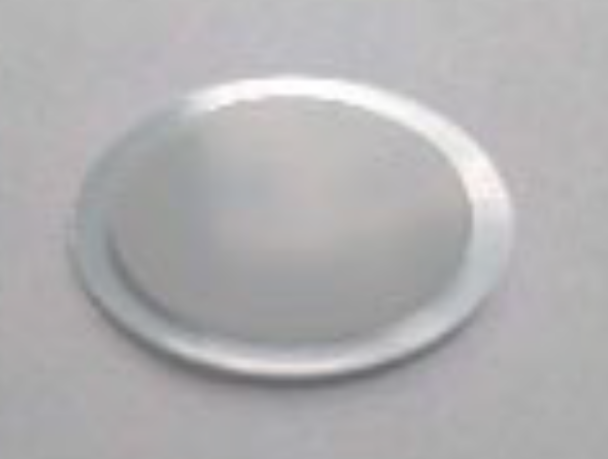
Anodisc aluminum oxide membrane filter used as an infrared transmission substrate for microplastics analysis. Image Credit: Bruker Optics
Silicon Membrane Filters
Silicon membrane filters provide broad mid-infrared transmission, typically extending from about 4000 to 600 cm-¹. This wider spectral window can be useful when the analysis needs to include inorganic components as well as polymers, since some minerals and glass-like materials have diagnostic bands at lower wavenumbers.
Unlike Anodisc, silicon is also compatible with Raman microscopy and does not introduce the same fluorescence problem. This makes silicon attractive for workflows that combine IR and Raman measurements on the same substrate.
The trade-off is lower IR throughput: silicon absorbs part of the incident infrared radiation, so longer acquisition times may be needed to achieve comparable signal quality. For routine polymer identification, that additional measurement time may offer little benefit unless the broader spectral range or dual-method compatibility is specifically required.
- Compatible with: IR transmission, Raman
- Most appropriate for analyses requiring complete MIR coverage or identification of inorganic components
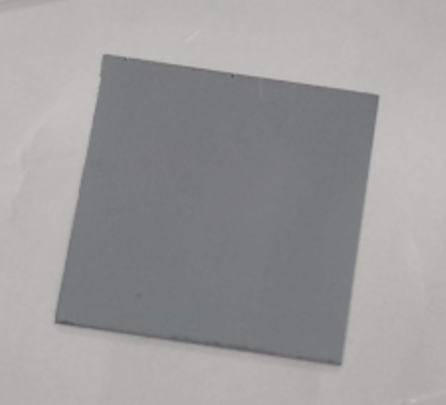
Silicon membrane filter for infrared transmission-based microplastics analysis. Image Credit: Bruker Optics
Metal-Coated Polycarbonate Filters
Metal-coated polycarbonate filters, often with a gold surface, are designed for reflective measurement geometries rather than IR transmission. They are well suited to Raman microscopy because the metal surface contributes little fluorescence and provides a relatively clean optical background. Pore sizes down to about 0.1 µm also allow efficient retention of very small particles.
In IR transflection measurements, the reflective coating sends the infrared beam back through the particle, effectively increasing the optical path length and strengthening the signal from thin or small particles. The same effect can become a limitation for thicker particles, where absorption bands may saturate.
Because transflection spectra contain both transmission and reflection contributions, their spectral shape can be more complex than in pure transmission measurements. Metal-coated filters are therefore particularly useful for Raman and IR transflection workflows, but not for conventional IR transmission.
- Compatible with: IR transflection, Raman
- Not suitable for: IR transmission
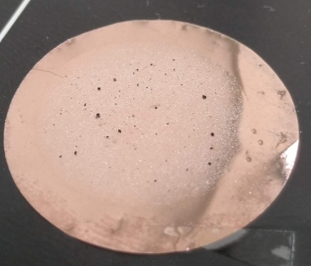
Gold-coated polycarbonate filter for IR transflection and Raman-based microplastics analysis. Image Credit: Bruker Optics
PTFE Membranes
PTFE membranes can be used for some IR measurements, but their own infrared absorption limits the accessible spectral range. Transmission is generally more favorable above about 1300 cm-¹, while a strong PTFE absorption band between roughly 1100 and 1300 cm-¹ overlaps part of the polymer fingerprint region and can complicate identification.
A second limitation is particle retention during handling. Because PTFE has a hydrophobic surface, particles may adhere only weakly and can be displaced or lost during transfer, storage, or measurement.
PTFE can therefore be useful in selected applications, including ATR-based measurements, but it is less suitable when complete spectral access or highly quantitative particle recovery is required.
- Compatible with: IR transmission (with limitations), ATR
- Key limitations: spectral gap within fingerprint region, particle adhesion and loss
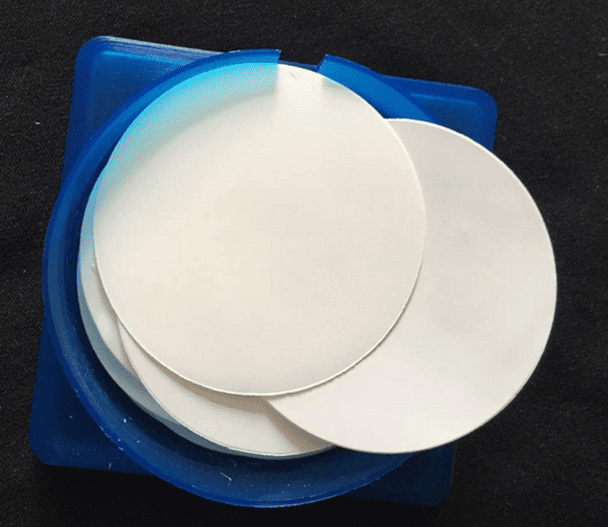
PTFE membrane filters for infrared transmission-based microplastics analysis. Image Credit: Bruker Optics
Nitrocellulose Filters
Nitrocellulose membranes are widely used for general filtration, but their spectroscopic compatibility is limited. Strong intrinsic infrared absorption prevents conventional transmission or transflection measurements, so ATR is generally the practical IR option.
They are also unsuitable for Raman microscopy because laser exposure can heat and damage the membrane, potentially causing burning. These limitations make nitrocellulose a poor choice for automated full-filter imaging workflows.
Nitrocellulose may still be useful where filtration performance is the priority and subsequent analysis is restricted to compatible point-based techniques.
- Compatible with: ATR
- Not suitable for: IR transmission, IR transflection, Raman, automated imaging
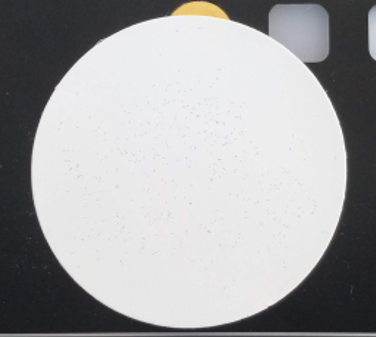
Nitrocellulose membrane filter with limited suitability for microplastics imaging workflows. Image Credit: Bruker Optics
Glass Fiber
Glass fiber filters are useful for general particle collection, but they impose significant spectroscopic limitations. Their strong infrared absorption makes them unsuitable for conventional IR transmission and transflection measurements, leaving ATR as the main practical IR option.
For Raman analysis, the glass substrate can generate its own Raman signal, which may overlap with or obscure the spectrum of the target particle. This background contribution makes polymer identification more difficult, particularly for weak or small particles.
Because of these optical limitations, glass fiber filters are generally better suited to selective point measurements than to automated full-filter spectroscopic imaging.
- Compatible with: ATR
- Raman: usable with caution; background contribution needs to be considered
- Not suitable for automated imaging workflow
#5 When to Use Point Spectroscopy vs. Chemical Imaging
FT-IR, IR laser, and Raman systems can all be used either to measure selected particles or to generate spatially resolved chemical images. The distinction matters because the two approaches define the particle population in fundamentally different ways, affecting detection bias, measurement time, statistical representativeness, and the amount of information retained for later analysis.
Micro-Spectroscopy
Micro-spectroscopy measures spectra at selected positions on the filter. Candidate particles are first identified from an optical image, manually or through image-analysis software, and spectroscopy is then used to determine their chemical composition. This approach works well when specific particles need to be investigated, but the quality of the final dataset depends on the initial optical detection step.
Critical Limitations
Transparent, low-contrast, overlapping, partially covered, or irregular particles can be difficult to recognize visually and may therefore never reach the spectroscopic measurement stage.
Measurement time also increases with the number of selected particles because each target requires an individual spectrum or set of spectra. Highly loaded filters can therefore make complete particle-by-particle analysis time-consuming and may encourage subsampling or other forms of particle selection.
Finally, the stored chemical information applies only to the positions that were measured. If classification criteria or spectral libraries change later, unmeasured regions of the filter cannot be reconstructed from the original dataset.
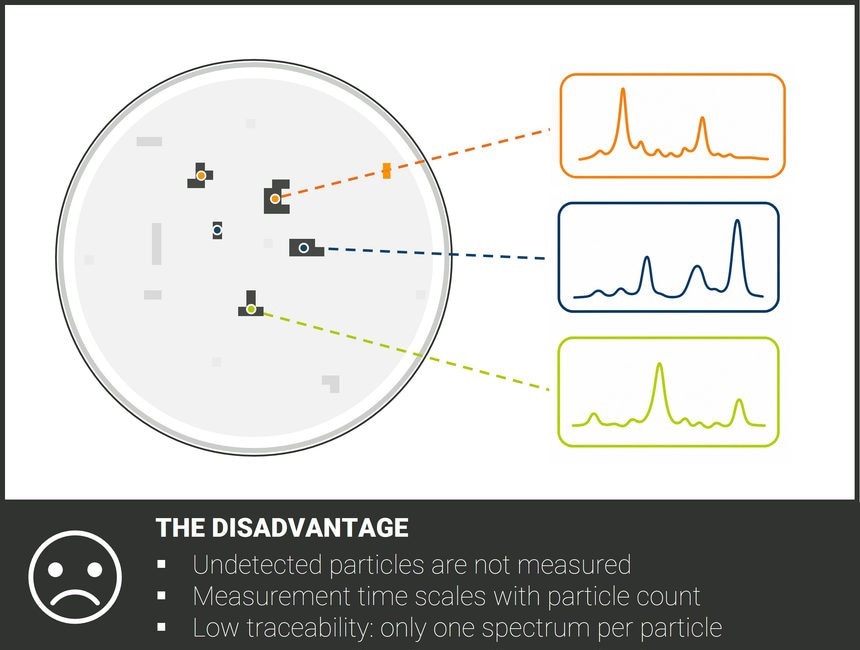
Image Credit: Bruker Optics
Spectroscopic Imaging
Spectroscopic imaging acquires spatially resolved spectra across a defined filter area rather than selecting individual particles beforehand. Chemical contrast within the resulting dataset can then be used to locate particles, assign polymer identities, and derive particle size and morphology.
Key Advantages
Because localization is based on spectral information rather than optical appearance alone, imaging reduces dependence on visual preselection. This is particularly useful for complex environmental samples containing transparent, weathered, biofouled, overlapping, or otherwise visually ambiguous particles.
For area-based imaging, acquisition time is primarily determined by the area and measurement parameters rather than by the number of particles present. This makes the workflow more predictable when particle loading varies between samples.
A further advantage is data retention. The spatially resolved spectral dataset can be stored and reprocessed if polymer libraries, classification thresholds, or evaluation algorithms change, allowing the same measurement to be reassessed without reacquiring the filter.
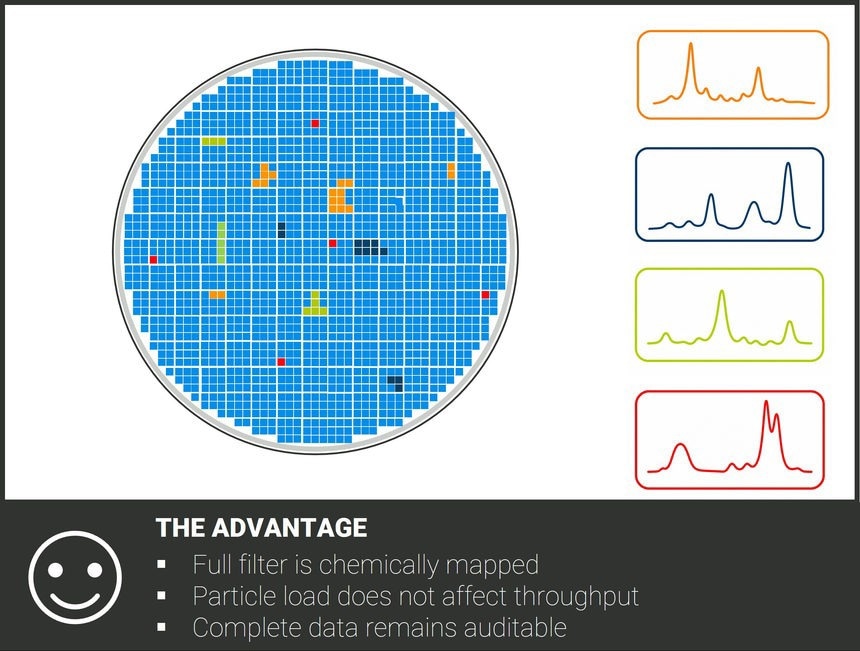
Image Credit: Bruker Optics
Source: Bruker Optics
| Feature Criteria |
Discrete Micro-Spectroscopy (Point-Based) |
Chemical Imaging (Hyperspectral Mapping) |
Object Selection
Principle |
Targeted: Requires visual identification by human eyes or optical edge-detection software before measurement. |
Untargeted: Systematically scans the entire active filter surface plane in a continuous, automated grid array. |
Susceptibility to
Analytical Bias |
High risk of visual selection bias; transparent, low-contrast, bio-fouled, or fine particles are frequently missed during visual pre-sorting. |
Zero visual bias; particles are detected by their unique spectroscopic signature and chemical contrast against the clean substrate backdrop. |
Measurement Time
Scaling |
Linear (T ∝ N): Total scan duration increases with every additional particle spotted and registered on the filter face. |
Constant (T = Constant): Scan time is completely fixed by total filter surface area, regardless of particle quantity or density. |
| Data Array Character |
Isolated, decoupled single-point data vectors linked exclusively to manual spatial coordinate registers. |
A continuous, fully integrated three-dimensional hyperspectral data cube (X, Y spatial fields + Z full spectral wavenumber). |
Archival & Auditing
Utility |
Low; only pre-selected items are recorded. Missed or sub-visible particles are permanently absent from the analytical record. |
High; preserves an absolute, unalterable digital/spectroscopic twin of the entire filter surface for retrospective parsing and automated code audits. |
Subsampling and Partial Filter Analysis
Subsampling reduces measurement time by analyzing only part of a sample or filter. The trade-off is representativeness: if particles are distributed unevenly, the measured fraction may not accurately describe the complete sample. Clustering, edge effects, filtration patterns, and handling losses can all increase this uncertainty.
Full-filter analysis avoids the need to extrapolate from a measured fraction and is therefore advantageous when complete particle counts, size distributions, morphology, and polymer composition are required. This becomes particularly relevant for point-based techniques, where measurement time increases with the number of particles analyzed.
Common Approaches to Subsampling
Please note: if subsampling is necessary, the sampling strategy, measured fraction, and any extrapolation used to estimate the complete sample should be documented clearly. ISO 24187:2023 establishes general principles for representative sampling and microplastics analysis across environmental matrices.
- Volumetric aliquots divide the liquid sample before filtration. Additional transfer steps can introduce particle losses through adhesion to containers, pipettes, or other surfaces.
- Reduced filter area concentrates the sample onto a smaller surface. While this can shorten the area that needs to be analyzed, high particle densities may increase overlap and make automated sizing or morphology assessment more difficult.
- Filter subsectioning measures selected regions of a fully loaded filter rather than the entire surface. This approach assumes that the selected areas represent the overall filter, which may not hold when deposition is spatially uneven.
- Particle-number subsampling chemically analyzes only a subset of particles identified optically. This can reduce measurement time, but uncertainty increases when the selected particles do not adequately represent the full range of polymers, sizes, and morphologies present.
Subsampling can therefore introduce an additional source of uncertainty whenever the measured fraction does not fully represent the complete particle population. Full-filter chemical imaging avoids this extrapolation step by analyzing the entire defined filter area, reducing spatial sampling bias and preserving a complete chemical dataset for particle counting, sizing, and classification.
Subsampling vs. Full Filter Imaging
Source: Bruker Optics
| |
Subsampling & Partial Filter Analysis |
Full-Filter Chemical Imaging |
Throughput
& Scaling |
Favorable for Point Systems:
Drastically cuts instrument runtime on slower point-by-point IR or Raman setups. |
Fixed by Area:
Scan time is independent of particle density (e.g., ∼3.5 hours for a 25 mm filter via standard FT-IR imaging). |
Statistical
Error |
Extrapolation Risk:
Introducing a scaling factor multiplies any underlying spatial errors caused by uneven particle settling or edge-clustering. |
Zero Spatial Bias:
Captures 100% of the active surface plane, accurately representing particle morphology and size distributions. |
Operational
Overhead |
Manual Labor:
Parameter settings for particle
detection and partial filter analysis need expertise and vary from sample to sample. |
Hardware & Data Demand:
Requires advanced instrumentation (imaging detectors like an FPA) and generates large hyperspectral data cubes. |
Data
Traceability |
Restricted Auditing:
Unmeasured filter regions are missing from the analytical record; results cannot be fully re-evaluated if classification criteria change. |
Absolute Traceability:
Preserves an unalterable "digital twin" of the entire filter face, allowing complete retrospective audits and library updates. |

This information has been sourced, reviewed and adapted from materials provided by Bruker Optics.
For more information on this source, please visit Bruker Optics.