Photoemission spectroscopy (PES), or photoelectron spectroscopy, is essential in material science research. It aids in understanding the electronic structure and chemical composition of complex materials. Using various techniques, PES can work with photon energies from 5 eV to several keV to probe a sample.1
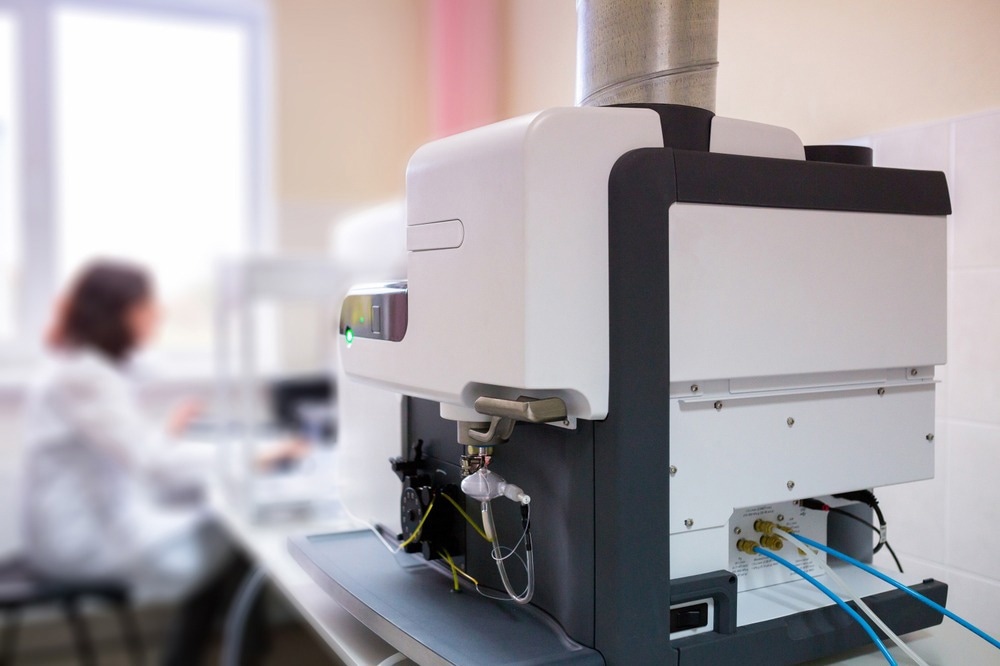
Image Credit: Sodel Vladyslav/Shutterstock.com
PES has high surface sensitivity, making it a powerful analytical technique for studying various materials, including semiconductors, metals, and insulators. It can decipher properties that influence a material’s interaction with other surfaces, such as wetting, bonding, degradation, charge transmission, and catalysis.2
Fundamental Principles and Techniques
The photoionization process forms the basis of PES, which involves the detection of electrons emitted due to excitation by an incident monochromatic light. These photoelectrons may come from valence band or core levels depending on the incident light's wavelength. Measuring the kinetic energy and emission angle of the outgoing electron helps determine band dispersions in the material.1
A PES instrument includes an excitation source, specimen stage, extraction lenses, analyzer, and detector. The excitation source is crucial as its energy determines measurable transitions, probing depth, and kinetic energy of excited electrons, while the linewidth governs the spectroscopy resolution.
PES operates in an ultrahigh vacuum (UHV) to avoid photoelectron scattering while passing from the specimen surface to the analyzer and to prevent surface contamination.2
PES is categorized as ultraviolet photoemission spectroscopy (UPS) and X-Ray photoemission spectroscopy (XPS) based on the electron energy range accessible during photoionization.
XPS generally uses Al Kα and Mg Kα X-Rays with excitation energies of 1486.6 eV and 1253.6 eV, respectively. Alternatively, UPS works between 5 to 100 eV photon energy range, usually employing He-I (21.2 eV) and He-II (40.8 eV) sources.1
Data analysis helps extract relevant information from PES measurements. Various software packages, including those provided by instrument manufacturers, are commercially available for data reduction. These packages offer several components for data interpretation, including element libraries, baseline subtraction, peak fitting, calibration, and quantification.2
Applications of PES in Material Science
PES can probe the surface of various materials, from semiconductors to textiles, plastics, and soil. Survey spectra using PES reveal key elemental compositions, including unexpected elements in a specimen.
The primary advantages of PES techniques are their high surface sensitivity (approximately 10 nm for XPS and 3 nm for UPS) and non-destructive nature compared to other material characterization methods with comparable performance.2,3
XPS can determine the chemical environment inside a sample, which affects the photoelectrons’ binding energy, and can detect elements with approximately 0.1 %-1 % limits. It also provides information beyond material analysis; for instance, while polypropylene and polyethylene have the same C 1s spectra, their different XPS spectra enable distinguishing between the two polymers.2
Additionally, PES can be used to analyze the intrinsic mechanisms of a material. It explains deviations in superconducting transition temperatures and increases in thermal stability, strength, and hardness in multicomponent transition metal glasses with rising mixing entropy. In the case of alloying, UPS can reveal reliable information regarding the density of states at the Fermi level.1
UPS data can determine a material’s work function and ionization energy, which is crucial for understanding a chemisorbate’s interface with a sample or measuring the band structure of an inorganic/organic semiconductor.3 UPS plays a significant role in constructing energy band representations for electronic devices like photovoltaic cells and light-emitting diodes.2
Challenges and Considerations
Despite technical advances, PES techniques face multiple challenges. Their extreme sensitivity is beneficial for material investigation but poses a significant challenge in sample preparation since spectra for specimens prepared in air and UHV generally do not match.3 Extreme care is therefore required to prevent surface contamination, which is more problematic in UPS, as it is more sensitive than XPS.2
Surface charges on a sample hinder PES measurement, especially in insulating samples, thereby requiring charge neutralizers.2 Additionally, the low kinetic energies of photoelectrons make them vulnerable to electric and magnetic fields, affecting the reliability of results.3
PES techniques have a lateral resolution of a few micrometers, which is informative but not comparable to other methods such as energy dispersive spectroscopy or Auger electron spectroscopy.2 Moreover, PES can reveal only limited information about amorphous materials.1
Data interpretation of PES techniques generally requires samples of various thicknesses on multiple substrate types and occasionally at different incident beam intensities or bias voltages. Furthermore, a full interpretation of PES spectra is often obtained through molecular modeling.3
Future Outlooks
Significant efforts are being made to overcome the challenges of PES techniques and to help users quickly obtain reliable results.
A recent article in Surface and Interface Analysis detailed efforts to enhance XPS analysis quality with increasing usage. It focused on three issues: providing detailed guides and information for beginners, improving data and analysis reporting, and addressing peak fitting problems. Providing useful information incrementally, along with examples, is being considered in a paper series on challenges in PES-based surface analysis.4
Researchers are also working to resolve photoelectron peak fitting issues, including the recognition of specific elements. A peak-fitting social network is also being developed to facilitate exchanges between beginners and experienced XPS users. This platform allows anyone attempting XPS data fitting (for papers or other purposes) to ask questions and interact dynamically.4
Another recent article in Scientific Reports proposed laser-based angle-resolved PES (ARPES) and demonstrated its application for detecting three-dimensional spin vectors. This equipment uses a high-resolution photoelectron spectrometer, a highly focused 6-eV laser beam, a precisely controlled sample stage, and a double very-low-energy-electron-diffraction spin detector.
The developed ARPES, as demonstrated by analyzing topological insulators and gold photolithography patterns, achieves an energy resolution of 1.5 (5.5) meV without (with) the spin detection mode and a spatial resolution better than 10 µm.5
Overall, PES is a powerful technique that enhances our understanding of the fundamental physics of complex materials and will continue to find new applications.
More from AZoOptics: Single-Photon LiDAR Revolutionizes Aviation
References and Further Reading
1. Pervan, P., Trontl, VM., Figueroa, IA., Valla, T., Pletikosić, I., Babić, E. (2023). Compositionally Complex Alloys: Some Insights from Photoemission Spectroscopy. Materials. doi.org/10.3390/ma16041486
2. Stevie, FA., Donley, CL. (2020). Introduction to x-ray photoelectron spectroscopy. Journal of Vacuum Science & Technology A. doi.org/10.1116/6.0000412
3. Whitten, JE. (2023). Ultraviolet photoelectron spectroscopy: Practical aspects and best practices. Applied Surface Science Advances. doi.org/10.1016/j.apsadv.2023.100384
4. Baer, DR., Watts, JF., Herrera-Gômez, A., Gaskell, KJ. (2023). Evolving efforts to maintain and improve XPS analysis quality in an era of increasingly diverse uses and users. Surface and Interface Analysis. doi.org/10.1002/sia.7194
5. Iwata, T. et al. (2024). Laser-based angle-resolved photoemission spectroscopy with micrometer spatial resolution and detection of three-dimensional spin vector. Scientific Reports. doi.org/10.1038/s41598-023-47719-z
Disclaimer: The views expressed here are those of the author expressed in their private capacity and do not necessarily represent the views of AZoM.com Limited T/A AZoNetwork the owner and operator of this website. This disclaimer forms part of the Terms and conditions of use of this website.