One of the three most commonly used materials for thin-film solar cells, along with cadmium telluride and amorphous silicon, is copper indium gallium selenide (CIGS). In comparison to bulk solar cells comprised of crystalline silicon, these types of solar cells offer greater cost efficiency because the amount of material needed to produce the solar cells is low.
These solar cells still exhibit lower cell efficiencies, despite this, as a result of less mature upscaling compared to crystalline silicon-based solar cells. In order to enhance their properties, CIGS materials are still intensively investigated. Chemical substitution is usually used to carry out this investigation, as is designing the interfaces of the solar cell layers.
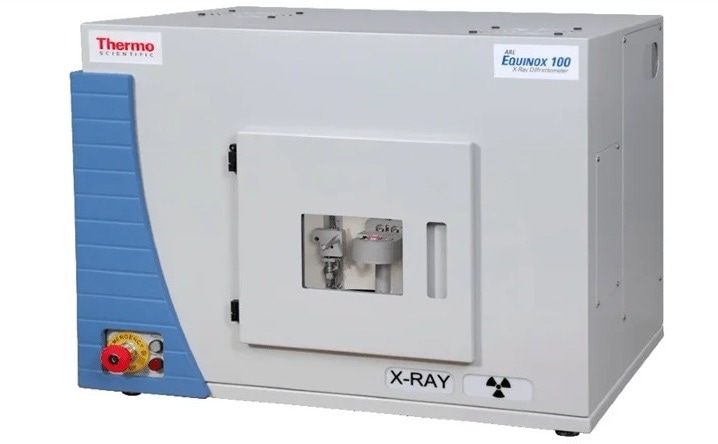
Figure 1. ARL EQUINOX 100 X-Ray Diffractometer. Image Credit: Thermo Fisher Scientific - Elemental Analyzers and Phase Analyzers
The typical device structure is a glass substrate or a flexible substrate like a polyimide. The back electrode is a layer of Mo, followed by the absorber (CIGS). In addition, a buffer layer of CdS and ZnO and transparent electrode (ZnO:Al) is used as window material (intrinsic ZnO).
It is vital that the structural and chemical composition of the product is controlled, as well as the thickness of the layers, in order to guarantee the product’s optimal quality and performance.
Along with more sophisticated analyses in research labs, the simplest and most convenient solution for routine QC/QA processes can be seen when both energy dispersive X-Ray fluorescence spectroscopy (EDXRF) and X-Ray diffraction (XRD) work together.

Image Credit: Thermo Fisher Scientific - Elemental Analyzers and Phase Analyzers
About the Thermo Scientific ARL EQUINOX 100 X-Ray Diffractometer
A portfolio of XRD instruments is represented by the Thermo Scientific™ ARL™ EQUINOX Series, ranging from user-friendly simple bench-top systems suited to routine analysis to advanced, high-performance floor-standing, research-grade systems.
A custom-designed Cu (50 W) or Co (15 W) high-brilliance micro-focus tube with mirror optics is used by the Thermo Scientific™ ARL™ EQUINOX 100 X-Ray Diffractometer (c.f. Figure 1).
The addition of external water chillers or other peripheral infrastructure is not required by the low wattage system. The instrument could be easily transported between laboratories and from labs to the field.
A thin film attachment can be added to the Thermo Scientific™ ARL™ EQUINOX 100 X-Ray Diffractometer, providing a computer-controlled ω and ᴢ movement for sample alignment and measurement (c.f. Figure 2).
The Thermo Scientific™ ARL™ EQUINOX 100 X-Ray Diffractometer offers rapid data collection times thanks to its unique curved position sensitive detector (CPS), which measures all diffraction peaks in real-time, simultaneously in comparison to conventional diffractometers. It is, therefore, ideally suited to the fast screening of thin-film samples utilizing GIXRD, with screenings typically complete within just a few minutes.
A highly sensitive silicon drift detector (SDD) is utilized by the Thermo Scientific™ ARL™ QUANT’X EDXRF Spectrometer in order to discriminate between the energy of the incoming radiation. The measurement of all elements between F (Z = 9) and U (Z = 92) is facilitated by the instrument as a result.
It also features a 50 W Rh or Ag tube, which is operational at voltages up to 50 kV. The Fundamental Parameters (FP) analysis program included in the Thermo Scientific™ WinTrace software facilitates the conversion of spectra into elemental or oxide concentrations and layer thickness.
Its compact and robust design, as well as low demand for additional peripheral infrastructure, make the ARL QUANT’X an ideal industrial environment solution.
Case Study
An ARL EQUINOX 100 with Cu-Kα radiation (1.541874 Å) was used to measure a CIGS solar cell pre-assembly sample, consisting of a Mo back electrode and CIGS absorber layers, for 2 minutes after the careful alignment of ᴢ and ω on the thin film stage.
SYMPHONIX was used to carry out all data processing and evaluation for data acquisition, as was the MDI JADE 2010 equipped with the pdf4+ database for the qualitative phase analysis.
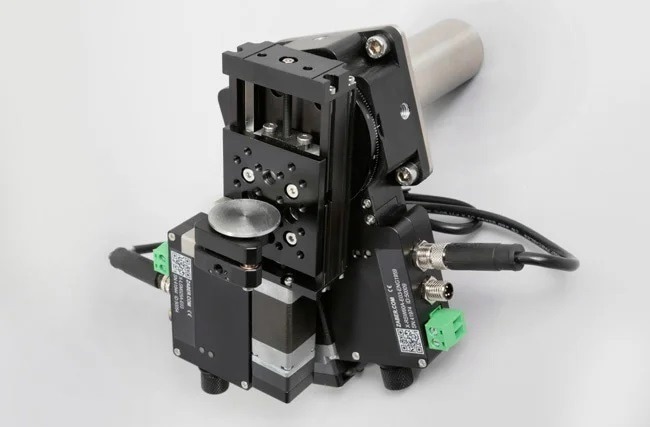
Figure 2. Thin-film attachment. Image Credit: Thermo Fisher Scientific - Elemental Analyzers and Phase Analyzers
Results
Individual layers can be exhibited exclusively and in sequence from the top to the bottom layers, thanks to the use of changing grazing angles in successive GIXRD measurements. Increasing a grazing angle of 5° (Figure 3, black) shows additional peaks related to Mo, whilst only a CIGS phase was shown in a measurement performed with a 1° grazing angle (c.f. Figure 3, green).
The individual investigation of the arrangement and the crystallography of each of the layers is therefore possible as a result.
The results from the EDXRF scans investigating the layers’ elemental concentrations and thickness are illustrated in Table 1. Pristine CIGS and thicknesses are revealed by the chemical analysis, which are typical for these kinds of modules.
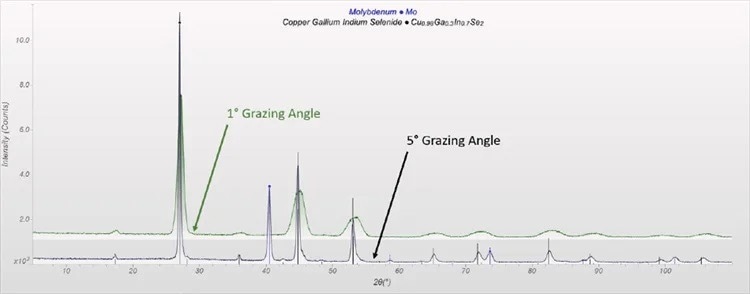
Figure 3. GIXRD pattern (3 - 110° 2θ; grazing angle 1° green; 5° black) with 2 min measurement time. Image Credit: Thermo Fisher Scientific - Elemental Analyzers and Phase Analyzers
Table 1. Results of the EDXRF measurement. Source: Thermo Fisher Scientific - Elemental Analyzers and Phase Analyzers
| Layer |
Thickness (µm) |
Elements |
Concentration (wt%) |
| CIGS |
1.43 |
Cu |
19.50% |
| Se |
46.80% |
| In |
23.50% |
| Ga |
10.20% |
| Mo |
0.34 |
Mo |
100.00% |
Summary
The acquisition of a full GIXRD scan of CIGS solar cells within a measurement time of just two minutes is facilitated by the ARL EQUINOX 100 X-Ray Diffractometer. Users can distinguish between the amorphous and crystalline character of the sample and different structure types – even between the different layers in the same module.
Aligning the sample does not require users to already possess advanced knowledge of the operation. It is also considered a straightforward process. With insight offered by EDXRF analysis into the chemical composition and the thickness of the individual layers, users can have complete control over the quality of the product, as well as the ability to track the concentrations of dopants.
When it comes to basic thin film and coating investigations, not only in industrial applications but in academic research, XRD investigations and EDXRF working together is an easy-to-use solution – facilitating reliable and fast QC/QA procedures, even for untrained operators.
Acknowledgments
This article was produced from materials originally written by Dr. Simon Welzmiller and Ju Weicai from Thermo Fisher Scientific.

This information has been sourced, reviewed and adapted from materials provided by Thermo Fisher Scientific - Elemental Analyzers and Phase Analyzers.
For more information on this source, please visit Thermo Fisher Scientific - Elemental Analyzers and Phase Analyzers.