There is now increased demand for effective ways of air quality monitoring, thanks to the U.S. Environmental Protection Agency’s (EPA) mission to improve air quality. Monitoring the elements present in the airborne ambient matter that gathers on dust filters in residential, recreational and industrial areas is one such method.

Image Credit: Thermo Fisher Scientific - Elemental Analyzers and Phase Analyzers
The most popular method to measure this collected matter is XRF (X-Ray fluorescence), particularly as the method is non-destructive and highly sensitive.
For the measurement of the different elements collected on filters, the ARL™ QUANT’X Energy Dispersive X-Ray Fluorescence (EDXRF) system from Thermo Scientific™ is an ideal method. The perfect size to easily sit on a lab benchtop, the ARL™ QUANT’X Energy Dispersive X-Ray Fluorescence (EDXRF) system can be used to accurately measure all the elements between (and including) sodium and americium.
When using a sample changer, the system can work - with little sample preparation required - on filters of sizes between 25 – 47 mm, or up to 220 mm with manual loading.
As the system uses a revolutionary silicon drift detector (SDD), which reduces the potential impact of spectral interference, clean, high-quality data is able to be collected. A large solid angle for the efficient collection of X-Ray signals is provided as the detector has a large 30 mm2 working area.
A high-flux rhodium anode tube (for X-Ray propagation) provides sensitivity over a wide element range which can work alongside nine different filters or directly irradiate the sample to provide different excitation wavelengths.
The ARL QUANT’X Spectrometer: What Makes It Perfect for Air Filter Monitoring?
- SDD provides a typical resolution of 135 eV when using an Mn K-a source.
- Fantastic sensitivity due to the large area of the silicon drift detector (SDD)
- Can detect elements ranging from sodium (Z = 11) to americium (Z = 95)
- Rhodium anode X-Ray tube with 50 W flux and an excitation voltage between 4 – 40 kV with 1 kV steps
- Possible to analyze several different elements simultaneously
- Large dynamic range that can measure in concentrations between ppm to %
- X-Ray tube filter wheel with nine options to improve the sensitivity of a wide element range
- Works with a range of different sample sizes and types
- Automated sample changer with 10-positions, with 20-position changer available for samples of 32 mm diameter
- Digital pulse processing for improved throughput and rapid measurement
- Five different primary tube collimators are available (1.0 mm to 8.8 mm)
- UniQuant™ Software, from Thermo Scientific™, for the elemental analysis of samples without having to use a standard
- Ethernet connection facilitating remote access
- WinTrace Software, from Thermo Scientific™, with included fundamental and empirical parameters and thin film modules
The technical features listed below support the years of reliable service the instrument provides, in addition to the above benefits:
- Mechanically simple
- Field transportable and rugged for mobile use
- Long-term stability – individual calibrations remain within Q.C. specifications for months
- Low maintenance cost
Excitation Conditions
Filtered X-Ray radiation is used by the ARL QUANT’X in order to excite the sample under optimum conditions, generating the fluorescence of the different elements of the sample.
A nine-position filter wheel is used to reduce noise and provides a tailored excitation wavelength. For optimal excitation of the elements of concern and best limits of detection, the various acquisition parameters are selected.
Sample Preparation and Presentation
It is not necessary to prepare the air filter prior to analysis: instead, the only thing needed is a simple check to ensure that there are no filter defects that might have an impact on the measurement. To avoid measurement of elements within the ambient air and therefore improve sensitivity towards light elements, analysis of the filter takes place under vacuum conditions.
If they are larger than 31 mm in diameter, the filters can be loaded into an auto-sampler tray ten at a time or a 20-position tray can be used if smaller than 31 mm in diameter. Removable sample holders are featured within the auto-sampler tray for the loading of filters of different sizes.
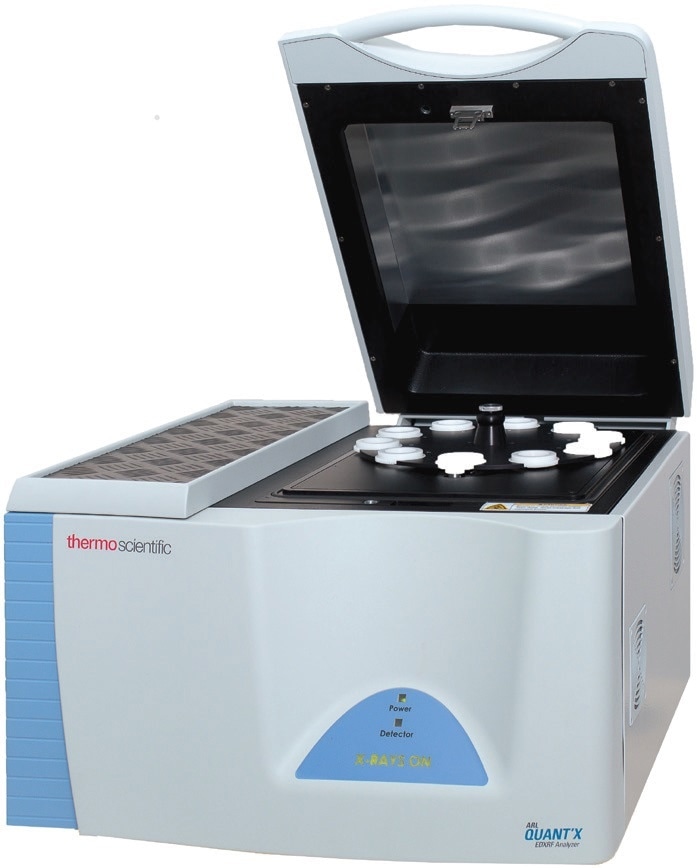
Image Credit: Thermo Fisher Scientific - Elemental Analyzers and Phase Analyzers
Quantitative Analysis
A modified version of U.S. EPA Compendium Method IO-3.3 was the analysis method of choice (Determination of Metals in Ambient Particulate Matter).
Commercial thin film standards (single or dual element) and blank films provided by MicroMatter, Technologies Inc. can be used to carry out individual empirical calibrations. A National Institute of Standards and Technology (NIST) standard reference material (SRM) 2783 Air particulate on filter media was used to verify the calibrations.
Figure 1 shows the spectrum of NIST SRM 2783 taken using the ARL QUANT’X, identifying the elements of interest. This spectrum was taken over 300 seconds, and a 50 kV excitation voltage and a thick palladium filter were used. It is simple to identify individual elemental signals thanks to the high spectral resolution and high signal-to-noise ratio.
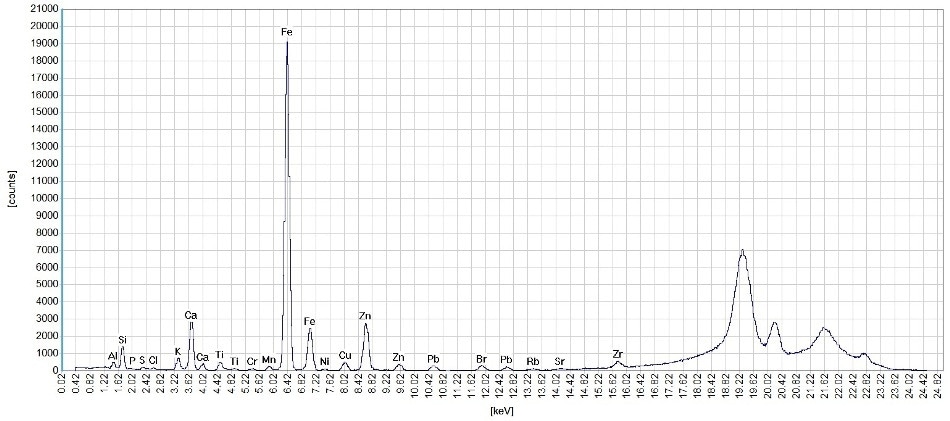
Figure 1. Spectrum of NIST SRM 2783. Image Credit: Thermo Fisher Scientific - Elemental Analyzers and Phase Analyzers
For different element types, the five excitation conditions that are most suitable are shown in Table 1. Though a total measurement time of 25 minutes is needed for each sample, the measurement time per sample can be adjusted depending on the needs of the experiment.
WinTrace Software’s advanced deconvolution algorithm automatically calculates the net peak intensities, removing peak overlaps. Compared to a region of interest (ROI) approach, this provides more comprehensive data.
Table 1. Excitation conditions. Source: Thermo Fisher Scientific - Elemental Analyzers and Phase Analyzers
| Condition |
Filter |
Voltage (kV) |
Atmosphere |
Live Time (s) |
Elements |
| Low Za |
None |
4 |
Vacuum |
300 |
Na, Mg |
| Low Zb |
Thick C |
15 |
Vacuum |
300 |
Al, Si, P, S, Cl, K, Ca, Sc, Ag, Cd, Sn, Sb, Te, I |
| Low Zc |
Al |
20 |
Vacuum |
300 |
Ti, V, Cr, Mn, Cs, Ba, La |
| Mid Zc |
Thick Pd |
50 |
Vacuum |
300 |
Fe, Co, Ni, Cu, Zn, Ga, Ge, As, Se, Br, Rb, Sr, Y, Zr, Hg, Tl, Pb, Bi |
| High Za |
Thin Cu |
50 |
Vacuum |
300 |
Nb, Mo, Ag, Cd, In, Sn, Sb, Te, I |
Limits of Detection
The use of minimum detection limits (MDLs) is so essential because they describe the limitations of the data that has been collected. The MDLs can be determined for air filter analysis thanks to the repeated measurement of lab blanks.
The average uncertainty from the analysis of 10 blanks using the ARL QUANT’X is used to calculate the MDLS, as shown in Table 2. The measured MDLs are reported as 1 σ (68% confidence level) when this data is compared to the U.S. EPA Compendium Method IO-3.3.
Table 2. Comparison of ARL QUANT’X Spectrometer limits of detection and U.S. EPA method. Source: Thermo Fisher Scientific - Elemental Analyzers and Phase Analyzers
| Analyte |
ARL QUANT’X MDLs
1σ, ng/cm2 |
Method IO-3.3 MDLs
1σ, ng/cm2 |
| Na |
4.6 |
5.3 |
| Mg |
1.7 |
3.2 |
| Al |
1.9 |
17.6 |
| Si |
0.9 |
8.0 |
| P |
0.9 |
2.6 |
| S |
0.9 |
2.6 |
| Cl |
0.6 |
4.8 |
| K |
0.3 |
6.3 |
| Ca |
0.2 |
9.0 |
| Sc |
0.4 |
1.5 |
| Ti |
0.2 |
16.9 |
| V |
0.2 |
5.3 |
| Cr |
0.2 |
3.0 |
| Mn |
0.2 |
0.8 |
| Fe |
0.3 |
0.7 |
| Co |
0.1 |
0.4 |
| Ni |
0.2 |
0.6 |
| Cu |
0.5 |
0.7 |
| Zn |
0.4 |
1.0 |
| Ga |
0.3 |
1.6 |
| As |
0.2 |
0.8 |
| Se |
0.1 |
0.7 |
| Br |
0.6 |
0.6 |
| Rb |
0.3 |
0.7 |
| Sr |
0.4 |
1.1 |
| Y |
0.3 |
1.2 |
| Zr |
0.8 |
1.2 |
| Mo |
0.2 |
1.6 |
| Pd |
3.0 |
22.9 |
| Ag |
3.0 |
20.2 |
| Cd |
4 (0.6) |
22.0 |
| Sn |
16 (1.0) |
30.5 |
| Sb |
21 (1.3) |
31.4 |
| Cs |
0.7 |
48.9 |
| Ba |
0.6 |
51.8 |
| La |
0.1 |
70.6 |
| W |
1.0 |
3.4 |
| Au |
0.5 |
1.7 |
| Hg |
0.5 |
1.5 |
| Pb |
0.4 |
1.5 |
( ) MDL obtained using L lines
The ARL QUANT’X is equal to – if not an improvement on – the levels given in the US EPA Compendium Method IO-3.3 for most of the elements listed. The detection levels of the system range from 1 ng/cm2 to 21 ng/cm2.
This value is the MDL 1 σ value for the element’s L line, and for some of the elements in Table 2, an extra value is given in brackets. L lines can sometimes provide a better MDL, despite the fact they tend to be impacted more by spectral interference than K lines. Figure 2 shows a graph of the 1 σ MDLs possible using the ARL QUANT’X vs. those in the U.S. EPA Compendium Method IO-3.3.
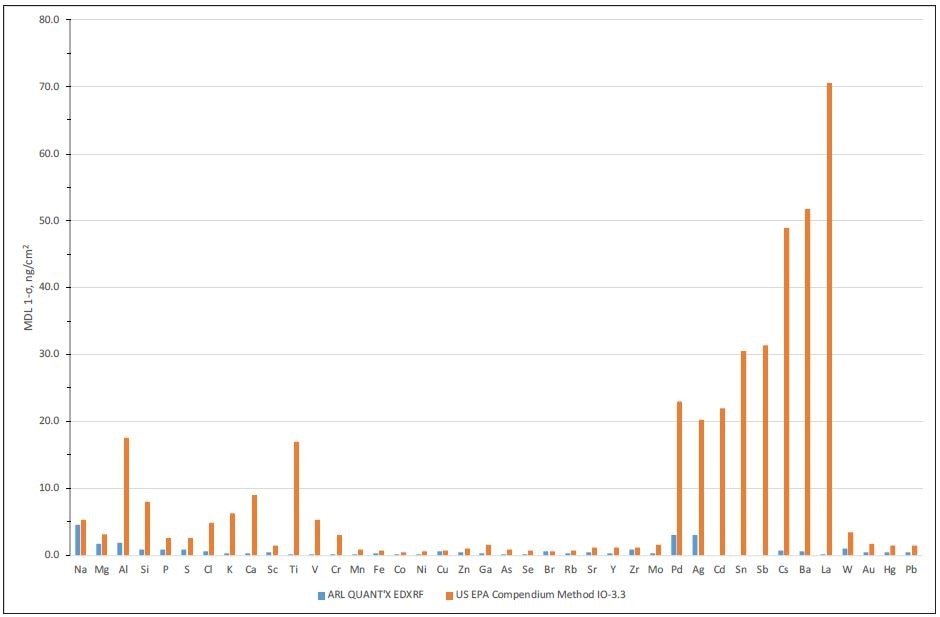
Figure 2. Comparison of ARL QUANT’X Spectrometer limits of detection and U.S. EPA method. Image Credit: Thermo Fisher Scientific - Elemental Analyzers and Phase Analyzers
Conclusion
The excellent performance of the ARL QUANT’X Spectrometer for the analysis of air filters is shown by the results described. The performance is ideal for both light and heavy elements, as the detection limits for different elements sit between values of less than 1 ng/cm2 to a few ng/cm2.
All of the ARL QUANT’X Spectrometer’s detection limits are lower than those given in the EPA’s Compendium Method IO-3.3.

This information has been sourced, reviewed and adapted from materials provided by Thermo Fisher Scientific - Elemental Analyzers and Phase Analyzers.
For more information on this source, please visit Thermo Fisher Scientific - Elemental Analyzers and Phase Analyzers.