Terahertz waves fall between the microwave and infrared regions of the electromagnetic spectrum. Biomedicine, homeland security, information and communication technology, pharmaceutical science, and various other fields benefit from these waves.
Image Credit: Ken stocker/Shutterstock.com
The non-destructive sensing and imaging of explosives and illicit drugs depending on their spectral fingerprints are well-known applications of THz waves.
Terahertz time-domain spectroscopy has been used in most terahertz wave measurements (THz-TDS). Different non-destructive testing and validation applications have used the transmission mode THz-TDS system. However, measuring highly absorbing and thick samples in transmission mode can be difficult.
Attenuated total reflection terahertz time-domain spectroscopy (ATR THz-TDS) could be used to solve such problems. In this technique, a sample is kept on a prism. The THz wave encounters total internal reflection, and the evanescent wave is produced at the interface between the prism. The sample allows THz properties to be determined.
Apart from the benefits of the ATR THz-TDS system, THz wave non-destructive testing is restricted to transmission and reflection mode measurement systems. Using ATR THz-TDS, the current study presents a method for identifying a sample sealed in a plastic bag without opening it.
Methodology
The experiment’s terahertz time-domain spectroscopy is shown in Figure 1. A beam splitter divides a femtosecond laser beam into two equal halves. The system’s maximum dynamic range is around 65 dB at around 200 GHz, and it covers a frequency range of 100 GHz to 3 THz. The frequency resolution of this system is 24 GHz.
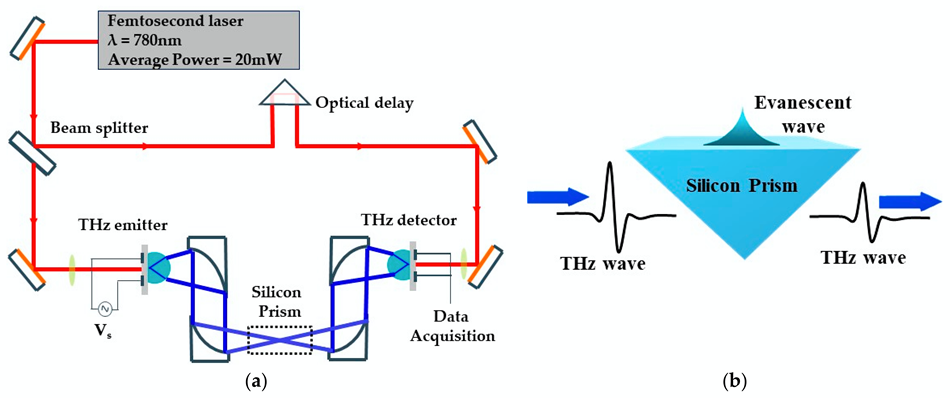
Figure 1. (a) Schematic diagram of the THz time-domain spectrometer. The dotted line shows the position of the Silicon prism in the spectrometer. (b) Schematic diagram of a Silicon prism. Image Credit: Hashimoto and Tripathi, 2022
A Silicon (Si) prism with a refractive index of 3.41 was used because of its high resistivity and low terahertz absorption loss. The total internal reflection of the THz wave at the boundary between the Si prism surface and air generates an evanescent wave that infiltrates the sample mounted in contact with the prism. The frequency of the THz wave and the sample’s refractive index influence the depth of penetration.
The dependence of the penetration depth on the refractive index (n2) and frequency are shown in Figure 2. This demonstrates that as the frequency decreases, the depth of penetration increases. This means that even if the sample is packaged in a plastic bag, the THz properties can be evaluated as long as the bag thickness is less than the evanescent wave’s penetration depth.
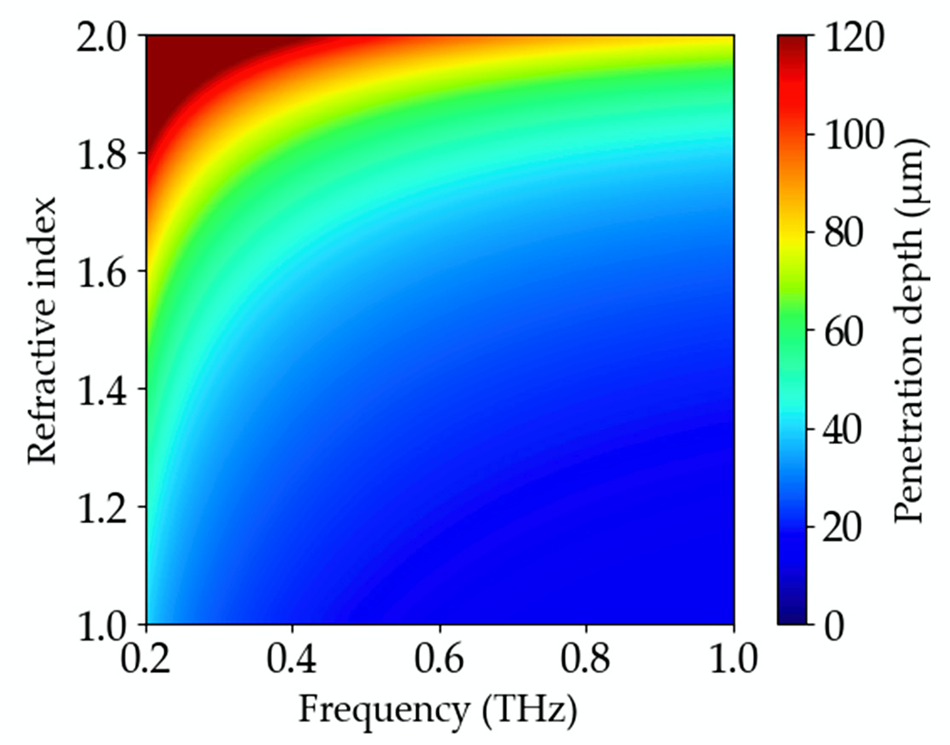
Figure 2. The penetration depth dependency on the frequency of THz wave and the refractive index of the sample. Here, a Silicon prism (n = 3.41) is used as a medium for total internal reflection. Image Credit: Hashimoto and Tripathi, 2022
The researchers used α-lactose monohydrate as a test sample as it has absorption features at 0.53 THz, 1.19 THz, and 1.39 THz. The sample has a particle size of less than 100 µm. As shown in Figure 3a, the lactose powder was sealed in a polyethylene plastic bag having a thickness of 10 µm ± 3 µm. To obtain spectroscopic information, the sample was placed on a silicon prism (Figure 3b).
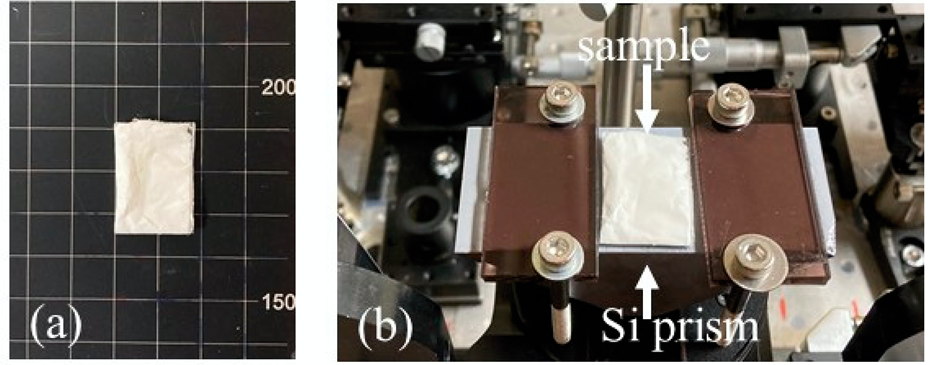
Figure 3. (a) Lactose sample packaged in a plastic bag (b) Sample placed on the Silicon prism. Image Credit: Hashimoto and Tripathi, 2022
Results
The scientists started by measuring the lactose powder’s attenuated total reflection, refractive index, and absorption coefficient. Figure 4 reveals the time-domain THz pulse with and without placing the sample on a Silicon prism. They performed the measurement five times to increase the signal-to-noise ratio and averaged the results.
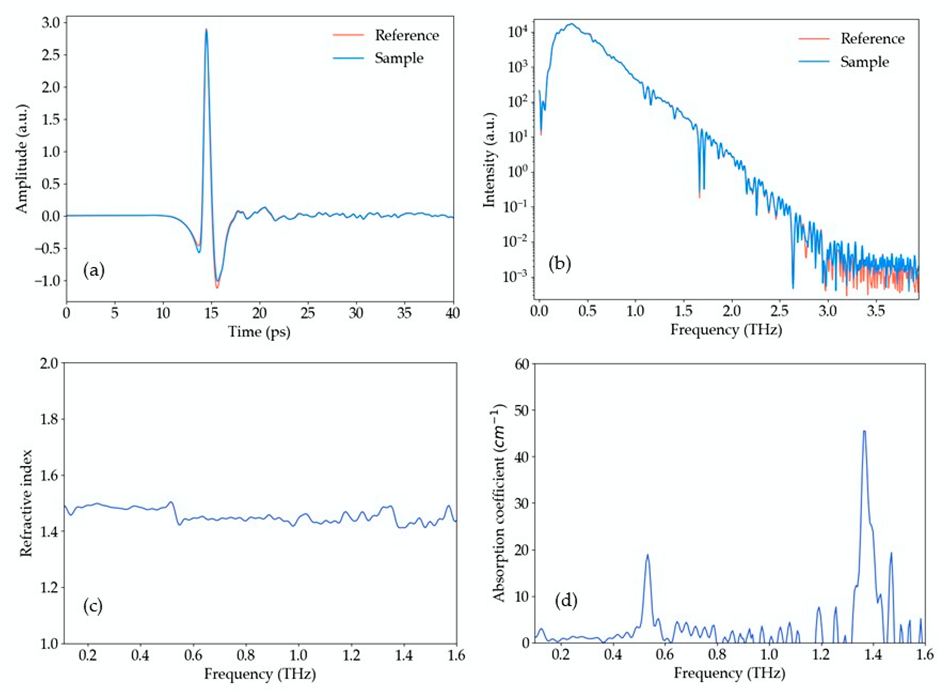
Figure 4. (a) The THz time domain reference and sample pulses, (b) their respective intensity spectra, (c) refractive index, (d) absorption coefficient of lactose sample. Image Credit: Hashimoto and Tripathi, 2022
The lactose sample's refractive index and absorption coefficient are shown in Figure 4c, d. Lactose’s distinct absorption characteristics at 0.53 THz and 1.39 THz are immediately evident.
The absorption coefficient and refractive index of the lactose sample, which was wrapped in a polyethylene bag, were determined in the next step. The sample’s refractive index and absorption coefficient were calculated and depicted in Figure 5.
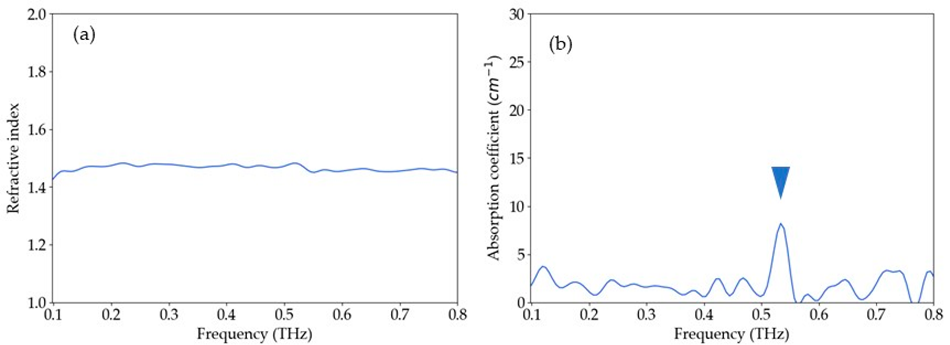
Figure 5. (a) The refractive index and (b) the absorption coefficient of the packaged sample. The absorption peak at 0.53 THz is clearly visible, as shown by the arrowhead. Since the penetration depth of the evanescent wave is smaller than the thickness of the plastic bag at high frequencies, the absorption features of the lactose sample at high frequency cannot be measured reliably. Therefore, the absorption coefficient is shown up to 0.8 THz. Image Credit: Hashimoto and Tripathi, 2022
Although lactose has distinct absorption peaks, only the first absorption peak at 0.53 THz was identified when the sample was packaged in the polyethylene bag. The lactose sample’s absorption characteristics cannot be reliably measured at high frequency.
Overall, the results show that attenuated total reflection terahertz time-domain spectroscopy can be used to identify packaged samples with spectral fingerprints in the sub-terahertz frequency range. To further broaden the application of this system, the terahertz properties of other packaging materials, such as papers and fabrics, must be investigated.
Conclusion
One of the promising applications of terahertz waves is non-destructive testing. According to the findings, terahertz time-domain attenuated total reflection spectroscopy could be used to non-destructively detect samples packaged in a thin polyethylene bag based on their spectral fingerprints.
The penetration depth of the evanescent wave in the sub-terahertz frequency region is greater than the thickness of a typical plastic bag, enabling the absorption features of the sample to be obtained. This technique, according to the researchers, can be used to determine samples like medicine sachets in pharmacies to prevent medication errors.
Journal Reference
Hashimoto, K. & Tripathi, S. R. (2022) Non-Destructive Identification of Drugs in Plastic Packaging Using Attenuated Total Reflection Terahertz Time Domain Spectroscopy. Optics, 3(2), pp. 99–106. Available Online: https://www.mdpi.com/2673-3269/3/2/12/htm.
References and Further Reading
- Jepsen, P. U., et al. (2010) Terahertz Spectroscopy and Imaging—Modern Techniques and Applications. Laser & Photonics Reviews, 5, pp. 124–166. doi.org/10.1002/lpor.201000011.
- Ferguson, B & Zhang, X C (2002) Materials for Terahertz Science and Technology. Nature Materials, 1, pp. 26–33. doi.org/10.1038/nmat708.
- Kato, M., et al. (2016) Non-Destructive Drug Inspection in Covering Materials Using a Terahertz Spectral Imaging System with Injection-Seeded Terahertz Parametric Generation and Detection. Optics Express, 24, p. 6425. doi.org/10.1364/OE.24.006425.
- Kawase, K., et al. (2003) Non-Destructive Terahertz Imaging of Illicit Drugs Using Spectral Fingerprints. Optics Express, 11, p. 2549. doi.org/10.1364/OE.11.002549.
- Shen, Y. C., et al. (2005) Detection and Identification of Explosives Using Terahertz Pulsed Spectroscopic Imaging. Applied Physics Letters, 86, p. 241116. doi.org/10.1063/1.1946192.
- Neu, J & Schmuttenmaer, C A (2018) Tutorial: An Introduction to Terahertz Time Domain Spectroscopy (THz-TDS). Journal of Applied Physics, 124, p. 231101. doi.org/10.1063/1.5047659.
- Withayachumnankul, W& Naftaly, M (2013) Fundamentals of Measurement in Terahertz Time-Domain Spectroscopy. Journal of Infrared, Millimeter, and Terahertz Waves, 35, pp. 610–637. doi.org/10.1007/s10762-013-0042-z.
- Tripathi, S. R., et al. (2013) Accurate Complex Refractive Index with Standard Deviation of ZnTe Measured by Terahertz Time Domain Spectroscopy. Japanese Journal of Applied Physics, 52, p. 042401.
- Jordens, C (2008) Detection of Foreign Bodies in Chocolate with Pulsed Terahertz Spectroscopy. Optical Engineering, 47, p. 037003. doi.org/10.1117/1.2896597.
- Ok, G., et al. (2014) Foreign-Body Detection in Dry Food Using Continuous Sub-Terahertz Wave Imaging. Food Control, 42, pp. 284–289. doi.org/10.1016/j.foodcont.2014.02.021.
- Tripathi, S. R., et al. (2012) Measurement of Chloride Ion Concentration in Concrete Structures Using Terahertz Time Domain Spectroscopy (THz-TDS). Corrosion Science, 62, pp. 5–10. doi.org/10.1016/j.corsci.2012.05.005.
- Reid, M & Fedosejevs, R (2006) Terahertz Birefringence and Attenuation Properties of Wood and Paper. Applied Optics, 45, p. 2766. doi.org/10.1364/AO.45.002766.
- Saleh, B E A (2019) Fundamentals of Photonics; Wiley: Hoboken, NJ, USA.
- Withayachumnankul, W., et al. (2008) Uncertainty in Terahertz Time-Domain Spectroscopy Measurement. The Journal of the Optical Society of America B, 25, p. 1059. doi.org/10.1364/JOSAB.25.001059.
- Takagi, S., et al. (2020) Influence of Delay Stage Positioning Error on Signal-To-Noise Ratio, Dynamic Range, and Bandwidth of Terahertz Time-Domain Spectroscopy. Applied Optics, 59, p. 841. doi.org/10.1364/AO.378756.
- Nashima, S., et al. (2001) Measurement of Optical Properties of Highly Doped Silicon by Terahertz Time Domain Reflection Spectroscopy. Applied Physics Letters, 79, pp. 3923–3925. doi.org/10.1063/1.1413498.
- Vilagosh, Z., et al. (2021) Using Attenuated Total Reflection (ATR) Apparatus to Investigate the Temperature Dependent Dielectric Properties of Water, Ice, and Tissue-Representative Fats. Applied Sciences, 11, p. 2544. doi.org/10.3390/app11062544.
- Huang, Y., et al. (2020) Attenuated Total Reflection for Terahertz Modulation, Sensing, Spectroscopy and Imaging Applications: A Review. Applied Sciences, 10, p. 4688. doi.org/10.3390/app10144688.
- Ryu, M., et al. (2021) Attenuated Total Reflection at THz Wavelengths: Prospective Use of Total Internal Reflection and Polariscopy. Applied Sciences, 11, p. 7632. doi.org/10.3390/app11167632.
- Hirori, H., et al. (2004) Attenuated Total Reflection Spectroscopy in Time Domain Using Terahertz Coherent Pulses. Japanese Journal of Applied Physics, 43, pp. L1287–L1289.
- Tripathi, S. R., et al. (2013) Non-Destructive Inspection of Chloride Ion in Concrete Structures Using Attenuated Total Reflection of Millimeter Waves. Journal of Infrared, Millimeter, and Terahertz Waves, 34, pp. 181–186. doi.org/10.1007/s10762-013-9955-9.
- Nagai, M., et al. (2007) Terahertz Time-Domain Attenuated Total Reflection Spectroscopy in Water and Biological Solution. International Journal of Infrared and Millimeter Waves, 27, pp. 505–515. doi.org/10.1007/s10762-006-9098-3.
- Mendoza-Galvan, A., et al. (2021) Effective Absorption Coefficient and Effective Thickness in Attenuated Total Reflection Spectroscopy. Optics Letters, 46, p. 872. doi.org/10.1364/OL.418277.
- Brown, E. R., et al. (2007) On the Strong and Narrow Absorption Signature in Lactose at 0.53 THz. Applied Physics Letters, 90, p. 061908. doi.org/10.1063/1.2437107.
- James, K.L., et al. (2009) Incidence, Type and Causes of Dispensing Errors: A Review of the Literature. The International Journal of Pharmacy Practice, 17, pp. 9–30. doi.org/10.1211/ijpp.17.1.0004.
- Poon, E.G., et al. (2006) Medication Dispensing Errors and Potential Adverse Drug Events before and after Implementing Bar Code Technology in the Pharmacy. Annals of Internal Medicine, 145, p. 426. doi.org/10.7326/0003-4819-145-6-200609190-00006.
- Dai, J., et al. (2004) Terahertz Time-Domain Spectroscopy Characterization of the Far-Infrared Absorption and Index of Refraction of High-Resistivity, Float-Zone Silicon. The Journal of the Optical Society of America B, 21, p. 1379. doi.org/10.1364/JOSAB.21.001379.
- Hecht, E (1998) Optics. Hecht; Addison-Wesley: Reading, MA, USA.
- Kaushik, M., et al. (2012) Reduction of Scattering Effects in THz-TDS Signals. IEEE Photonics Technology Letters, 24, pp. 155–157. doi.org/10.1109/LPT.2011.2174980.
- Jin, Y.S., et al. (2006) Terahertz Dielectric Properties of Polymers. Journal of the Korean Physical Society, 49, pp. 513–517.
- Nakanishi, A., et al. (2012) Terahertz Time Domain Attenuated Total Reflection Spectroscopy with an Integrated Prism System. Review of Scientific Instruments, 83, p. 033103. doi.org/10.1063/1.3692743.
- Soltani, A., et al. (2016) Attenuated Total Reflection Terahertz Time-Domain Spectroscopy: Uncertainty Analysis and Reduction Scheme. IEEE Transactions on Terahertz Science and Technology, 6, pp. 32–39. doi.org/10.1109/TTHZ.2015.2505909.
- Soltani, A., et al. (2014) Error from Delay Drift in Terahertz Attenuated Total Reflection Spectroscopy. Journal of Infrared, Millimeter, and Terahertz Waves, 35, pp. 468–477. doi.org/10.1007/s10762-014-0054-3.
- Davies, A.G., et al. (2008) Terahertz Spectroscopy of Explosives and Drugs. Materials Today, 11, pp. 18–26. doi.org/10.1016/S1369-7021(08)70016-6.