 By Owais AliReviewed by Lexie CornerMay 29 2025
Nuclear Magnetic Resonance (NMR) spectroscopy is an analytical technique used to determine the structural composition of organic compounds by analyzing the interactions between atomic nuclei and an external magnetic field.
It provides information on the chemical environment of nuclei, enabling identification of molecular structures and dynamics.
This article provides a comprehensive guide to interpreting NMR spectroscopy data, ensuring accurate structural elucidation and molecular characterization.

Image Credit: S. Singha/Shutterstock.com
Understanding the NMR Spectrum
The NMR spectrum (¹H-NMR and ¹³C-NMR) is a graphical representation of nuclear resonance signals, with chemical shift (ppm) on the x-axis indicating the electronic environment of nuclei, the y-axis showing signal intensity, and peaks corresponding to specific nuclear environments within the molecule.
X-axis (Chemical Shift)
The x-axis of the NMR spectrum represents the chemical shift, expressed in parts per million (ppm). It indicates the resonance frequency of nuclei relative to a reference standard, in which tetramethylsilane (TMS) is set at zero ppm.
Chemical shifts are independent of magnetic field strength, allowing spectra to be compared across different instruments.
Higher chemical shift values (downfield, left) correspond to nuclei experiencing decreased electron density and greater deshielding. Lower values (upfield, right) indicate increased electron density and greater shielding from the external magnetic field.1
Y-axis (Signal Intensity)
The y-axis displays the intensity of detected signals, corresponding to the number of nuclei producing each signal. This intensity forms the basis for integration, enabling quantitative analysis of the relative number of nuclei contributing to each peak, a critical factor in determining molecular composition and verifying structural assignments.
In modern Fourier-transform NMR (FT-NMR) instruments, signal intensity is presented in arbitrary units, with the vertical scale adjusted to optimize peak visualization.
Signals and Their Appearance
Peaks in an NMR spectrum correspond to distinct nuclear environments within the molecule, with each unique chemical environment producing a characteristic signal. These signals differ in chemical shift, intensity, and splitting pattern depending on the electronic environment, number of equivalent nuclei, and coupling interactions with adjacent nuclei.
The appearance of NMR signals depends upon relaxation properties, coupling constants, and magnetic field homogeneity. Well-resolved spectra produce sharp, distinct peaks that facilitate accurate structural analysis of complex molecules in various scientific disciplines.2
Download your PDF copy now!
1H-NMR and 13C-NMR Spectra
NMR spectroscopy primarily produces two types of spectra: ¹H-NMR and ¹³C-NMR.
The ¹H-NMR spectrum analyzes hydrogen nuclei (protons) within a molecule, providing detailed information about the number, chemical environment, and connectivity of hydrogen atoms.
In contrast, the ¹³C-NMR spectrum focuses on carbon-13 nuclei, revealing the number and types of distinct carbon environments, which aids in determining the molecular carbon framework.
¹H-NMR chemical shifts typically range from 0 to 14 ppm, while ¹³C-NMR chemical shifts span a broader range, generally from 10 to 220 ppm. This expanded dispersion in ¹³C-NMR results from the differing Larmor frequencies of nuclei, which depend on their respective magnetogyric ratios, and yields enhanced resolution with reduced peak overlap.
¹³C-NMR and ¹H-NMR are used together for complete structural elucidation and molecular characterization.3
How to Read and Interpret NMR Spectra?
1H-NMR Spectra
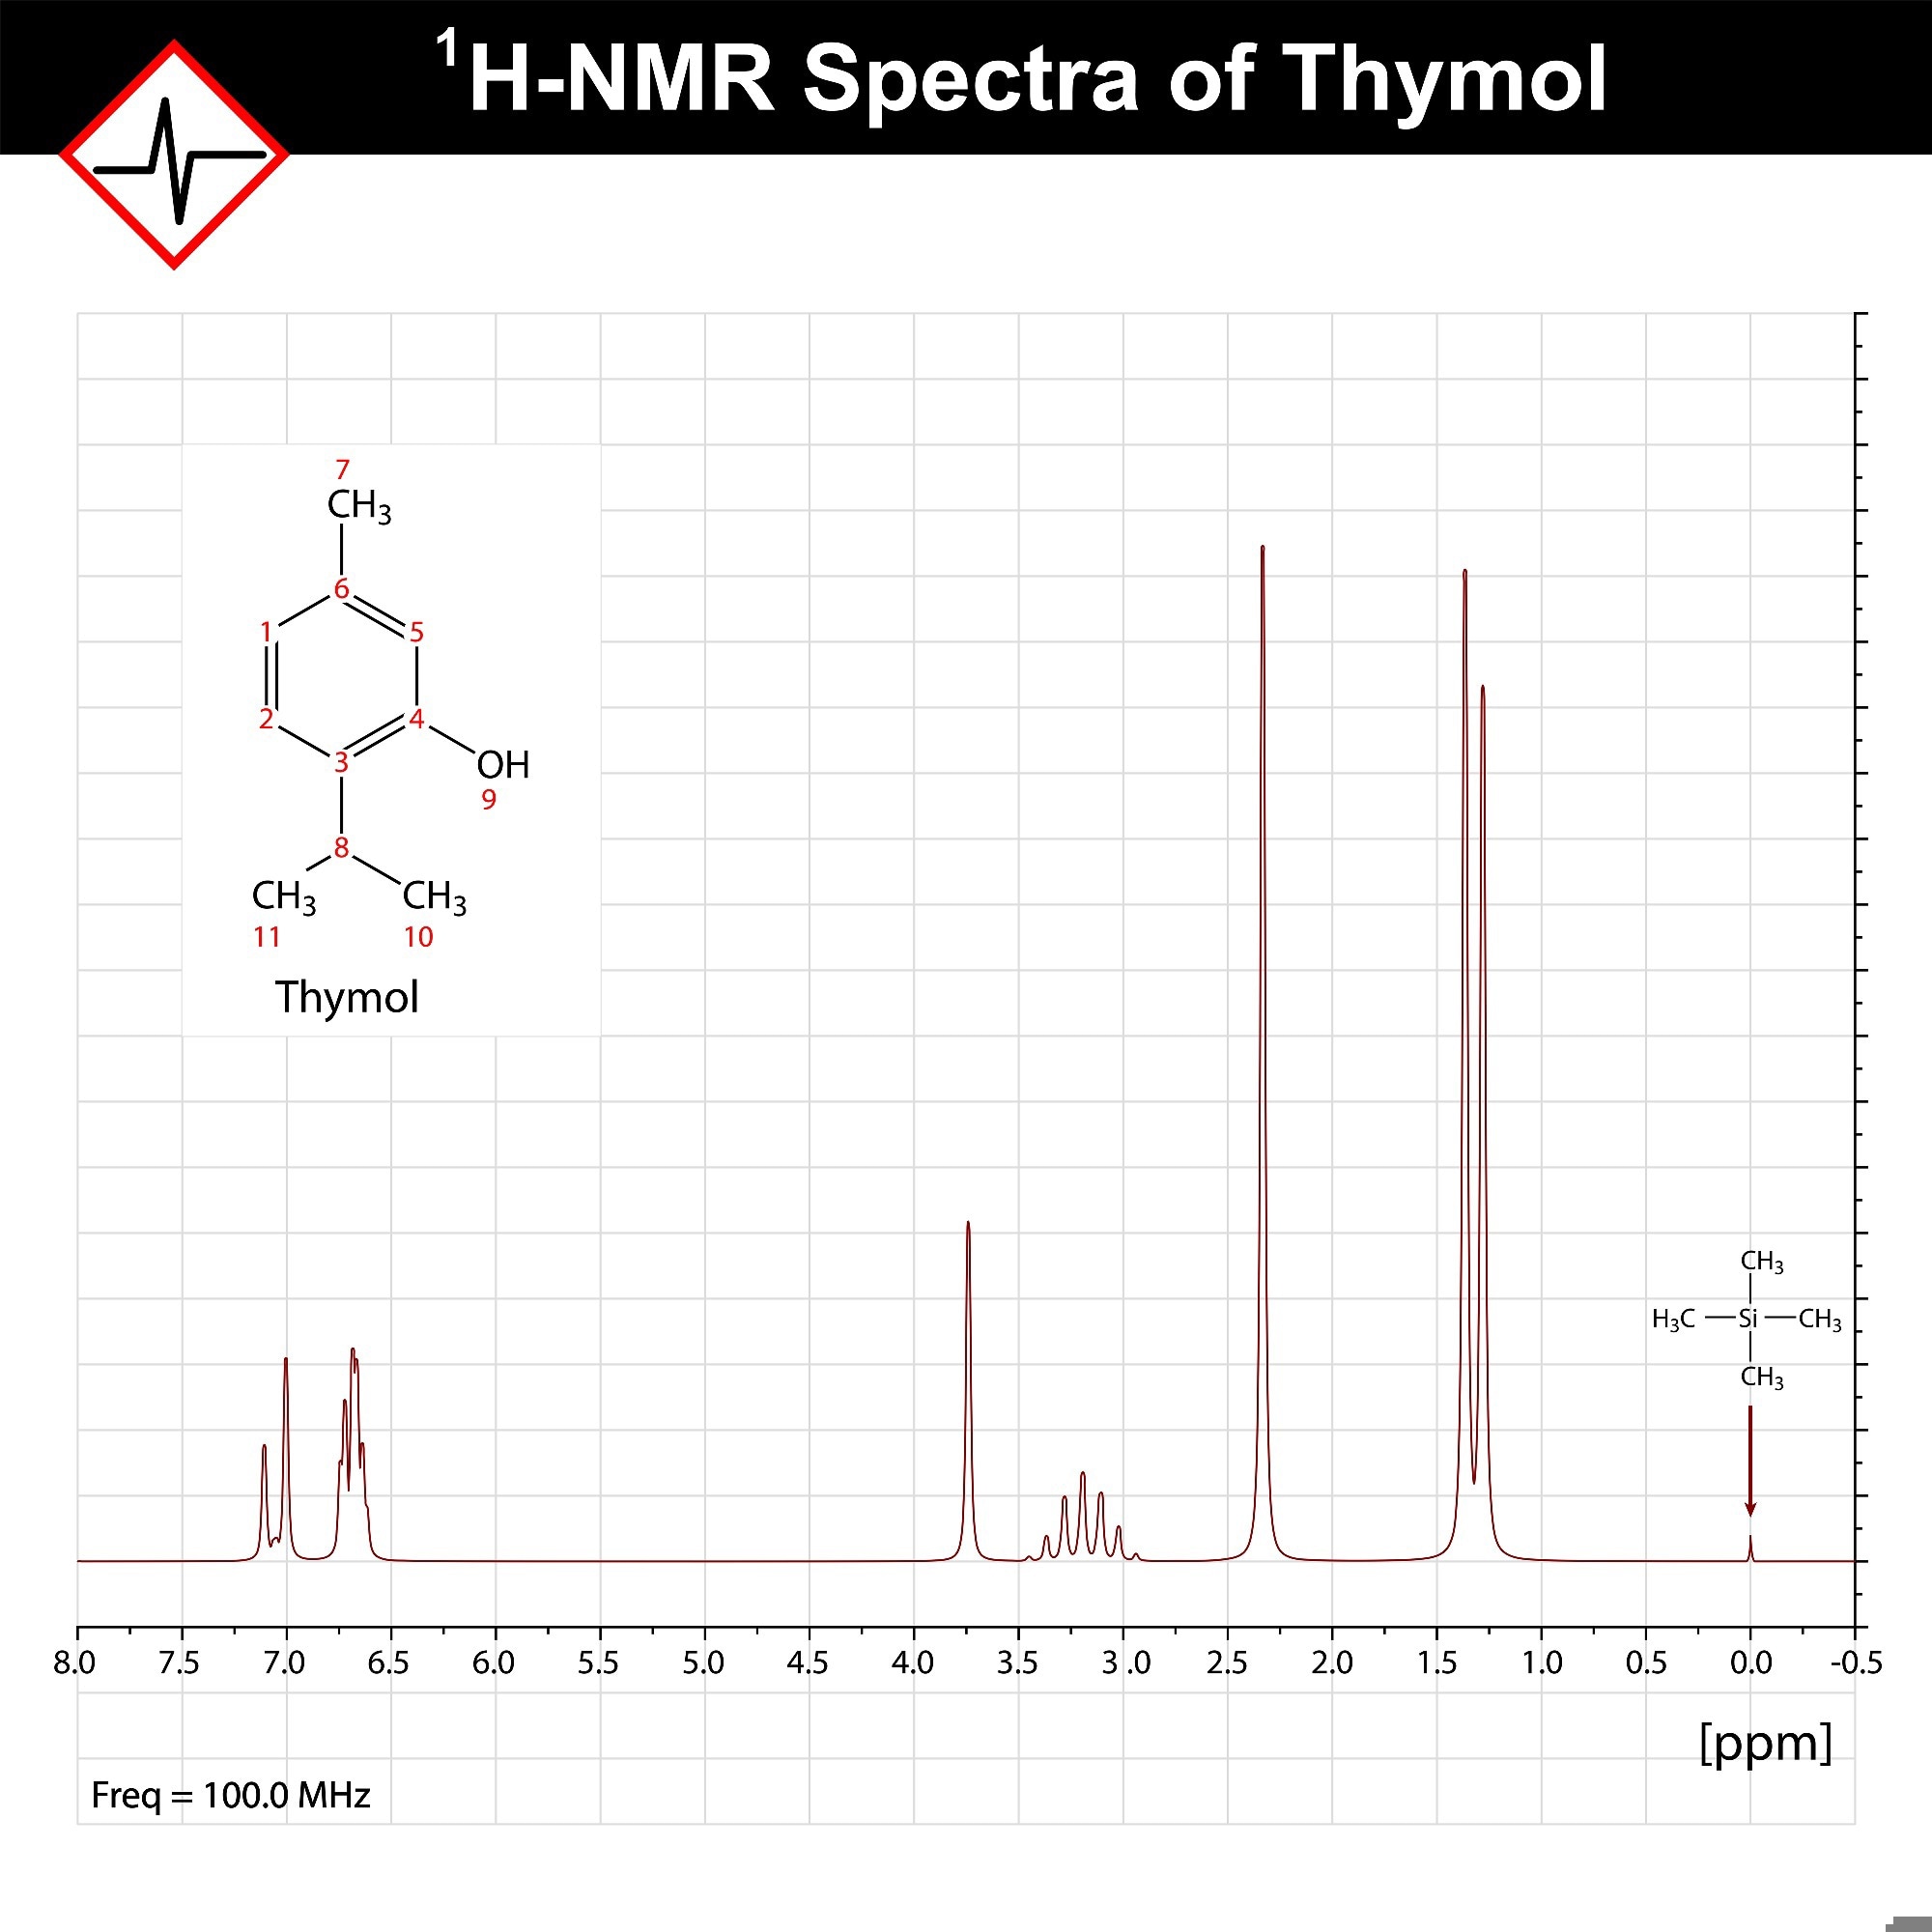
¹H-NMR Spectrum of Thymol. ¹H-NMR spectrum of thymol (100 MHz) showing characteristic peaks for aromatic protons (δ 6.6–7.2 ppm), a benzylic methylene group (~2.3 ppm), aliphatic methyl groups (~0.9–1.3 ppm), and the reference TMS peak at 0.00 ppm. Peak splitting reflects proton coupling in the molecule. Image Credit: chromatos/Shutterstock.com
Step 1: Count the Number of Signals
The number of distinct signals in a ¹H-NMR spectrum corresponds to the number of chemically non-equivalent hydrogen environments in the molecule. Each signal represents a group of protons experiencing a unique electronic environment.
For example, in p-cymene, equivalent CH and CH₃ groups generate a single signal for each group, leading to five peaks in the spectrum.
Step 2: Interpret the Integration Values
After identifying the number of signals, the integration values are examined to determine the relative number of protons associated with each signal.
Integration represents the area under each peak and is proportional to the number of hydrogens giving rise to that signal. These values are displayed as step curves or numerical ratios, where a larger step height indicates more protons.
For instance, a signal with a 3:1 ratio relative to another implies three protons in one environment and one in another.
Step 3: Assess the Chemical Shift Values (δ)
With the quantity of each proton type established, the chemical shift positions of the signals are assessed to determine their electronic environments.
Shielded protons in electron-dense regions appear upfield at lower δ values, whereas deshielded protons, affected by electronegative atoms or π-systems, appear downfield at higher δ values. For example, alkyl protons generally occur at 0.9–2 ppm, while aromatic protons appear between 7 and 8 ppm.
Step 4: Determine the Splitting Patterns (Multiplicity)
The multiplicity of each signal is examined to assess the number of adjacent, non-equivalent protons. This analysis is based on the n+1 rule, where a proton with n neighboring protons produces a signal split into n+1 peaks. The resulting patterns appear as singlets (no neighbors), doublets (one neighbor), triplets (two neighbors), quartets (three neighbors), or more complex multiplets.
For example, a triplet appearing in the spectrum suggests that the proton being observed has two neighboring protons, such as in a –CH₂– group adjacent to a –CH₃.
Step 5: Analyze Coupling Constants (J Values)
Once multiplicity is determined, the coupling constants are measured to gain further insight into proton–proton interactions and molecular geometry. The J value (Hz) represents the spacing between split peaks in a multiplet and depends on the type and orientation of the bonded atoms.
For instance, trans-vinylic protons typically exhibit J values between 12–18 Hz, while cis-vinylic protons range from 6–11 Hz. These measurements help distinguish stereochemical relationships and positional isomerism.1
Step 6: Deduce the Molecular Structure
Finally, all spectral features—number of signals, integration, chemical shifts, multiplicities, and coupling constants—are analyzed collectively to reconstruct the molecular structure.
This systematic approach enables the identification of specific proton environments and their connectivity, leading to a complete structural interpretation of the compound.3,4
13C-NMR Spectra
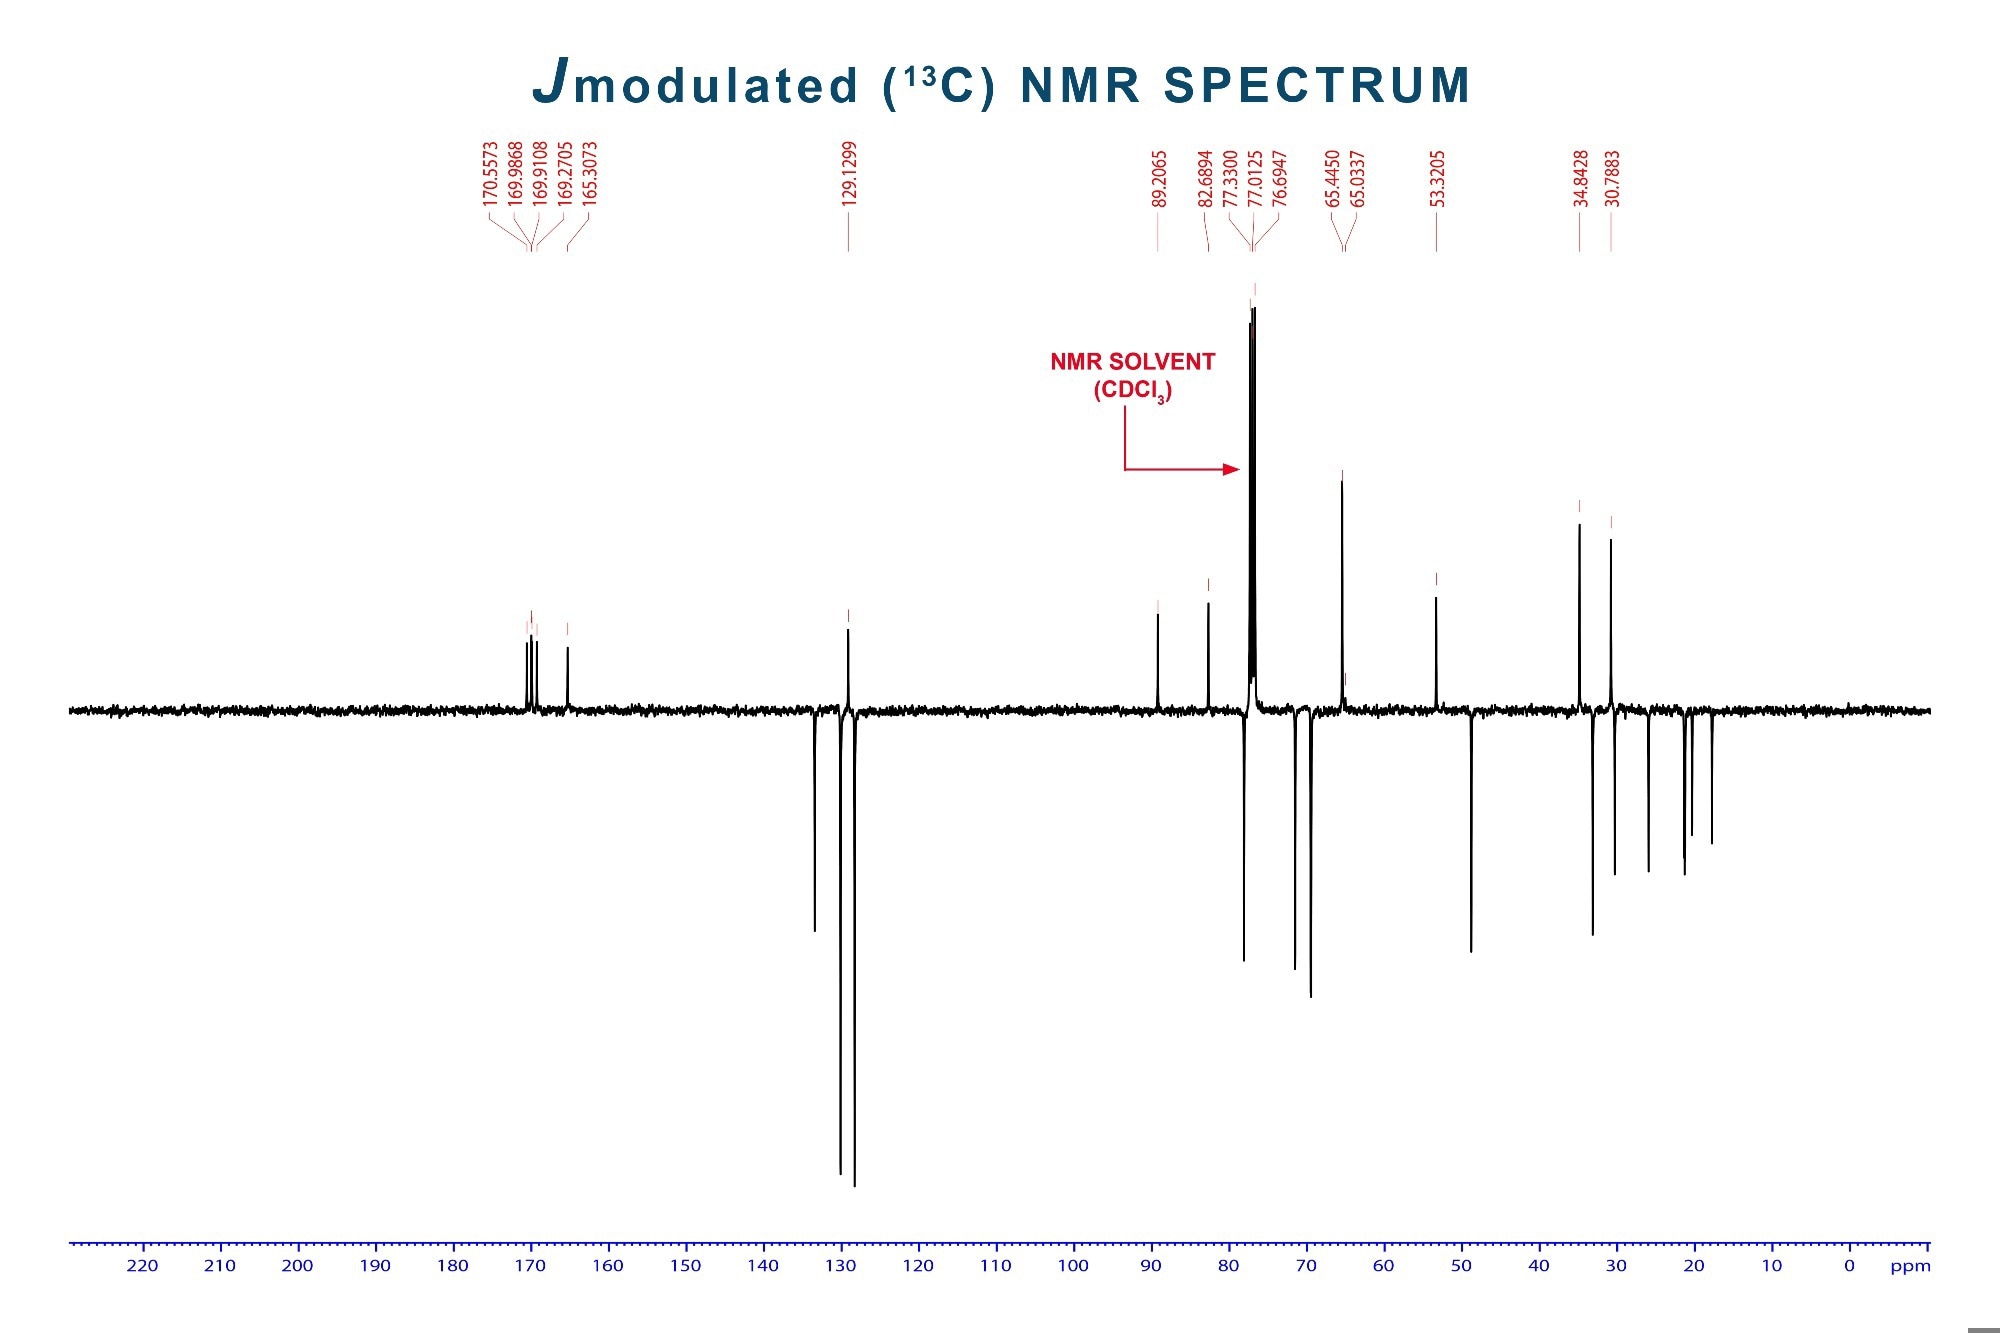
J-modulated ¹³C-NMR spectrum showing carbon environments across the chemical shift range (0–220 ppm). The solvent peak from CDCl₃ appears near 77 ppm. Peaks typically appear as singlets due to broadband decoupling, allowing identification of distinct carbon types. Image Credit: S. Singha/Shutterstock.com
The steps for interpreting a ¹³C-NMR spectrum are almost similar to those for ¹H-NMR analysis. However, ¹³C-NMR focuses on carbon environments and typically shows singlet peaks due to broadband proton decoupling, resulting in less complex splitting patterns.
Step 1: Identification of Signal Number
The number of signals in the ¹³C-NMR spectrum indicates the number of chemically distinct carbon environments in the molecule.
Carbons sharing the same chemical environment produce a single peak, while unique environments generate separate signals. For instance, pentane-2,4-dione shows three peaks corresponding to five carbon atoms because two carbons are equivalent.
Step 2: Measurement of Chemical Shift Values
Chemical shift values (δ) are measured for each signal to assess the electronic environment of the carbon atoms. These values are compared against reference tables to predict or assign carbon types such as alkyl, carbonyl, or aromatic carbons.
Step 3: Structural Deduction
The molecular structure is determined by examining the number of signals and their chemical shift values. Counting the distinct carbon environments helps confirm the molecular formula, while comparing the shifts to reference data helps identify specific parts of the molecule and assemble them into the complete structure.3,4
Common Mistakes and Troubleshooting in NMR Spectroscopy
Signal Assignment Errors
Incorrect signal assignment frequently causes structural misinterpretation. Overlapping chemical shifts, particularly in regions such as 1.0–2.5 ppm or aromatic zones with complex splitting patterns, often lead to confusion.
To minimize errors, distinct signals—such as methyl singlets or aldehydic protons—are identified first, followed by systematic spectral analysis. The two-dimensional NMR techniques, including COSY and HSQC, further help confirm connectivity and resolve ambiguous assignments.
Integration Misinterpretation
Accurate integration is essential for reliable structural analysis, but inadequate relaxation delays between pulses can compromise results. This can lead to saturation effects, particularly affecting nuclei with long relaxation times, such as quaternary carbons, resulting in inaccurate quantification.
To prevent this, acquisition parameters should include relaxation delays longer than five times the T₁ value of the slowest-relaxing nuclei.
Additionally, exchangeable protons may show variable integration due to solvent interactions or partial deuterium exchange, requiring careful interpretation to avoid misassignments.
Spectral Processing Issues
Improper spectral processing introduces artifacts that compromise accurate interpretation. Incorrect phasing leads to asymmetric or inverted peaks, while inadequate baseline correction generates artificial signals, distorting integration and hindering structural assignments.
Careful phase and baseline correction adjustment is essential to preserve genuine spectral features and ensure reliable data, especially for broad or overlapping signals.
Sample Preparation Problems
Sample quality directly impacts the reliability of NMR data. Low sample concentration reduces the signal-to-noise ratio, causing weak signals to be lost, whereas high concentration increases viscosity, leading to line broadening and distorted coupling patterns. Ensuring optimal spectral quality requires using high-purity samples dissolved in degassed deuterated solvents and applying filtration as necessary.2
Accurate interpretation of NMR spectra requires a systematic analysis of spectral parameters to reliably determine molecular structure. Following proper acquisition and processing protocols is essential to maintain data integrity and ensure precise structural assignments.
For a detailed walkthrough of NMR spectroscopy, watch:
NMR Spectroscopy for Visual Learners
References and Further Reading
- Pavan, M. V., & Barron, A. R. (n.d.). NMR spectroscopy. LibreTexts. https://chem.libretexts.org/Bookshelves/Analytical_Chemistry/Physical_Methods_in_Chemistry_and_Nano_Science_(Barron)/04%3A_Chemical_Speciation/4.07%3A_NMR_Spectroscopy
- Zamora Carreras, H. (2024). NMR spectroscopy principles, interpreting an NMR spectrum and common problems. Technology Networks. https://www.technologynetworks.com/analysis/articles/nmr-spectroscopy-principles-interpreting-an-nmr-spectrum-and-common-problems-355891#D3
- Gunawan, R., & Nandiyanto, A. B. D. (2021). How to read and interpret ¹H-NMR and ¹³C-NMR spectrums. Indonesian Journal of Science and Technology, 6(2), 267–298. https://doi.org/10.17509/ijost.v6i2.34189
- Reusch, W. (2013). Nuclear magnetic resonance spectroscopy. Michigan State University. https://www2.chemistry.msu.edu/faculty/reusch/virttxtjml/spectrpy/nmr/nmr1.htm
Disclaimer: The views expressed here are those of the author expressed in their private capacity and do not necessarily represent the views of AZoM.com Limited T/A AZoNetwork the owner and operator of this website. This disclaimer forms part of the Terms and conditions of use of this website.