Laser speckle correlation offers a non-invasive technique to measure the viscosity of fluids important in biological matter and material characterization.
Image Credit: Photobank gallery/Shutterstock.com
Changes in tissue structure and biological fluid viscosity are diagnostic evidence of certain diseases. Tracking those changes non-invasively enables early detection and is of great importance in the medical field. Rheology, the study of material deformation, has a significant impact on the manufacturing industry and greatly benefits from non-invasive viscoelasticity measurements.
Viscosity Measurement Methods
Several experimental techniques are applied to measure the viscous properties of materials. For example, measurements are carried out using optical, acoustic, and mechanical tools.
Materials that exhibit viscous properties described as Newtonian fluids to perfectly elastic behavior of Hookean solids can be characterized by the various rheological methods.
Measurement methods based on optical scattering are particularly attractive because of their experimental simplicity. It can also be implemented in high-pressure, harsh environments where high temperatures have to be tolerated.
Dynamic, direct light-scattering (DLS) is a technique for measuring viscosity at high pressures.
Depending on the structure of some samples, the DLS method was found to have challenging restrictions due to multiple scattering from sample structures that interfered with the measurement’s accuracy.
Laser Speckle Imaging
Laser speckle is the random granular pattern reflected onto a screen when a laser beam is shone on a rough surface.
The speckle pattern is formed as a result of multiple interferences from different reflected laser beams. The beams arriving at the screen have random relative optical phases. Every minor change that occurs on the surface, such as the illuminated spot, can alter the detailed speckle pattern.
Laser illumination of the sample for which viscosity has to be determined is set up as shown in figure 1. A CCD camera, capable of variable exposure times, is aligned as depicted in figure 1 to capture the speckle pattern. The inset of figure 1 shows how a typical speckle image looks.
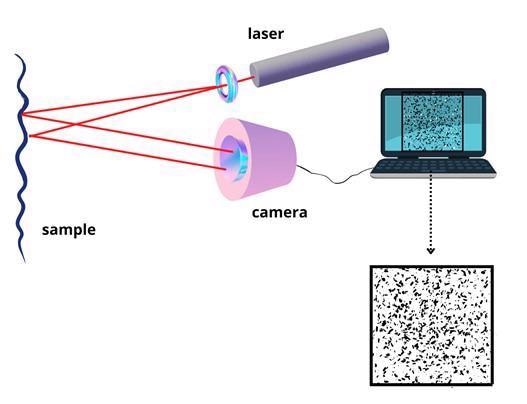
Figure 1: Schematic illustrations showing a basic laser speckle imaging set-up. Inset - How a speckle image pattern might look. Image Credit: Ilamaran Sivarajah
Once the correlation of the initial image is calibrated, minor changes are applied to the sample. For example, to change the Brownian motion and thereby detect thermal effects, the sample is heated while monitoring the spackle image.
Different amounts of external compounds can be added to the solution to increase or decrease its viscosity.
A series of speckle patterns are taken for every experimental condition.
Image processing of all the captures is carried out using displacement gradient data of every point of the object.
The fluctuations in the speckle image is tracked by spatial averaging over multiple exposure times afforded by the camera. By adjusting the image’s exposure times and acquisition rate, different viscosity levels and variations can be measured.
Image Analysis
Images can be analyzed based on the temporal and spatial data acquired. For temporal analysis, the number of frames per second is varied. Speckle image pixels are averaged as a function of time as the correlation reflects time variations in the speckle activity. Liquids with low viscosities require fast frame rates to accurately calculate their viscosity.
For the spatial analysis, the spatial contrast of each image is computed while varying the exposure time. Image contrast is calculated as the ratio between the intensity standard deviation and the mean intensity of the speckle pattern.
Outlook
A standard low-cost camera without high-speed tracking capabilities can be used to calculate low viscosities using spatial contrast techniques. This can be used to develop commercial viscosity sensors for many applications such as in industrial settings with challenging operational conditions imposed by temperature or pressure. It can also be useful for the detection of diseases causing changes in the constitution of biological fluids.
References and Further Reading
J. Senarathna, A. Rege, N. Li and N. V. Thakor, "Laser Speckle Contrast Imaging: Theory, Instrumentation and Applications," in IEEE Reviews in Biomedical Engineering, vol. 6, pp. 99-110, 2013, doi: 10.1109/RBME.2013.2243140.
David A. Boas, Andrew K. Dunn, "Laser speckle contrast imaging in biomedical optics," J. Biomed. Opt. 15(1) 011109 (1 January 2010) https://doi.org/10.1117/1.3285504
Christelle Abou Nader, Fabrice Pellen, Philippe Roquefort, Thierry Aubry, Bernard Le Jeune, Guy Le Brun, and Marie Abboud, "Evaluation of low viscosity variations in fluids using temporal and spatial analysis of the speckle pattern," Opt. Lett. 41, 2521-2524 (2016)
Postnov DD, Moller F, Sosnovtseva O. Dairy products viscosity estimated by laser speckle correlation. PLoS One. 2018 Sep 7;13(9):e0203141. doi: 10.1371/journal.pone.0203141. PMID: 30192885; PMCID: PMC6128542.
Disclaimer: The views expressed here are those of the author expressed in their private capacity and do not necessarily represent the views of AZoM.com Limited T/A AZoNetwork the owner and operator of this website. This disclaimer forms part of the Terms and conditions of use of this website.