High-performance X-ray optics are required for the non-invasive examination of the inner structure and elemental composition of matter at the micro-and nanoscale using X-ray technologies. Various types of reflecting, refractive, and diffractive optical elements have been created for this purpose over the previous few decades. This article will look at new research published in Nature Communications describing the development of an achromatic X-ray lens and its benefits.
Image Credit: Studio Peace/Shutterstock.com
Reflective X-ray optics use grazing incidence and complex geometries to produce a magnified image of an expanded field of vision, which results in long focal lengths that are inconsistent with a compressed setup.
Chester Moor Hall devised a method of dealing with chromaticity in the mid-eighteenth century by stacking a focusing lens made of crown glass and a defocusing lens made of flint glass to make an achromatic doublet.
Despite the significant chromaticity of each individual lens, a correct combination of the two lenses offered similar focal lengths for two distinct wavelengths and reduced chromatic aberration over the wavelength range between them, owing to the larger dispersion of flint glass than crown glass.
In contrast, chromaticity scales differently for refractive and diffractive X-ray lenses, which brings up the fundamental option of merging them to account for chromatic aberration and construct an X-ray achromat, as illustrated in Figure 1a.
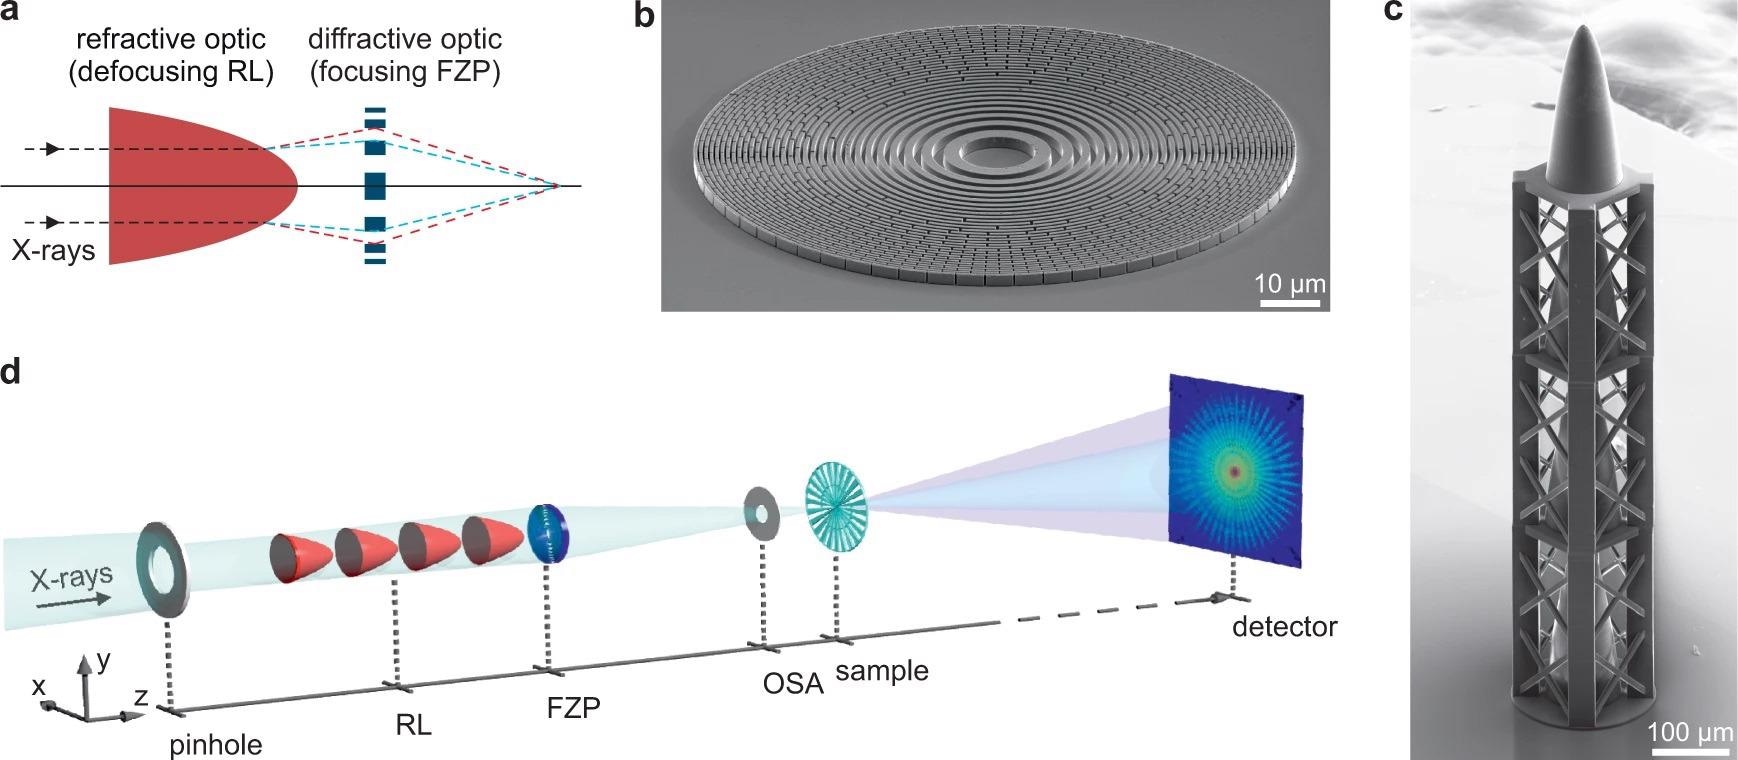
Figure 1. Concept of the X-ray achromat and experimental setup. a principle of achromatic focusing: The chromaticity of the defocusing refractive lens (RL) acts as a corrector for the chromatic behavior of the focusing Fresnel zone plate (FZP). b Scanning electron microscopy (SEM) image of a nickel FZP fabricated by electron-beam lithography and nickel electroplating, as used for the comparison measurements. c SEM image of the RL consisting of four stacked paraboloids 3D-printed using two-photon polymerization lithography. d Sketch of the experimental setup for scanning transmission X-ray microscopy (STXM) and ptychography using the achromat as a focusing optic. Image Credit: Kubec, et al., 2022
Results and Discussion
An FZP was created using electron-beam lithography and nickel electroplating, and a 3D-printed RL was made using two-photon polymerization in the described X-ray achromat. With the experimental setup depicted in Figure 1d, the achromat was mounted as a focusing optic at the Swiss Light Source’s cSAXS beamline.
Instead of using the achromat, reference measurements were made with a regular FZP (as indicated in Figure 1b). The numerical aperture of both optics was the same, restricting the attainable spot size to roughly 500 nm.
The STXM pictures of the Siemens star test sample displayed in Figure 2b were collected with the achromat as a focusing optic at various X-ray energy, as indicated in Figure 2a.
When analyzing the achromat’s performance to STXM data acquired using the FZP as an optical element, the achromat’s huge advantage becomes obvious (as shown in Figure 2c).
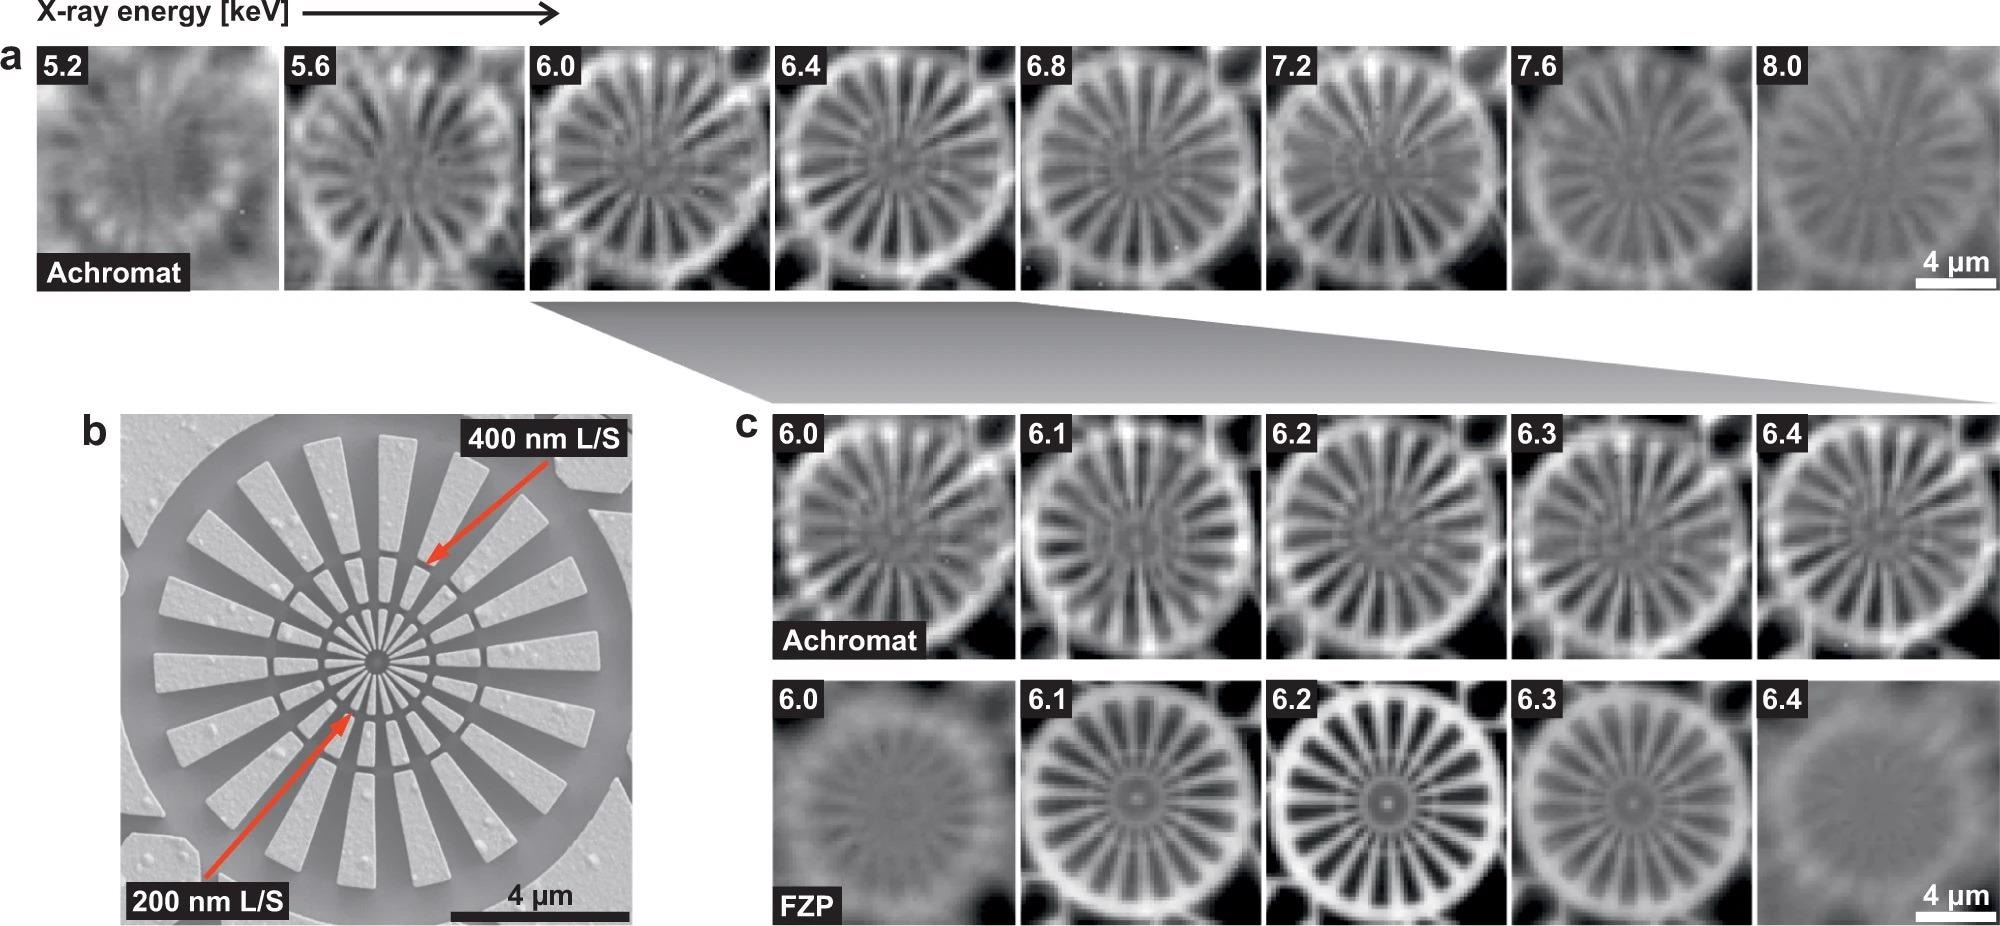
Figure 2. Demonstration of STXM imaging at different energies using the achromat. a STXM images of the Siemens star sample shown in panel b obtained with the achromat, indicating an achromatic range of > 1 keV around the optimum energy of ~ 6.4 keV. b SEM image of the Siemens star test sample. The radial lines and spaces (L/S) at the outer and inner concentric rings have widths of 400 nm and 200 nm, respectively, see red arrows. c Comparison of the STXM results in the energy range of 6.0 keV to 6.4 keV obtained with the achromat (top) and the conventional FZP (bottom). While the contrast of the FZP images changes rapidly with the energy, the image quality achieved with the achromat varies only little. Image Credit: Kubec, et al., 2022
Figure 3a shows cuts across the caustics of the achromat in the xz plane (Figure 1d), with the focus position indicated by a red dashed line. Figure 3b suggests a clear comparison of the caustics acquired with the achromat and the FZP, confirming the achromat’s large gain in the achromatic range, as seen in the STXM photos in Figure 2.
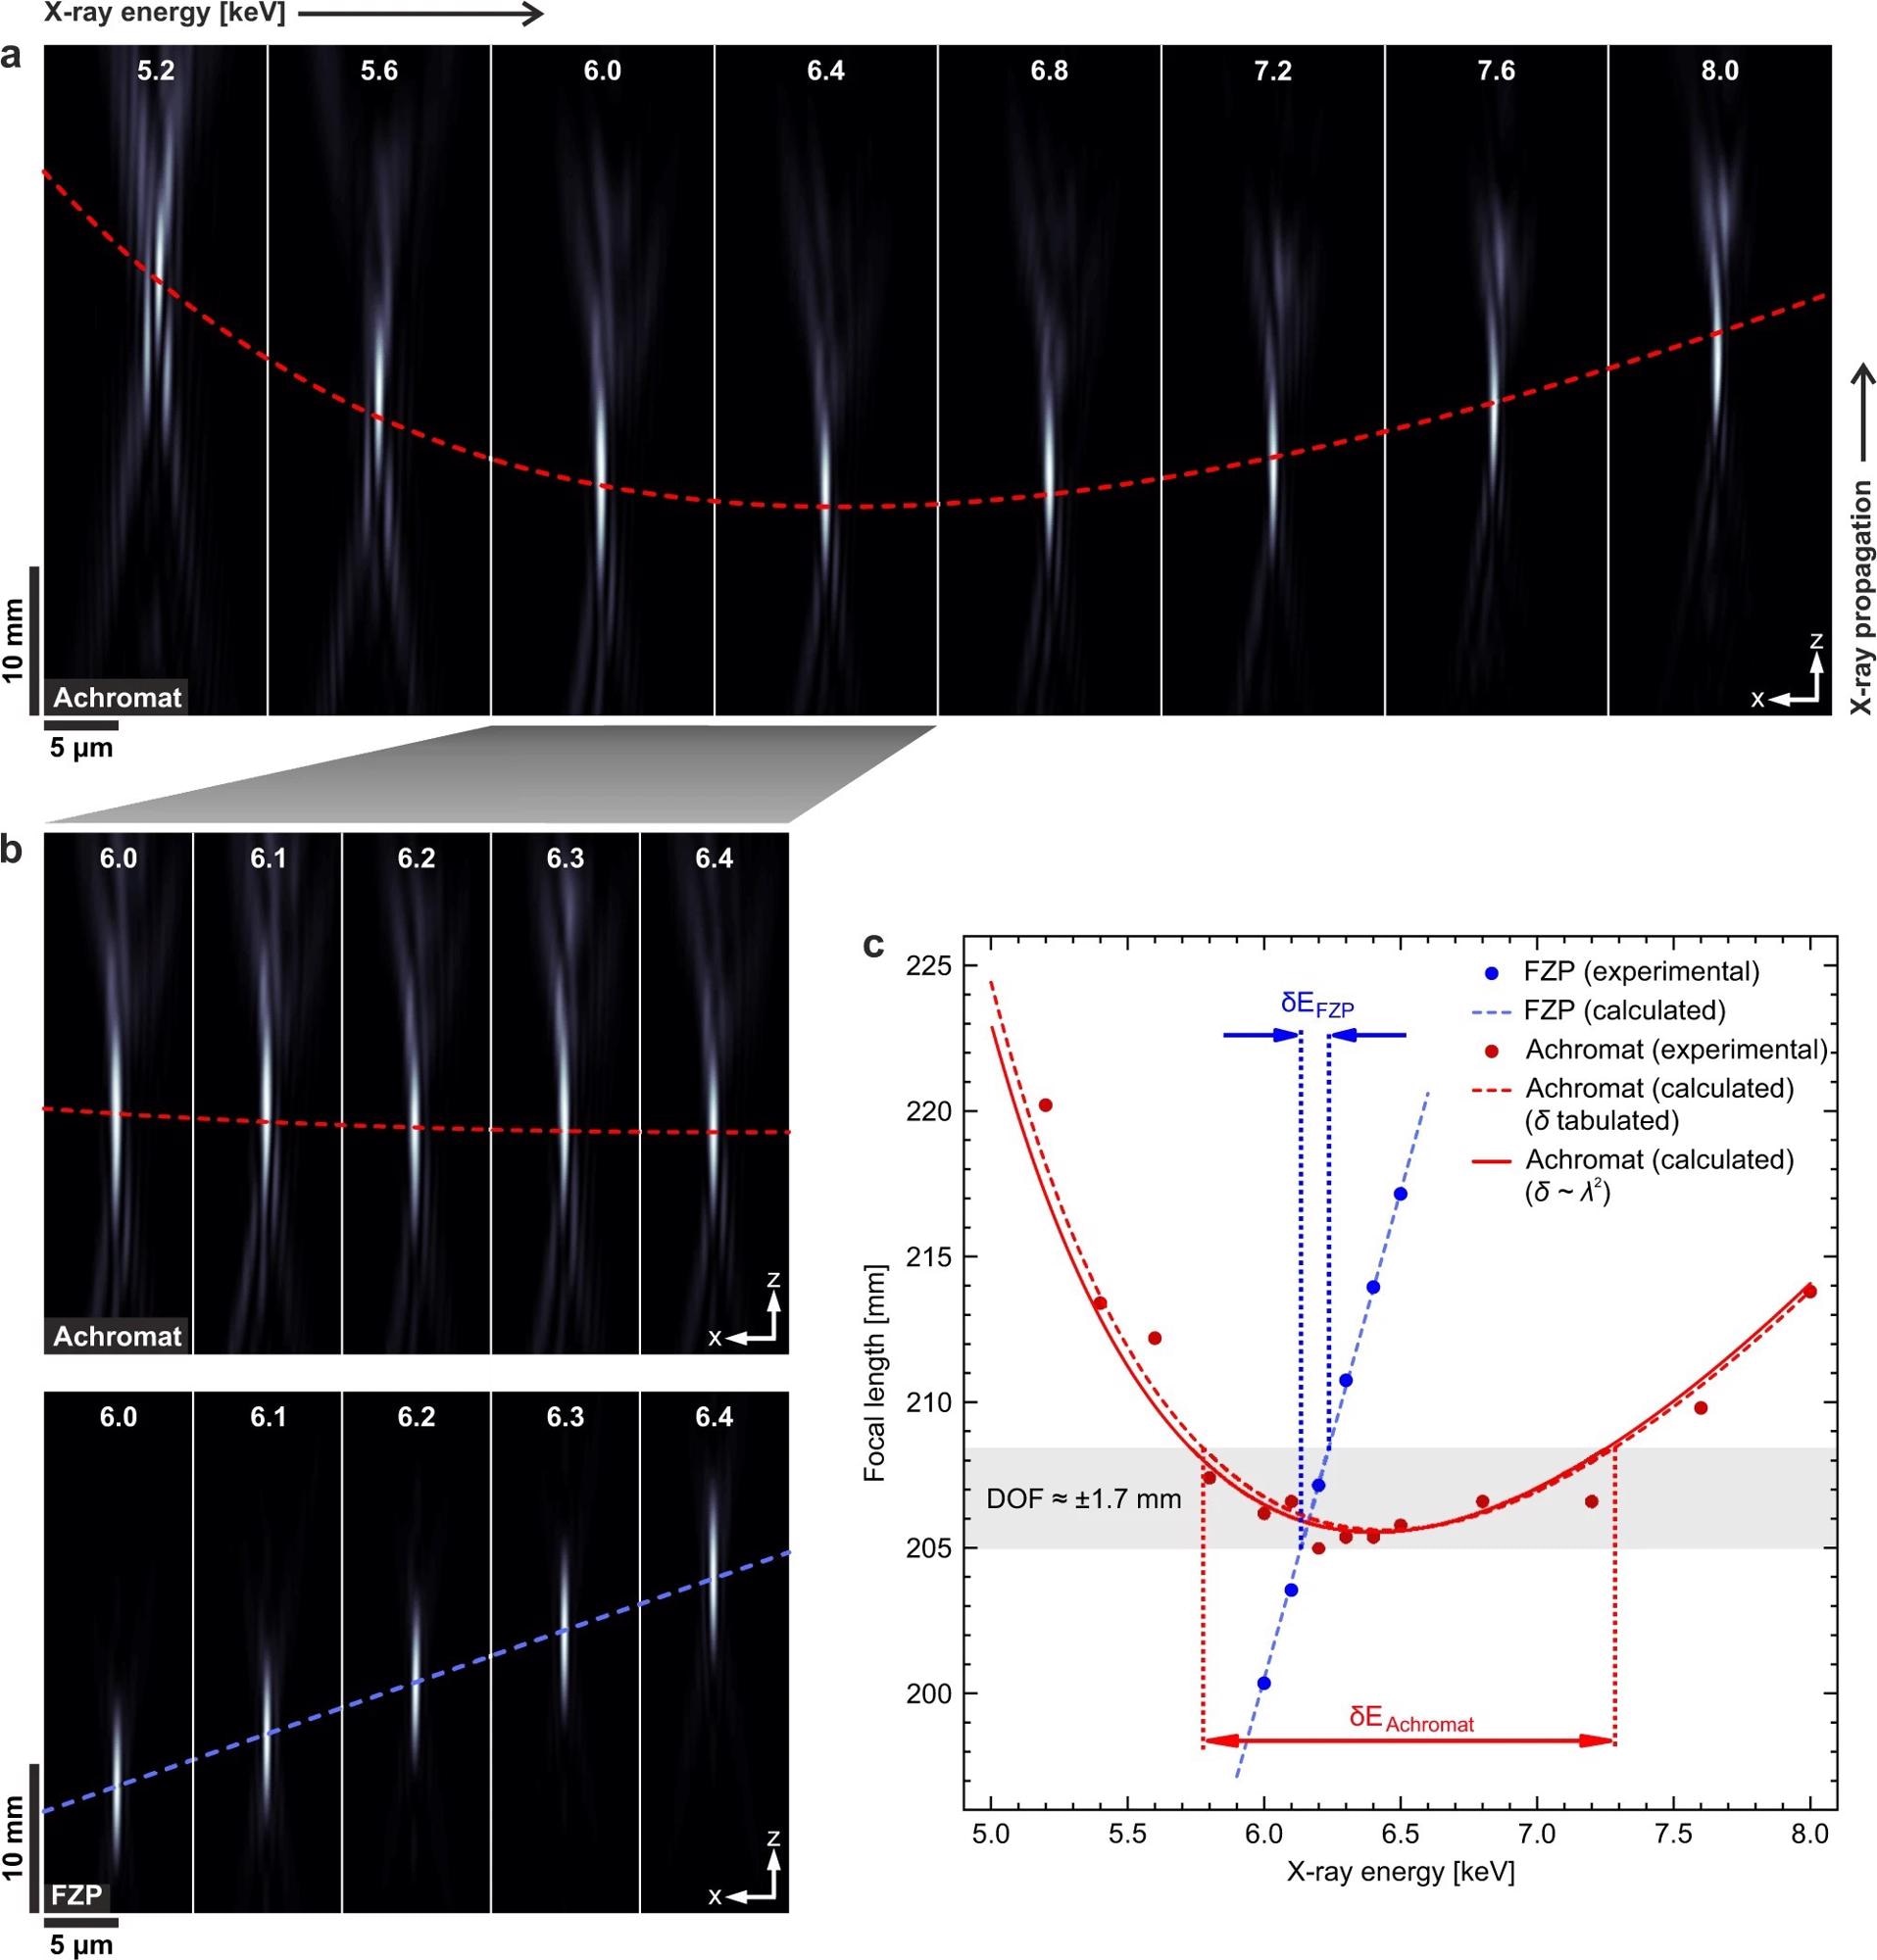
Figure 3. Evolution of the X-ray beam profile with the energy measured with ptychography. a Caustics at energies from 5.2 keV to 8.0 keV obtained with the achromat. The red dashed line indicates the location of the focal plane at the different energies. b Comparison of the caustics obtained with the achromat and the FZP. While the position of the focal plane remains almost constant with the energy for the achromat (red dashed line), it changes rapidly for the FZP (blue dashed line). c Calculated curves (solid and dashed lines) and experimental data (dots) for the focal length versus energy for the FZP (blue) and the achromat (red; solid: based on Eq. (6), dashed: based on tabulated refractive index values for the calculation of fRL at each energy). Image Credit: Kubec, et al., 2022
As shown in Figure 3c, the experimental results for the focus point placement accord well with the equivalent predicted curves for both the achromat and the FZP.
Figure 4a depicts the outcome of combining the binarized SEM picture of the Siemens star in Figure 2b with a simulated polychromatic X-ray beam with an energy range of 5.6 keV to 6.8 keV generated with an achromat. When contrasted to the image in Figure 4b, which was simulated analogously using a FZP as an optical element, the improvement in image quality is significant.
The simulated polychromatic beam profiles in Figure 4c show significantly better side lobes of the beam for the FZP than for the achromat, indicating an increase in picture quality.
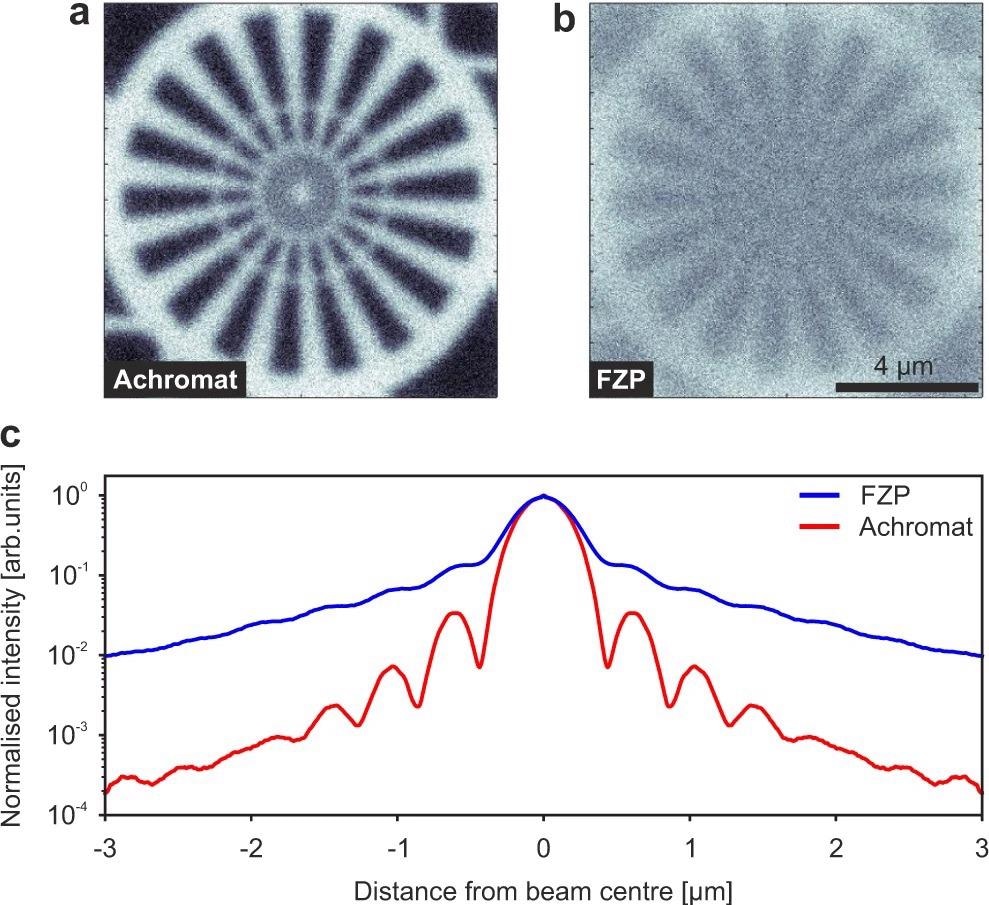
Figure 4. Simulations of polychromatic X-ray focusing with an achromatic lens and with a single FZP (energy range from 5.6 keV to 6.8 keV). a Convolution of the simulated polychromatic X-ray beam of the achromat with the binarized image of the Siemens star in Fig. 2b. b Convolution of the same image with the simulated polychromatic X-ray beam of the FZP. Gaussian noise was added to both images after convolution to model the image noise in experimental data. c Line profiles of the simulated polychromatic X-ray beams (normalized to central peak) for the achromat (red) and the FZP (blue). Image Credit: Kubec, et al., 2022
The experimental realization of an X-ray achromat comprised of a concentrating diffractive and a defocusing refractive optical element that delivers consistent imaging performance throughout a large energy range without changing the focal settings has been described. This feature will aid monochromatic X-ray investigations that require a quick or frequent shift in photon energy.
According to the models, the achromat will be especially useful for its application in polychromatic laboratory X-ray tube sources, allowing for efficient high-resolution imaging in laboratory-based X-ray systems.
Methodology
The FZP that was employed as part of the achromat was a four-step, double-sided blazed FZP. It was made up of nickel structures on the top and bottom of a silicon nitride membrane with a thickness of 250 nanometers.
The membranes were overlaid with a chromium-gold-chromium plating base by evaporation for both FZPs, and then spin-coated with a Poly(methyl methacrylate) (PMMA) resist layer, which was then revealed by electron-beam lithography. The designs were created, the resist trenches were cleansed by plasma etching, and then the nickel was electroplated, followed by the removal of the remaining PMMA.
By using Nanoscribe Photonic Professional GT, the RL was 3D-printed employing two-photon polymerization-induced lithography.
An SEM image of the RL used in the experiment is shown in Figure 1c. To stack the four paraboloids, vertical support structures were printed.
The achromat was created in such a way that the RL served as a corrector for the FZP’s chromaticity. The result of the diffraction performance of the FZP and the X-ray transmission through the RL may be used to approximate the efficiency of such an achromat, yielding a theoretical efficiency of roughly 24% at the design energy of 6.2 keV for the optics.
Figure 1d depicts the experimental setup for the measurements. The beam-shaping slits upstream of the setup were designed to guarantee that the lens aperture was illuminated totally coherently.
X-ray ptychography has emerged as a useful tool for characterizing X-ray optics in the recent decade. The approach was utilized to recover the caustics of the X-ray beam that illuminated the material in this case.
The coordinates of the voxel with the maximum intensity in each caustic are shown by the measured data points for focal length in Figure 3c.
Both an achromat, comprised of an RL and an FZP, and a single FZP were simulated for X-ray focusing. The simulations were carried out using Matlab code created in-house and based on an angular-spectrum technique reported in previous papers.
The simulations were carried out in stages of 50 eV for energies between 5.6 and 6.8 keV. Simulated X-ray pictures of a Siemens star were created using the X-ray probes acquired this way for both the achromat and the FZP. The SEM image of the Siemens star in Figure 2b was binarized and then convolved in the focus plane with the generated X-ray probe.
Conclusion
The work presented here is a proof-of-concept for an X-ray achromat, with room for further advancements in manufacturing methods and design. The reduced X-ray spot size will need RLs with greater refracting powers and, as a result, higher structures with smaller curvature radii.
This problem, as well as the RL’s considerable absorption losses, can be solved by designing the RL with a stepped profile, as previously described.
Additionally, while the diffractive and refractive components of the achromat are now installed on two distinct support membranes, researchers will investigate the manufacturing of the achromat as a single monolithic device in the future. This will make aligning and using the achromatic X-ray lens in the experimental setup much easier.
Journal Reference:
Kubec, A., Zdora, M. C., Sanli, U. T., Diaz, A., Vila-Comamala, J., David, C. (2022) An achromatic X-ray lens. Nature Communications, 13(1), pp. 1-7. Available Online: https://www.nature.com/articles/s41467-022-28902-8.
References and Further Reading
- Schroer, C & Lengeler, B (2007) X-Ray Optics. pp. 1153–1164. (Springer New York, New York,) doi.org/10.1016/S0168-9002(01)00531-9.
- Salditt, T & Osterhoff, M (2020) X-ray Focusing and Optics. (Springer International Publishing, Cham,) doi.org/10.1007/978-3-030-34413-9_3.
- Jacobsen, C (2019) X-ray Microscopy, pp. 199–240. Chapter 5: X-Ray Focusing Optics (Cambridge University Press, Cambridge). doi.org/10.1017/9781139924542.006.
- Wolter, H (1952) Spiegelsysteme streifenden Einfalls als abbildende Optiken für Röntgenstrahlen. Annals of Physics, 445, pp. 94–114. doi.org/10.1002/andp.19524450108.
- Matsuyama, S., et al. (2017) 50-nm-resolution full-field X-ray microscope without chromatic aberration using total-reflection imaging mirrors. Scientific Reports, 7, p. 46358. doi.org/10.1038/srep46358.
- Horn, R. F (1965) The history of the telescope objective. MNASSA, 24, p. 112.
- Ramsden, J (1789) Some observations on the invention of achromatic telescopes. Royal Society, decade IX, p. 138.
- Wang, Y., et al. (2003) Achromatic Fresnel optics for wideband extreme-ultraviolet and X-ray imaging. Nature, 424, pp. 50–53. doi.org/10.1038/nature01756.
- Chapman, H N & Bajt, S (2021) High-resolution achromatic X-ray optical systems for broad-band imaging and for focusing attosecond pulses. Proceedings of the Royal Society A, 477, p. 20210334. doi.org/10.1098/rspa.2021.0334.
- Skinner, G. K (2004) Design and imaging performance of achromatic diffractive-refractive x-ray and gamma-ray Fresnel lenses. Applied Optics, 43, pp. 4845–4853. doi.org/10.1364/AO.43.004845.
- Gorenstein, P (2004) Role of diffractive and refractive optics in x-ray astronomy. Proceedings of SPIE, 5168, pp. 411–419. doi.org/10.1117/12.506443.
- Braig, C & Predehl, P (2012) Multiband imaging at the diffraction limit using Fresnel x-ray telescopes. Optical Engineering, 51, p. 096501. doi.org/10.1117/1.OE.51.9.096501.
- Bajt, S., et al. (2018) X-ray focusing with efficient high-NA multilayer Laue lenses. Light: Science & Applications, 7, p. 17162. doi.org/10.1038/lsa.2017.162.
- Sanli, U. T., et al. (2018) 3D nanoprinted plastic Kinoform X-ray optics. Advanced Materials, 30, p. 1802503. doi.org/10.1002/adma.201802503.
- Henke, B., et al. (1992) X-ray interactions: photoabsorption, scattering, transmission, and reflection at E = 50–30000 eV, Z = 1–92. Atomic Data and Nuclear Data Tables, 54, pp. 181–342.
- Eskildsen, M. R., et al. (1998) Compound refractive optics for the imaging and focusing of low-energy neutrons. Nature, 391, pp. 563–566. doi.org/10.1038/35333.
- Poulsen, S. O., et al. (2014) Refractive and diffractive neutron optics with reduced chromatic aberration. Nuclear Instruments and Methods in Physics Research A, 767, pp. 415–420. doi.org/10.1016/j.nima.2014.09.031.
- Mohacsi, I., et al, (2013) High-efficiency x-ray nanofocusing by the blazed stacking of binary zone plates. In Lai, B. (ed.) X-Ray Nanoimaging: Instruments and Methods, vol. 8851, pp. 142-149. International Society for Optics and Photonics (SPIE). doi.org/10.1117/12.2022640.
- Mohacsi, I., et al. (2016) Fabrication and characterization of high-efficiency double-sided blazed x-ray optics. Optics Letters, 41, pp. 281–284. doi.org/10.1364/OL.41.000281.
- Malinauskas, M., et al. (2013) Ultrafast laser nano-structuring of photopolymers: a decade of advances. Physics Reports, 533, pp. 1–31. doi.org/10.1016/j.physrep.2013.07.005.
- Lyubomirskiy, M., et al. (2019) Ptychographic characterisation of polymer compound refractive lenses manufactured by additive technology. Optics Express, 27, pp. 8639–8650. doi.org/10.1364/OE.27.008639.
- Hecht, E (2001) Optics (Addison-Wesley), 4 edn.
- Horowitz, P & Howell, J A (1972) A scanning X-Ray microscope using synchrotron radiation. Science, 178, pp. 608–611. doi.org/10.1126/science.178.4061.608.
- Jacobsen, C., et al. (1991) Diffraction-limited imaging in a scanning transmission x-ray microscope. Optics Communications, 86, pp. 351–364. doi.org/10.1016/0030-4018(91)90016-7.
- Rodenburg, J. M., et al. (2007) Hard-x-ray lensless imaging of extended objects. Physical Review Letters, 98, p. 034801. doi.org/10.1103/PhysRevLett.98.034801.
- Thibault, P., et al. (2008) High-resolution scanning X-ray diffraction microscopy. Science, 321, pp. 379–382. doi.org/10.1126/science.1158573.
- Kewish, C. M., et al. (2010) Ptychographic characterization of the wavefield in the focus of reflective hard X-ray optics. Ultramicroscopy, 110, pp. 325–329. doi.org/10.1016/j.ultramic.2010.01.004.
- Vila-Comamala, J., et al. (2011) Characterization of high-resolution diffractive x-ray optics by ptychographic coherent diffractive imaging. Optics Express, 19, pp. 21333–21344. doi.org/10.1364/OE.19.021333.
- Seiboth, F., et al. (2017) Perfect X-ray focusing via fitting corrective glasses to aberrated optics. Nature Communications, 8, p. 14623. doi.org/10.1038/ncomms14623.
- Wakonig, K., et al. (2020) PtychoShelves, a versatile high-level framework for high-performance analysis of ptychographic data. Journal of Applied Crystallography, 53, pp. 574–586. doi.org/10.1107/S1600576720001776.
- Vila-Comamala, J., et al. (2013) Angular spectrum simulation of X-ray focusing by Fresnel zone plates. Journal of Synchrotron Radiation, 20, pp. 397–404. doi.org/10.1107/S090904951300263X.
- Cowley, J. M & Moodie, A. F (1957) The scattering of electrons by atoms and crystals. I. A new theoretical approach. Acta Crystallographica, 10, pp. 609–619. doi.org/10.1107/S0365110X57002194.
- Li, K., et al. (2017) Multislice does it all–calculating the performance of nanofocusing X-ray optics. Optics Express, 25, pp. 1831–1846. doi.org/10.1364/OE.25.001831.