Individual and population-wide testing has been one of the most effective ways to restrict the transmission of SARS-CoV-2 infection since the start of the Coronavirus disease 2019 (COVID-19) pandemic.
Image Credit: Corona Borealis Studio/Shutterstock.com
This technique allows for the detection of infected persons, particularly those who are asymptomatic and can spread the infection silently, as well as the tracing of their close connections, thereby limiting the infection’s transmission.
To assess the occurrence of new infections, control measures, such as the use of face masks, social distancing, or, eventually, the establishment of a lockdown, must be implemented.
SARS-CoV-2 can be found in samples taken from the respiratory system, such as nasal/oropharyngeal swabs and sputum, as well as samples taken from the digestive tract, such as saliva or feces. Saliva can be used instead of nasal or oropharyngeal swabs.
Researchers have presented a unique portable flow-virometry reader (FVR) for rapid identification of SARS-CoV-2 directly from saliva samples, which blends the quick turnaround time of an antigen test with a high sensitivity comparable to RT-PCR. Flow cytometry, a sophisticated laser-based cell analysis technology for counting and sorting cells with the help of light scattering and/or fluorescence, is used in the suggested diagnostic gadget. The study was published in Biomedical Optics Express.
Results and Discussion
From sample collection to SARS-CoV-2 detection of antibodies, Figure 1 depicts the whole process of the proposed diagnostic system.
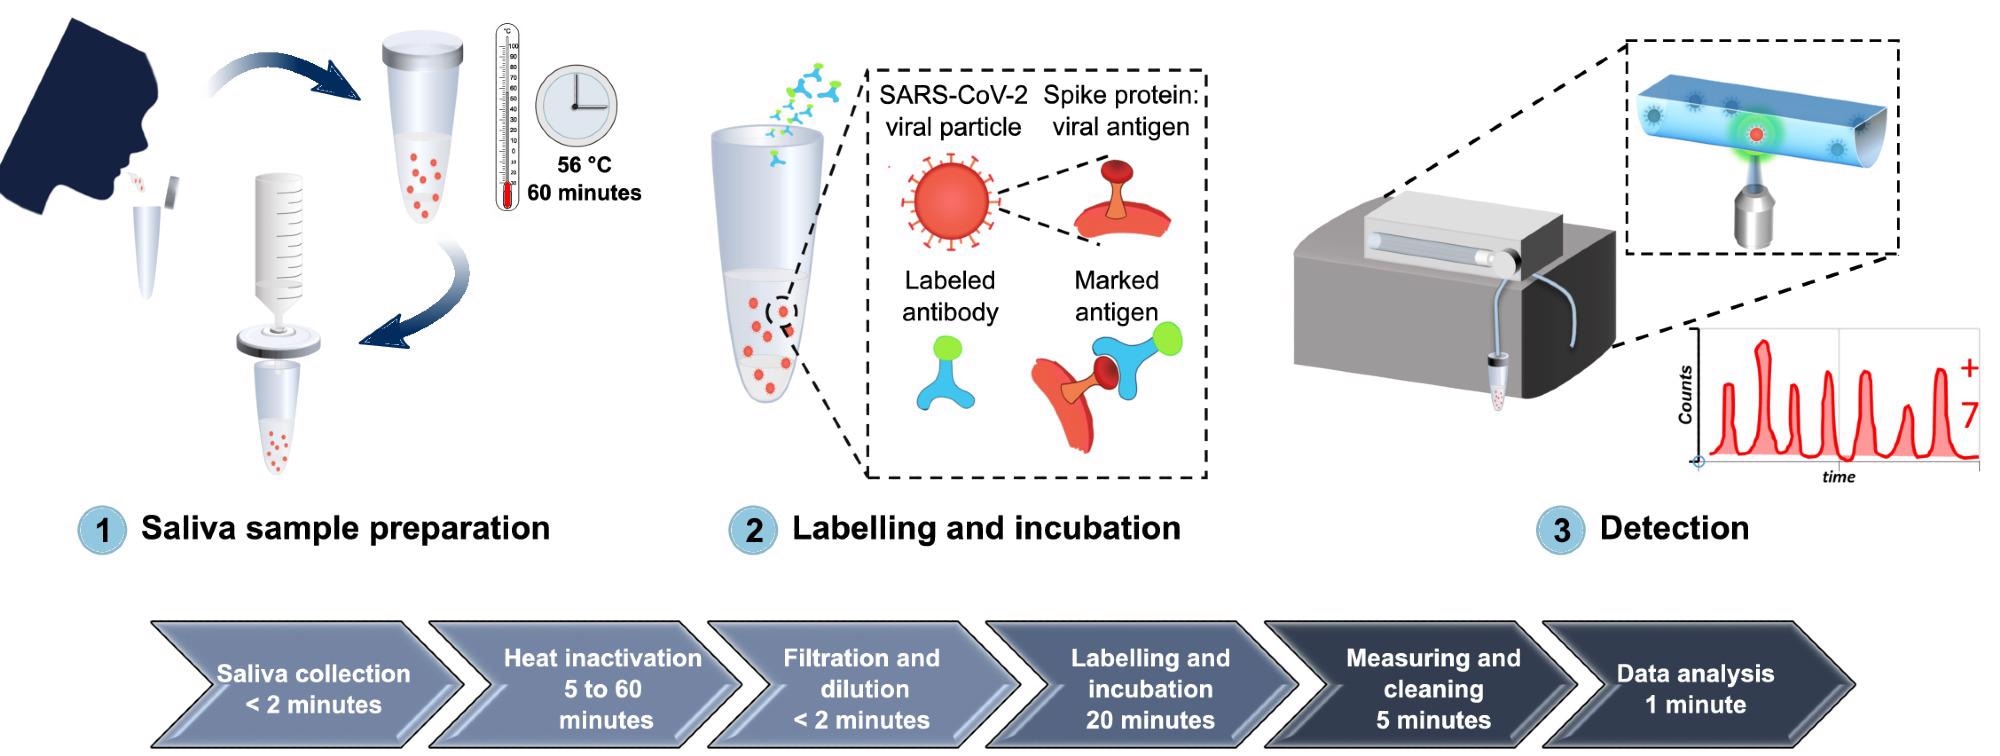
Figure 1. A comprehensive overview of the developed diagnostic method for detection of SARS-CoV-2 antigen, from sample collection to SARS-CoV-2 antigen measurement. (1) Saliva is collected by spit, heat inactivated at 56 °C for 1 hour, diluted in PBS, and filtered with a 0.2 µm syringe filter. (2) The sample is then labeled with Alexa 488-anti-SARS-CoV spike antibodies and incubated for 20 minutes at room temperature. (3) The labeled sample is circulated inside the FVR and a fluorescence signal is detected every time antibody-virus complexes pass through the interrogation point. Image Credit: Hussain, et al., 2022
The FVR is a portable flow virometer that can be used to identify and measure fluorescence-labeled micro and nanoparticles, including viruses such as SARS-CoV-2. It consists of a single straight channel microfluidic chip for sample flow and interrogation, as well as an optical head for sample excitation and signal gathering. Its schematic diagram with component information is shown in Figure 2(a).
Figure 2(b) depicts a lab-built prototype operated by a tablet.
![FVR characterization. (a) A schematic diagram of the FVR detection system. (b) A lab built FVR prototype with the tablet. (c) Standard curve of the polystyrene beads concentration vs. total counts, R2 = 0.99. (d) Standard curve of the fluorescent (Alexa 488) anti-SARS-CoV spike antibody concentration vs. counts per minute, R2 = 0.94. For visual representation purposes the y-axis is broken into two regions [0:10], [60:100] and the x-axis into three [0:6], [49:52] and [498:501]. The error bar represents the standard deviation.](https://www.azooptics.com/images/Article_Images/ImageForArticle_2164_16461271973197140.jpg)
Figure 2. FVR characterization. (a) A schematic diagram of the FVR detection system. (b) A lab built FVR prototype with the tablet. (c) Standard curve of the polystyrene beads concentration vs. total counts, R2 = 0.99. (d) Standard curve of the fluorescent (Alexa 488) anti-SARS-CoV spike antibody concentration vs. counts per minute, R2 = 0.94. For visual representation purposes the y-axis is broken into two regions [0:10], [60:100] and the x-axis into three [0:6], [49:52] and [498:501]. The error bar represents the standard deviation. Image Credit: Hussain, et al., 2022
The subsequent calibration plot for polystyrene beads with different concentrations is shown in Figure 2(c).
The generated anti-SARS-CoV spike antibody concentrations and the measured fluorescence events have a strong correlation, as shown in Figure 2(d).
Researchers identified the Limit of Blank (LOB) and the Limit of Detection (LOD). They built a standard curve to find the link between the FVR signal and viral load to examine the possibility of the created FVR as a novel platform for rapid identification of SARS-CoV-2 effectively from saliva samples.
The signal produced from the Alexa 488-anti-SARS-CoV spike antibody and the filtered saliva samples was first evaluated (Figure 3a).
The signal received from filtered saliva samples was weaker than that obtained from Alexa 488-anti-SARS-CoV spike antibody (p < 0.0001), demonstrating that the leftover saliva content after filtration did not affect SARS-CoV-2 detection.
With increasing viral load concentrations, a standard curve was established (Figure 3b) by quantifying labeled SARS-CoV-2 viral antigens from saliva samples.
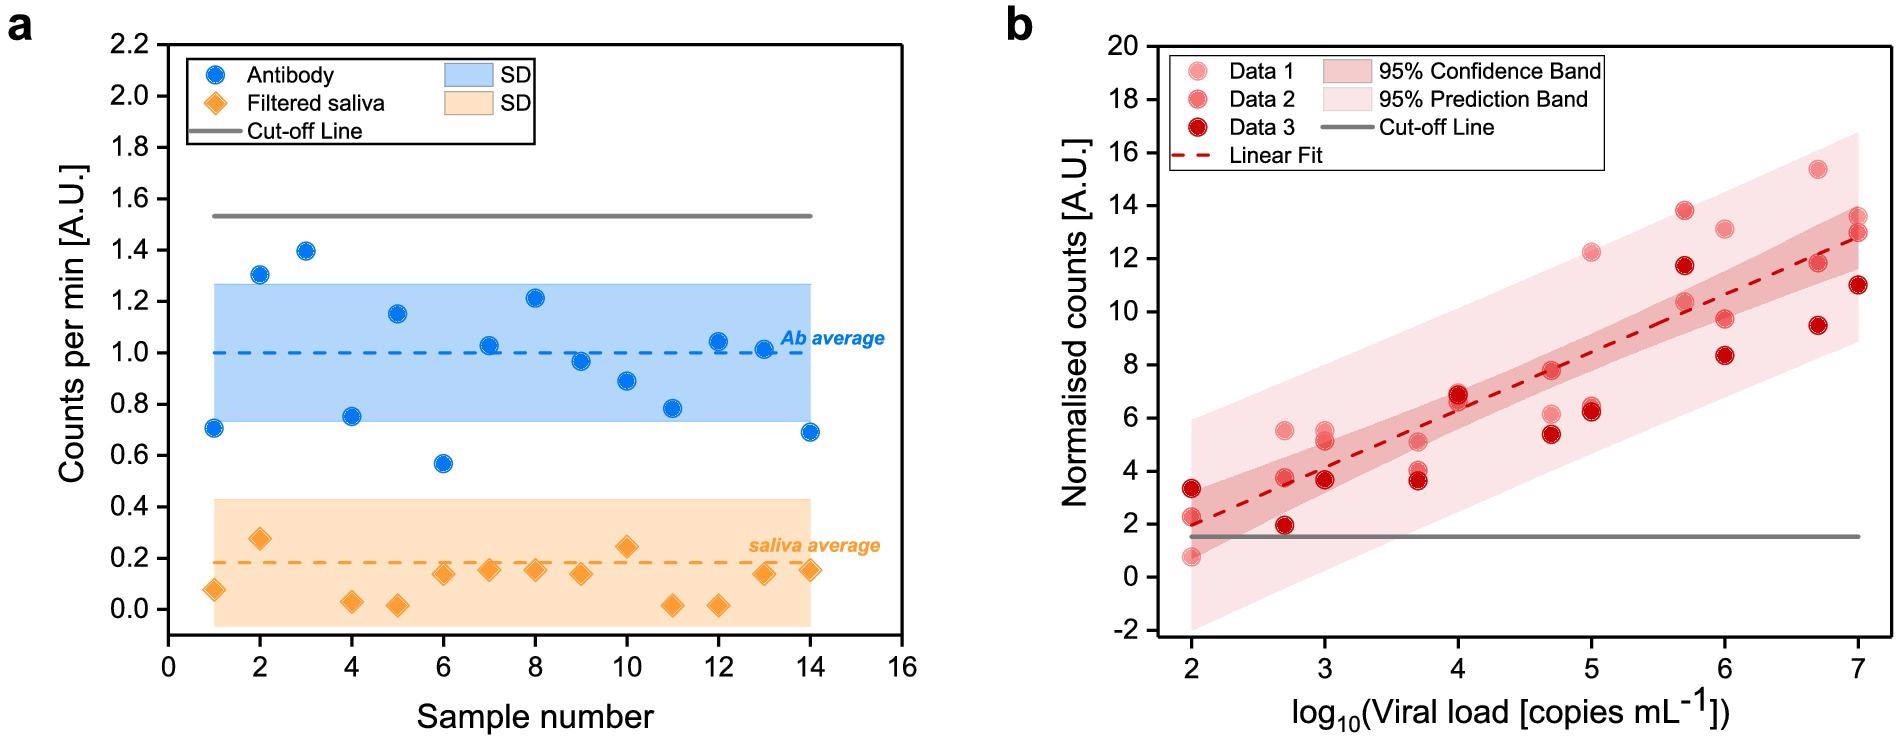
Figure 3. Determination of FVR cut-off value and standard curve for SARS-CoV-2 detection (a) Counted events per minute of the Alexa 488-anti-SARS-CoV spike antibody (blue) and of filtered saliva samples (orange). Mean values (dotted lines) and standard deviations (shaded area) are indicated. Cut-off, according to the antibody signal (blue), was calculated as mean plus two times its standard deviation and indicated as solid line. (b) Standard curve of the SARS-CoV-2 viral particles concentration vs. normalized counts; R2 = 0.94. Image Credit: Hussain, et al., 2022
Researchers conducted a blind test utilizing frozen saliva samples from SARS-CoV-2 infected (n = 34) and uninfected (n = 20) individuals to assess the effectiveness of the developed FVR for diagnosis of SARS-CoV-2.
The FVR successfully detected 18 out of 20 SARS-CoV-2 negative patient samples and 31 out of 34 SARS-CoV-2 positive patient samples, as previously determined by RT-qPCR (Figure 4a and b).
![Detection of SARS-CoV-2 in saliva samples from SARS-CoV-2 infected and uninfected individuals. SARS-CoV-2 was determined in saliva samples from both SARS-CoV-2 infected (n = 34) and uninfected (n = 20) individuals in a blind test. (a) Sample identification by color code (red: SARS-CoV-2 positive samples; green: SARS-CoV-2 uninfected samples) according to RT-qPCR. (b) Distribution of saliva samples showing the normalized count obtained with the FVR. (c) Correlation between normalized counts and RT-qPCR viral load [copies mL-1] of blind test samples. The dashed line indicates a linear fit (R2 = 0.43) to the data from positive samples that fall within our analytical range excluding the outliers marked with a circle. Here outliers are defined as data points whose residual values are greater than two times the standard deviation of all the data points.](https://www.azooptics.com/images/Article_Images/ImageForArticle_2164_16461272474513234.jpg)
Figure 4. Detection of SARS-CoV-2 in saliva samples from SARS-CoV-2 infected and uninfected individuals. SARS-CoV-2 was determined in saliva samples from both SARS-CoV-2 infected (n = 34) and uninfected (n = 20) individuals in a blind test. (a) Sample identification by color code (red: SARS-CoV-2 positive samples; green: SARS-CoV-2 uninfected samples) according to RT-qPCR. (b) Distribution of saliva samples showing the normalized count obtained with the FVR. (c) Correlation between normalized counts and RT-qPCR viral load [copies mL-1] of blind test samples. The dashed line indicates a linear fit (R2 = 0.43) to the data from positive samples that fall within our analytical range excluding the outliers marked with a circle. Here outliers are defined as data points whose residual values are greater than two times the standard deviation of all the data points. Image Credit: Hussain, et al., 2022
Researchers verified a linear association (R2 = 0.43) between the normalized counts and copies mL−1 of the samples with concentrations up to 107 copies mL-1 when analyzing the signal produced from the blind samples with the viral load assessed by RT-qPCR (Figure 4c).
Methodology
Thorlabs provided all of the optomechanical components, while Hamamatsu Photonics provided the MPPC. The optical equipment, along with the electronic modules, was placed inside a 200 mm × 300 mm × 109 mm box to create a lab prototype.
Fluorescent polystyrene beads (2 µm) at a concentration of 250 beads mL-1 were used to evaluate the FVR system. The green fluorescent beads have a 480 nm excitation wavelength and a 520 nm emission wavelength. The chip’s position was tweaked until a consistent pace of at least two occurrences per second was achieved.
Between July and October 2020, saliva samples were collected from COVID-19 patients that had been confirmed by PCR.
For viral inactivation, saliva samples were frozen and heated to 56 °C for 1 hour. To ensure that the system was completely cleaned between samples, six cleaning cycles were required on average.
The American Center for Disease Control and Prevention produced the 2019-Novel Corona-virus Real-Time RT-qPCR Diagnostic Panel guidelines and techniques for PCR amplification.
Individual data or mean plus standard deviation were used to display all of the results.
Conclusion
The major goal of this research was to create a flow-virometry-based biosensor that unites the sensitivity of RT-PCR with the speed of a rapid antigen test.
Furthermore, RT-PCR and rapid antigen testing frequently employ nasopharyngeal swab samples, the suggested technique and examination use saliva samples, which can be collected quickly and delivered by patients themselves. Furthermore, if necessary, the test may be simply modified to function with nasopharyngeal swab samples.
Based on the findings, researchers feel that the FVR, when combined with saliva samples, has a lot of potential to become a rapid, portable, and user-friendly point-of-care device that can run up to 2000 tests per day.
Future research should concentrate on antibody cross-reactivity with various viruses and antigens. Additionally, efforts will be made to establish an integrated FVR for dual antigen and antibody analysis of SARS-CoV-2.
This hybrid testing gadget will be able to identify an active infection in the body and detail the immune response to the infection or post-vaccination. This will enable a quick assessment of vaccine efficacy and the requirement for subsequent vaccination boosters.
Journal Reference:
Hussain, R., Ongaro, A. E., de la Concepción, M. L. R., Wajs, E., Riveira-Muñoz, E., Ballana, E., Blanco, J., Toledo, R., Chamorro, A., Massanella, M., Mateu, L., Grau, E., Clotet, B., Carrillo, J., Pruneri, V. (2022) Small form factor flow virometer for SARS-CoV-2. Biomedical Optics Express, 13(3), pp. 1609-1619. Available Online: https://opg.optica.org/boe/fulltext.cfm?uri=boe-13-3-1609&id=469734.
References and Further Reading
- Mercer, T R & Salit, M (2021) Testing at scale during the COVID-19 pandemic. Nature Reviews Genetics, 22(7), pp. 415–426.doi.org/10.1038/s41576-021-00360-w.
- Cohen K & Leshem A (2021) Suppressing the impact of the COVID-19 pandemic using controlled testing and isolation. Scientific Reports, 11(1), p. s6279. doi.org/10.1038/s41598-021-85458-1.
- Kevadiya, B. D., et al. (2021) Diagnostics for SARS-CoV-2 infections. Nature Materials, 20(5), pp. 593–605. doi.org/10.1038/s41563-020-00906-z.
- Ji, T., et al. (2020) Detection of COVID-19: a review of the current literature and future perspectives. Biosensors and Bioelectronics, 166, p. 112455. doi.org/10.1016/j.bios.2020.112455.
- Park, M., et al. (2020) Optimization of primer sets and detection protocols for SARS-CoV-2 of coronavirus disease 2019 (COVID-19) using PCR and real-time PCR. Experimental & Molecular Medicine, 52(6), pp. 963–977.doi.org/10.1038/s12276-020-0452-7.
- Bohn, M.K., et al. (2020) Molecular, serological, and biochemical diagnosis and monitoring of COVID-19: IFCC taskforce evaluation of the latest evidence. Clinical Chemistry and Laboratory Medicine, 58(7), pp. 1037–1052. doi.org/10.1515/cclm-2020-0722.
- Antibody (2021) Antigen and Molecular Tests for COVID-19. Johns Hopkins Center for Health Security.
- Pilarowski G., et al. (2020) Field performance and public health response using the BinaxNOWTM Rapid SARS-CoV-2 antigen detection assay during community-based testing. Clinical Infectious Diseases, 73(9), pp. 1–27. https://doi.org/10.1093/cid/ciaa1890.
- Tobian F., et al. (2022) Accuracy and ease-of-use of seven point-of-care SARS- CoV-2 antigen-detecting tests: a multi-centre clinical evaluation. EBioMedicine,75, p. 103774.
- Asghari, A., et al. (2021) Fast, accurate, point-of-care COVID-19 pandemic diagnosis enabled through advanced lab-on-chip optical biosensors: opportunities and challenges. Physical Review Applied, 8(3), p. 031313. doi.org/10.1063/5.0022211.
- Goswami, N., et al. (2021) Label-free SARS-CoV-2 detection and classification using phase imaging with computational specificity. Light: Science & Applications, 10(1), p. 176. doi.org/10.1038/s41377-021-00620-8.
- Ruiz-vega, G., et al. (2021) Nanophotonic biosensors for point-of-care COVID-19 diagnostics and coronavirus surveillance Nanophotonic biosensors for point-of-care COVID-19 diagnostics and coronavirus surveillance. Journal of Physics: Photonics, 3(1), p. 011002.
- Vandenberg, O., et al. (2021) Considerations for diagnostic COVID-19 tests. Nature Reviews Microbiology, 19(3), pp. 171–183. doi.org/10.1038/s41579-020-00461-z.
- Hung, K. F., et al. (2020) New COVID-19 saliva-based test: How good is it compared with the current nasopharyngeal or throat swab test? Journal of the Chinese Medical Association, 83(10), pp. 891–894. doi.org/10.1097/jcma.0000000000000396.
- Li, Y., et al. (2020) Saliva is a non-negligible factor in the spread of COVID-19. Molecular Oral Microbiology, 35(4), pp. 141–145. doi.org/10.1111/omi.12289.
- Sapkota, D., et al. (2020) Saliva testing for COVID-19?” British Dental Journal,228(9), p. 658–659. doi.org/10.1038/s41415-020-1594-7.
- Soni, N., et al. (2020) A flow virometry process proposed for detection of SARS-CoV-2 and large-scale screening of COVID-19 cases. Future Virology, 15(8), pp. 525–532. doi.org/10.2217/fvl-2020-0141.
- Reverberi, R & Reverberi. L (2007) Factors affecting the antigen-antibody reaction. Blood transfusion, 5(4), pp. 227–240. doi.org/10.2450/2007.0047-07.
- Ward, G., et al. (2017) The investigation of interferences in immunoassay. Clinical Biochemistry, 50(18), pp. 1306–1311. doi.org/10.1016/j.clinbiochem.2017.08.015.
- Armbruster D A & Pry T (2008) Limit of blank, limit of detection and limit of quantitation. Clinical Biochemist Reviews, 29 (Suppl 1), pp. S49–52.
- Shrivastava A & Gupta V (2011) Methods for the determination of limit of detection and limit of quantitation of the analytical methods. Chronicles of Young Scientists, 2(1), p. 21. doi.org/10.4103/2229-5186.79345.
- Corman, V. M. et al. (2021) Comparison of seven commercial SARS-CoV-2 rapid point-of-care antigen tests: a single-centre laboratory evaluation study. Lancet Microbe, 2(7), pp. e311–e319. doi.org/10.1016/S2666-5247(21)00056-2.
- European Commission, (2021) MDCG 2021-21 Guidance on performance evaluation of SARS-CoV-2 in vitro diagnostic medical devices, pp. 1–17. Available at: https://ec.europa.eu/health/md_sector/new_regulations/guidance_en.
- Pruneri, V., et al. (2020) Fluidic apparatus for optical interrogation of individual microorganisms. Patent No. WO2020212628A1 (22 October).
- Batéjat, C., et al. (2020) Heat inactivation of the severe acute respiratory syndrome coronavirus 2. Journal of Biosafety and Biosecurity, 3, p. 1 doi.org/10.1016/j.jobb.2020.12.001.