 Interview conducted by Alex SmithOct 14 2022
Radiant Vision Systems specializes in imaging for light and color measurement and has been designing and manufacturing scientific-grade automated measurement solutions for 30 years.
In this interview , we discuss XR devices, their unique optical characteristics and components, trends in XR optical design and the performance indicators of each component.
Radiant shares how to address measurement challenges with imaging solutions, focusing on which tools provide the most effective data at each stage of XR development. Throughout the discussion, examples from Radiant’s portfolio of XR test systems and software are provided.
What are XR devices?
The term XR, or extended reality, helps summarize technologies that include virtual, mixed and augmented reality devices. Extended reality devices have diversified in a big way over a short period of time. Headsets use a variety of components to serve up visual experiences differently for different use cases.
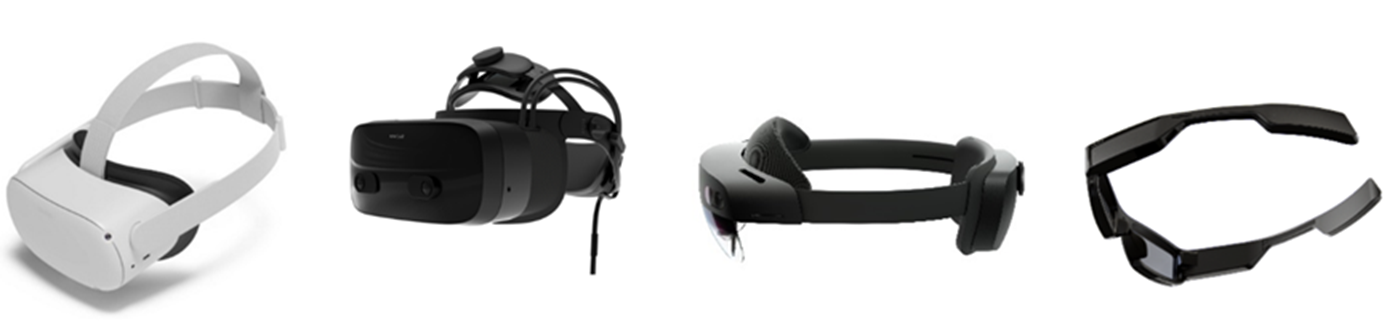
Examples of current XR devices. (From left to right: Meta Quest 2 (formerly Oculus Quest 2); Varjo VR-3; HoloLens 2; Vuzix Blade Upgraded Smart Glasses.) Image credit: Radiant Vision Systems
There are some common fundamental elements in the optical design of XR headsets. They universally have a light-generating element - generally called a display - and light-directing elements - typically lenses and/or light guides - and lastly, sensing elements.
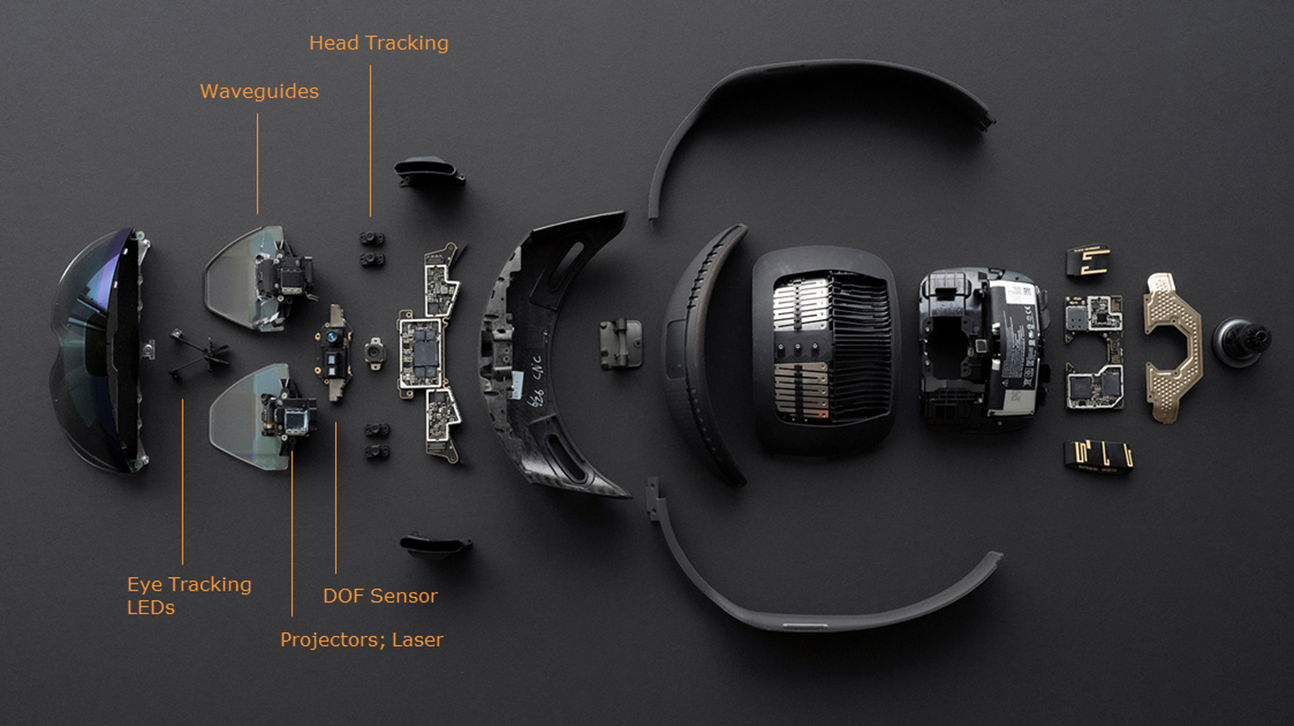
Optical components of a Microsoft HoloLens 2; Image credit: RoadtoVR
XR devices further combine these fundamental components within the same basic visualization constraints. These commonalities of XR design guide many of our approaches to measuring and ensuring the performance of devices and components and have pushed Radiant to develop new measurement tools that specifically address these constraints.
How does Radiant test for XR quality?
Ultimately, our goal at Radiant Vision Systems is to support the goal of optical design: evaluate the performance of every optical component and the combined optical design to ensure high-quality near-eye visual experiences for the user.
With a component landscape as diverse as that of an XR headset, the approach to testing is not one-and-done. Testing at each component can catch and address performance issues where they occur.
At the component stage, we isolate the display, the lens, the light guide and sensing elements to test their unique qualities, making sure only the best components make it into the final design.
Then we test the whole design, measuring the visual experience the components come together to create. We not only do this in the design phase but also set tolerances to evaluate each device’s visual quality during production. This testing ensures every headset offers the visual experience that the design is intended for.
What are some of the trends XR optical design?
One of the trends in XR optical design, which also poses some of the biggest challenges, is form factor. Almost universally, devices are getting smaller, lighter, more streamlined and more intuitive. Form factor pushes every aspect of the optical design down an increasingly narrow road so that engineers are developing creative approaches to do more with less.
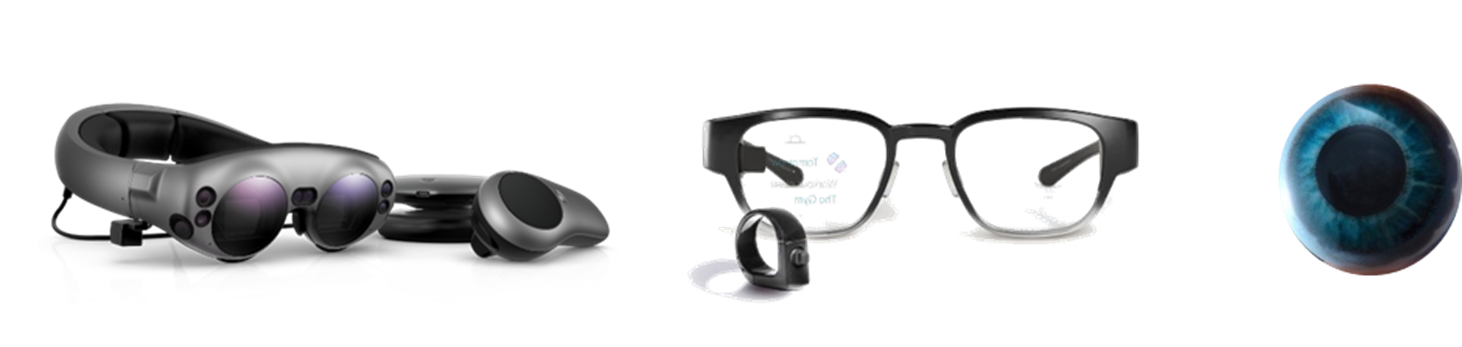
Device form factor is becoming smaller and more streamlined, as demonstrated by these augmented reality headsets. (From left to right: Magic Leap 1 (2018); North Focals (2019); Mojo Lens (TBD).) Image credit: Radiant Vision Systems
One area is in the display - the primary driver of the visual experience that is meant to dissolve the line between virtual and reality. To do this, displays are being developed to produce visuals that closely match the scope and acuity of human vision.
One aspect of human vision that is emulated is the field of view, which is generally accepted as 120 degrees horizontal (for binocular vision). In XR design, this field of view can create immersive experiences without any perceivable limitations.
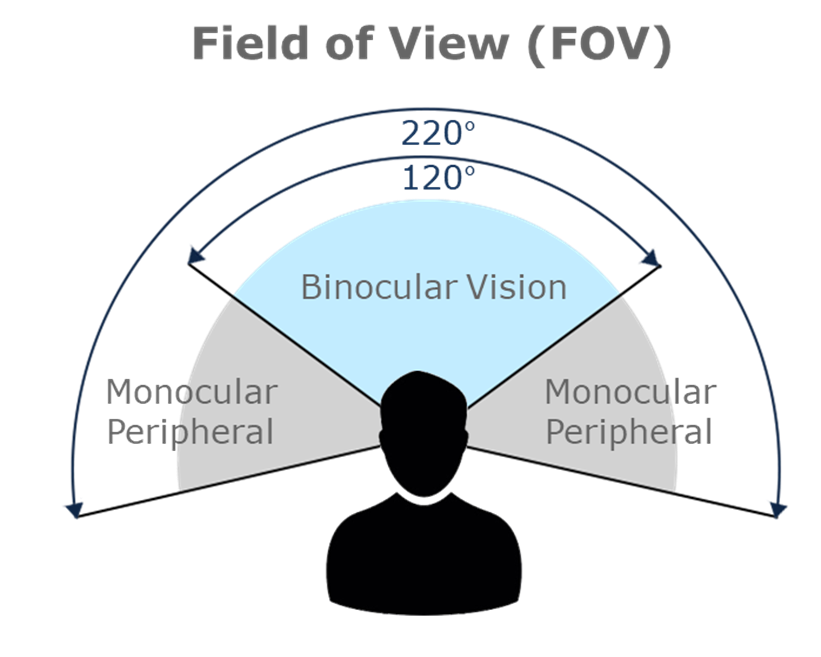
Binocular human vision. Image credit: Radiant Vision Systems
The design also aims to emulate human visual acuity, which is measured in arcminutes. The smallest discernible detail in a typical eye test chart, or Snellen eye chart, is 1-arcminute wide for someone with perfect 20/20 vision. An arcminute is equal to about 1/60th of 1 degree in angular vision.
With this being the case, human-eye resolution in XR displays is generally accepted as 60 pixels per degree or PPD. This is also referred to as retinal resolution.
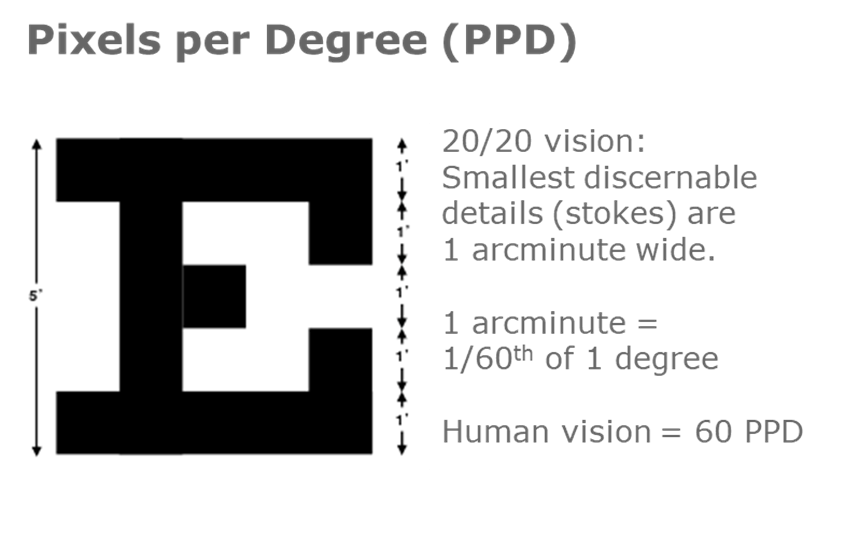
Snellen eye chart used to calculate human visual acuity (extrapolated to pixels per degree). Image credit: Radiant Vision Systems
So, there is a trend in XR displays for a larger field of view and higher PPD. Designs are trending toward new micro-pixel technologies that allow more pixels per degree in the same display area.
Display tech is shifting to emissive OLED, micro-OLED and microLED. The smaller pixel pitch is made possible by these technologies. They’re attractive for reaching that human visual acuity of 60 PPD.
For reflective or projection display modules, generally, LCoS has a smaller pixel pitch, which is derived from the native resolution of its CMOS chip. While DLP derives its resolution from the number of its reflective micromirrors.
What qualities are measured to determine visual performance of an XR optical design?
The most common parameters measured include brightness, color and their uniformity. These need to be measured precisely to guide design improvements. Then, we look for defects like dead pixels or lines, light leakage, non-uniform areas like mura. We can also evaluate qualities like image sticking and the visual changes over view angle.
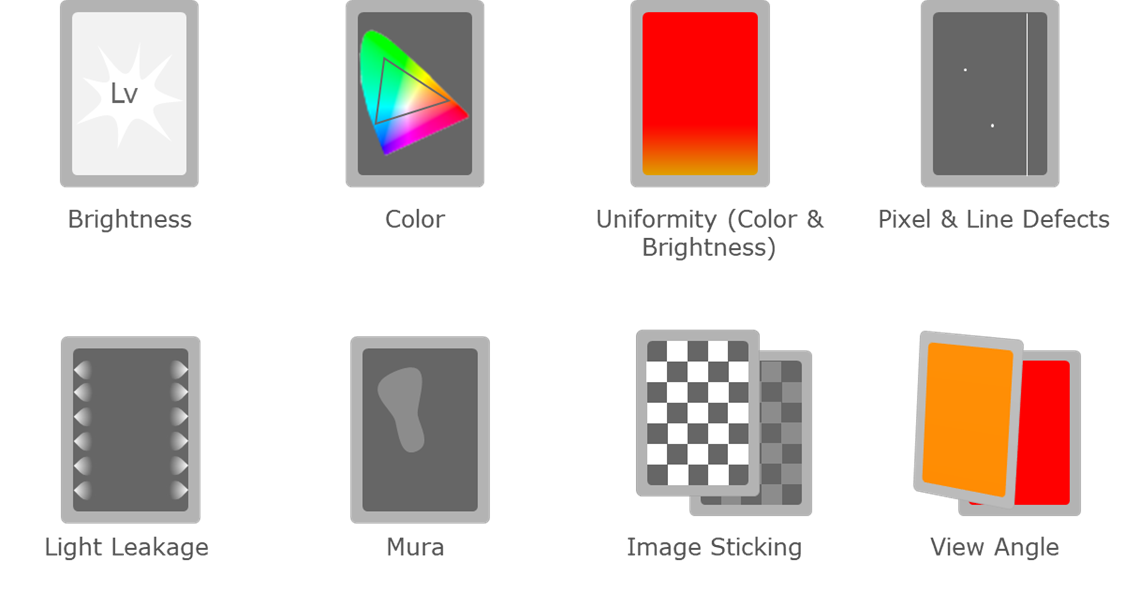
Common properties and defects that impact visual quality of displays. Image credit: Radiant Vision Systems
What kind of measurement equipment is used to evaluate visual elements in optical design?
Because the goal of testing is to measure any visual elements seen by a user, the ideal measurement equipment will be designed to emulate human vision
Imaging photometers and colorimeters are key metrology instruments because they combine photosensitivity to brightness and color that emulates human vision, extremely high resolution like that of the human eye, and of course imaging, which allows us to measure the entire visible area seen by the user.
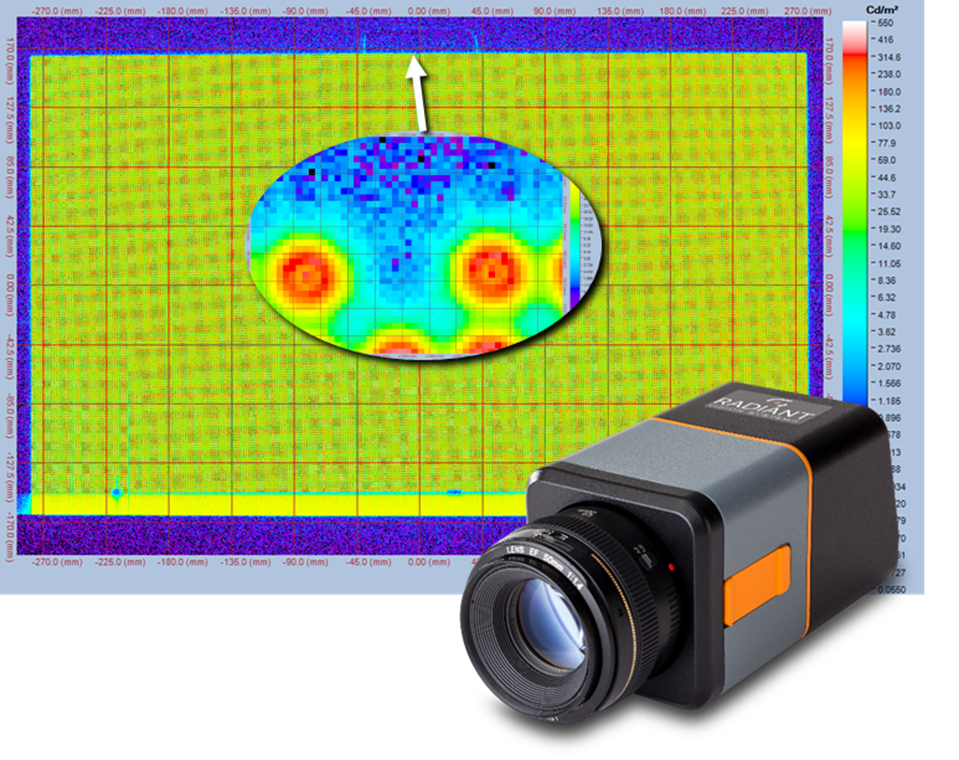
Radiant’s ProMetric® Y Imaging Photometer next to a measurement image of a display in TrueTest™ analysis software with luminance in false-color scale (inset: individual display pixels and dead pixel defect). Image credit: Radiant Vision Systems
Photometric imagers measure visible qualities by quantifying light; in essence, counting photons received on the camera’s image sensor. Light entering the camera is filtered using specialized optical filters, and the camera is calibrated to ensure the system response matches CIE functions.
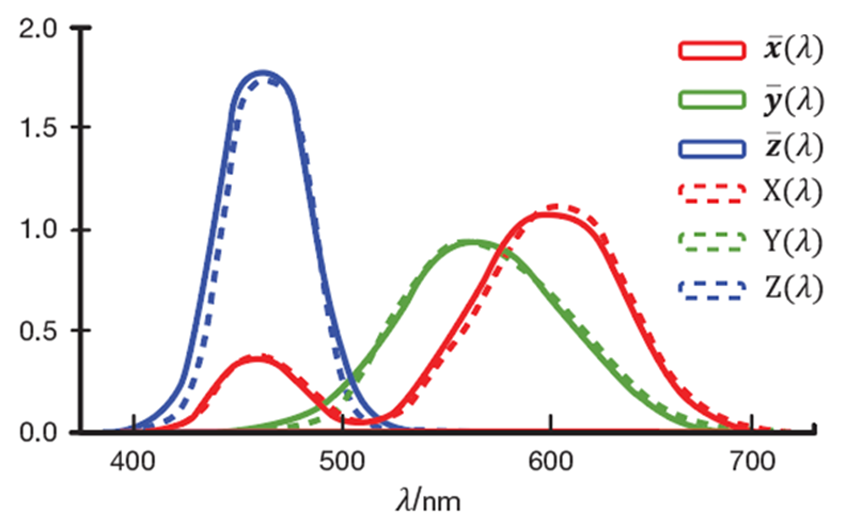
Used for light measurement, imaging system response must adhere to standard CIE color-matching functions describing human visual response (solid lines). These curves give the intensity of visible wavelengths perceived by the human eye. Radiant ProMetric imaging systems have filters that ensure a response (dotted lines) that closely matches CIE curves. Image credit: Radiant Vision Systems
CIE functions describe the standard visual response of the human eye and its perception of light and color. Using these systems, manufacturers can quickly evaluate an entire visible area of the display, measuring the photometric values and detecting visual defects the way a human user would see them.
Why are high-resolution measurement systems needed?
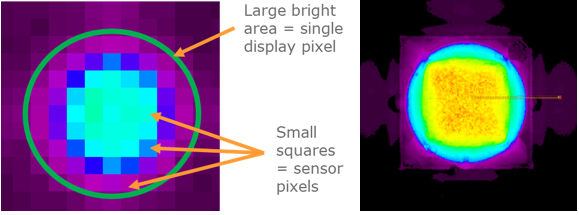
Since resolution is getting higher in XR displays, there is a demand for high-resolution measurement systems. The resolution of an image-based measurement system, like any camera, is defined by the pixels on its internal image sensor.
In most cases, for measurement, we look to maximize the number of image sensor pixels applied to the display to get more detail. A very high-resolution system is needed to apply enough sensor pixels to measure individual display pixels.
At Radiant, we offer imaging resolutions of up to 61 megapixels. This is fairly high, but the important thing to keep in mind for measurements like this is the ratio between the display and the camera’s resolution. If measuring a pixel is important, we can maximize the resolution of our measurement system by focusing on a section of the display at a time to see pixels and subpixels in detail.
Single subpixel in a display as imaged with a high-resolution imaging system (left; all display subpixels captured together in a single image) and an imaging system with microscope lens (right; a single display subpixel characterized at a time). Image credit: Radiant Vision Systems
A microscope lens applies an imager’s full sensor resolution to a smaller area of the display. This greatly increases the number of sensor pixels per display pixel. Engineers can use this for very precise measurement of individual emissive elements, characterizing subpixel patterns, or even evaluating emitters like a single microLED.
While a microscope provides a lot of detail, most display measurements in XR testing will require imaging the full display at once. Capturing the display in just one image makes it quick and easy to compare values across the display and to detect defects, but capturing the whole display at once means applying our image sensor pixels across a larger area. This limits how much detail we can get at each display pixel. There is definitely a balance to strike.
Why does maximizing resolution at the display pixel matter?
The industry is trending towards smaller pixels and pixel pitches, which are offered by display technology like emissive OLED, micro-OLED and microLED displays. As emissive displays’ pixels are self-illuminating, they offer advantages for brightness, contrast and efficiency.
However, there are some downsides. Emissive displays also suffer from uniformity issues because each pixel responds differently to different current levels.
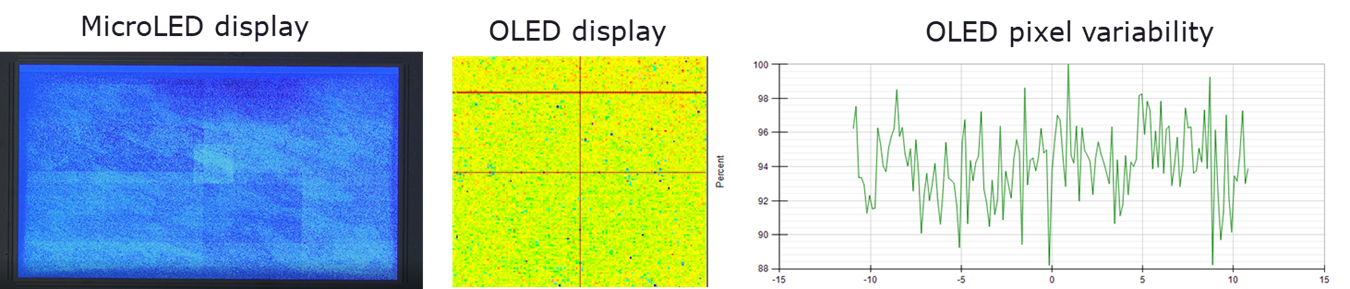
Measurement images and plots showing pixel-to-pixel variability in microLED and OLED displays, due to variations in subpixel output. Image credit: Radiant Vision Systems
We want to maximize measurement resolution at each display pixel to quantify these variations and calculate correction factors. In other words, we want to calculate how much input needs to be adjusted at each pixel to achieve uniform output across the display.
Non-uniformity in a display is called “mura,” so the process of pixel-level measurement and correction is called “demura” as it removes non-uniformity.
A robust demura solution is needed to correct emissive display uniformity. Radiant’s patented methods, such as Fractional Pixel Method (US Patent 10971044) and Spaced Pixel Method (US Patent 9135851) have been proven to provide the most accurate measurement at the pixel and subpixel level to ensure viable demura processes.
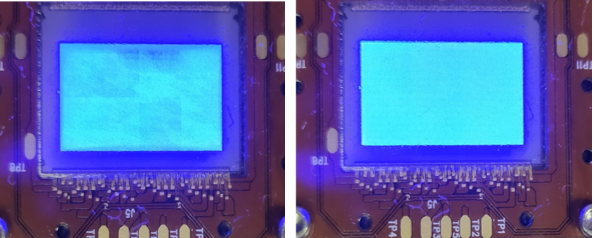
Example of demura applied to this microLED microdisplay using Radiant’s patented pixel-level measurement methods. (Left: before demura; right: after demura.) Image credit: Radiant Vision Systems
High-resolution imaging using systems calibrated to the human spectral response provide accurate luminance (brightness) and chromaticity (color) measurements. Combining these tools with demura measurement methods, we can quantify pixel output, determine discrepancies from pixel to pixel, and apply values to adjust pixel output to ensure the display appears perfectly uniform in brightness and color.
How do Radiant solutions address the challenge of measuring angular fields of view in XR displays?
We know XR displays are visualized in angular space, with a field of view that emulates the scope of human vision in some cases. If we want to emulate the human visual experience with our measurement system, and binocular human vision covers about 120 degrees, it is important that our measurement system can do the same.
The simplest answer is to use wide-field-of-view optics for this type of measurement, but there’s a challenge in how XR displays are visualized. All XR displays are viewed at a near-eye position inside of a headset.
The aperture of an imaging system’s lens acts as the pupil (literally, entrance pupil) of the imaging system. The goal is to position this pupil at the same position as the human eye inside the headset.
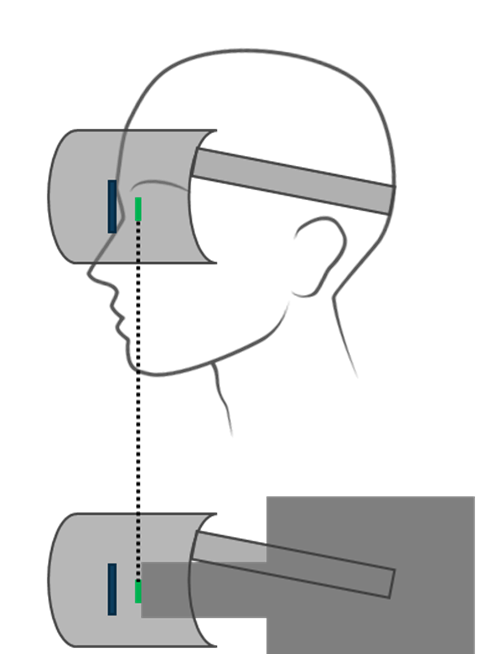
XR display measurement requires positioning the imaging system’s entrance pupil at the same position as the human pupil in the headset. Image credit: Radiant Vision Systems
However, if we use a standard lens aperture for measurement, this lens aperture is located inside the lens, or “buried” in the lens’s optical stack. From this position, the imaging system’s pupil is unable to capture the full field of view of the display without occlusion by the headset hardware.
A front-located aperture allows us to position the measurement pupil where the eye would be. When applying this aperture position with wide-field-of-view optics, we can now measure the same field of view that the user sees.
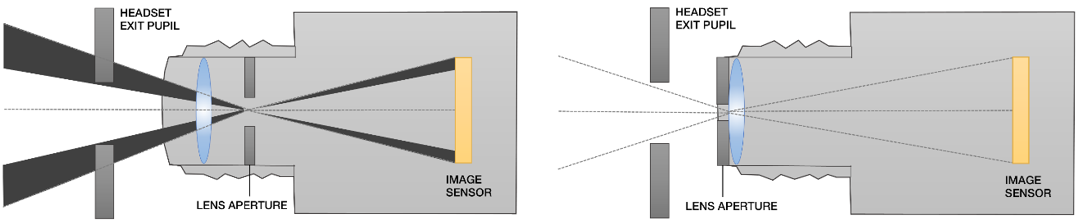
A “buried” aperture cannot capture the full field of view of the display beyond the headset hardware (left); this is solved by designing an aperture at the front of the lens of the measurement system. Image credit: Radiant Vision Systems
Radiant offers a few wide-field-of-view lens solutions designed with this aperture position specifically for XR display testing.
Our lens options capture up to 120 degrees horizontal field of view, covering the area of standard human binocular vision. Lenses are developed to pair with any Radiant imaging colorimeter or photometer, with resolutions up to 61 megapixels.
Covering this field of view with this resolution, we can capture nearly 80 PPD, which is beyond standard human visual acuity (60 PPD, as discussed) and the PPD of today’s XR displays.
What is the trade-off between measurement resolution, field of view, and PPD?
If we take our 61-megapixel measurement system as an example, we get 80 PPD across the maximum human binocular field of view of 120 degrees. If we reduce that field of view down to 75 degrees, for example, we get as much as 126 PPD across the display.
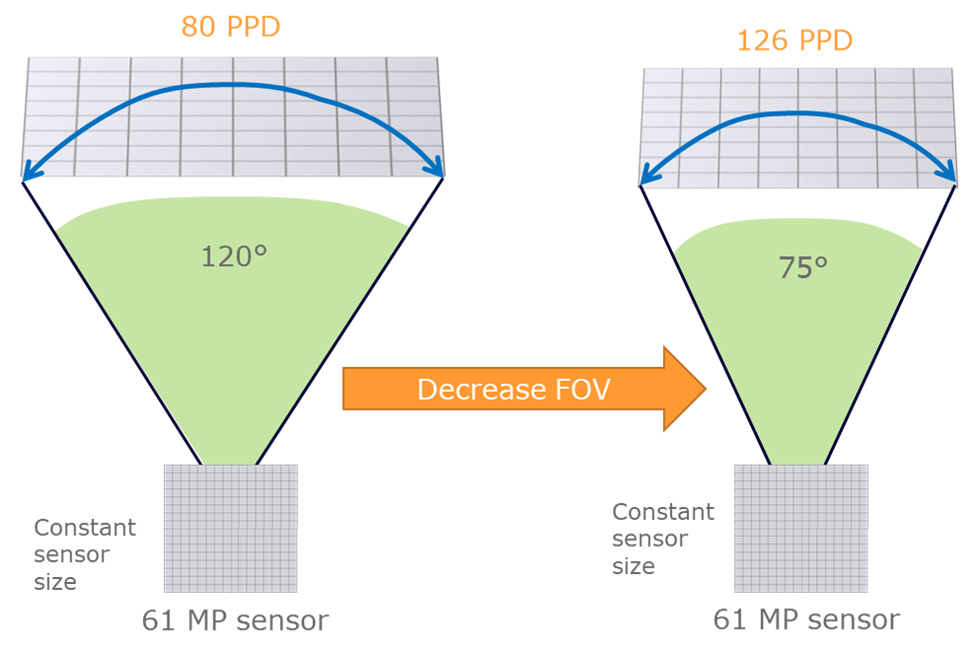
Illustration of how the effective resolution or PPD of the measurement system can be increased by reducing the imaging field of view (while keeping a constant image sensor size). Image credit: Radiant Vision Systems
Reducing the field of view can greatly increase measurement precision when needed. As AR and MR devices typically have smaller fields of view, manufacturers can apply this method of reducing the measurement field of view to increase effective resolution or PPD across the display to test AR and MR displays with the ultimate level of accuracy.
The same concept can be applied within the XR optical design itself. An example of this is foveated or multifocal rendering. The basis of the concept is that the visual acuity of the human eye is highest in the fovea region, which is only about 10 degrees field of view.

Example of foveated rendering, where resolution of the headset is designed to be highest in the fovea / focus area. Source: Tobii
If the highest resolution is only needed across 10 degrees, achieving 60 PPD in this area would only require a 1K resolution display. This can reduce the cost and, of course, the size of the display components.
What are challenges in measuring foveated displays?
Foveated visualization is realized in different ways. In one method, two display sources could be combined to produce an image with higher resolution in the fovea region and lower res in the peripheral region. Other methods use lenses to vary the optical paths.
We need to address two challenges in measurement: different displays and different focal distances.
In cases where two displays are used in the headset, we need to measure both. Dual display testing requires that we coordinate test images across both screens so that the measurement system can capture the resulting composite image just as a human user would view it through the headset.
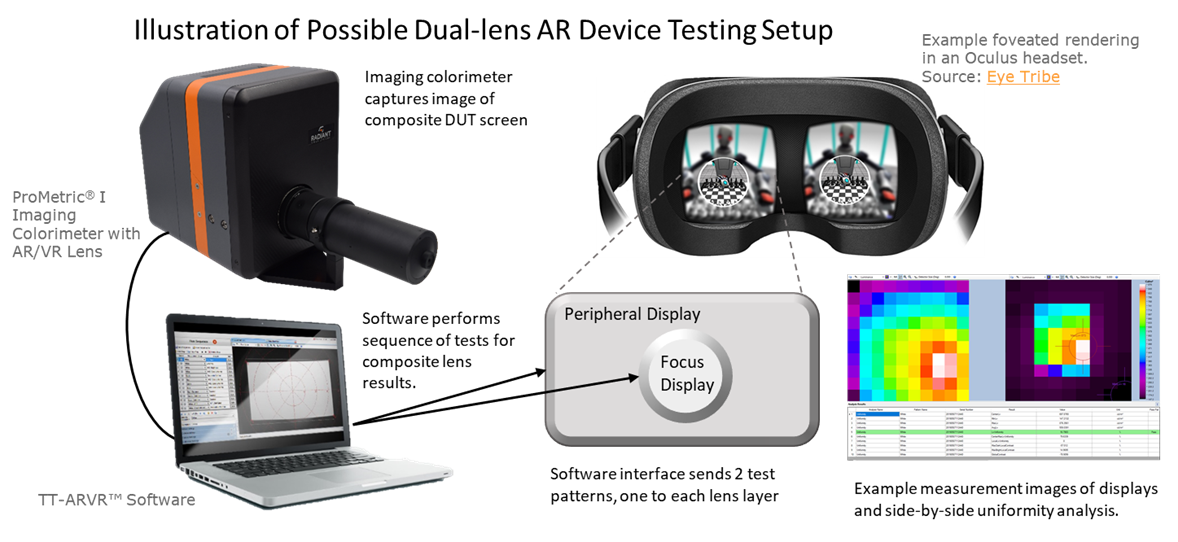
An example dual-lens device testing setup using Radiant’s ProMetric I Imaging Colorimeter with AR/VR Lens and TT-ARVR™ Software. Image credit: Radiant Vision Systems
In this solution, we can interface between the measurement system and the XR device to control both displays independently. Analysis software can facilitate side-by-side or composite analysis to look at the properties of each display and their effects on foveated visualization.
To account for focus, the measurement system should respond like the human eye. Like the eye, an imaging system’s focal point should adjust to meet the depth of perceived virtual objects. However, images projected at two or more focal points demand more from the measurement system’s optics than can be accomplished with a traditional fixed-focus lens.
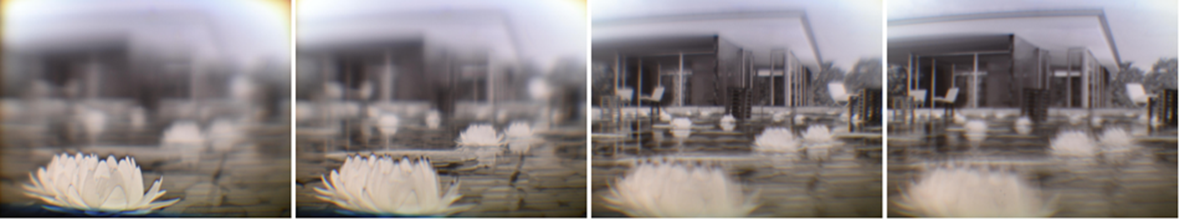
Example from a varifocal VR display using liquid lens optical system. Source: Chang et al., 20181
Radiant chose to apply electronic lenses in our XR measurement systems, which are controlled by software to optimize focus and aperture settings for precise imaging depths.
Using electronic focus, Radiant’s XR lenses enable designers to quickly adjust to new depths within a particular scene to ensure image clarity for accurate measurement. In an automation routine, electronic lenses can be adjusted in sync with projected test images as part of a test sequence.
Electronic lenses reduce risks associated with manual lenses when regular focal adjustments are needed. Imprecise lens settings increase measurement errors. For instance, out-of-focus images may obscure a pixel defect within the display. Focus also has a significant impact on MTF (modulation transfer function) measurements, where poor focus of the measurement lens could yield a poor MTF result, even when the display has no actual defect.
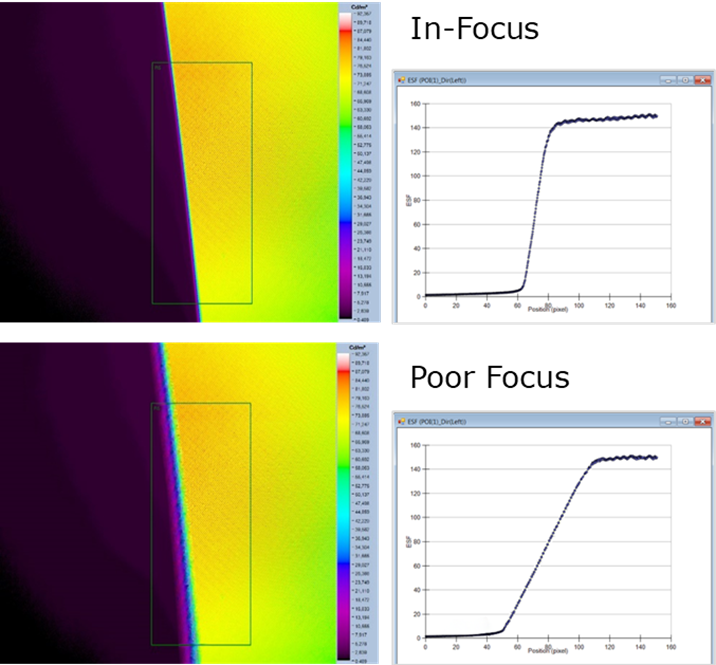
Measurement images in TrueTest™ Software applying a Slant Edge MTF test to an in-focus (top) and out-of-focus (bottom) image, with respective MTF data plots. Image credit: Radiant Vision Systems
Electronic focus is critical for capturing projections at variable depths, especially where tolerances are as precise as XR focal planes.
What are various testing methods that Radiant uses to test MTF?
Testing for MTF can tell us how optical components are performing in terms of transmission and reflection of light and how this affects the perceived sharpness of the final image.
We apply three MTF test methods at Radiant: Slanted Edge Contrast, which measures the ratio between black and white areas of a slanted edge; Line Pair Method, which measures similar values between closely spaced vertical and horizontal lines; and directly measuring the Line Spread Function, or LSF.
Although high resolution is desirable for an XR test system, there are factors to consider. An MTF measurement by a high-res camera can unintentionally resolve the display pixels, measuring contrast between the pixel separation and thus, impacting the final MTF result.
Radiant has incorporated a new Line Spread method within our XR test suite to account for this issue. Instead of displaying an edge for Slant Edge MTF, a discrete line of illuminated pixels is shown. Here, we’re directly measuring the LSF, or Line Spread Function, by characterizing the transition of the line, and we can get a more accurate result that is not affected by the pixel space captured within the high-res image.
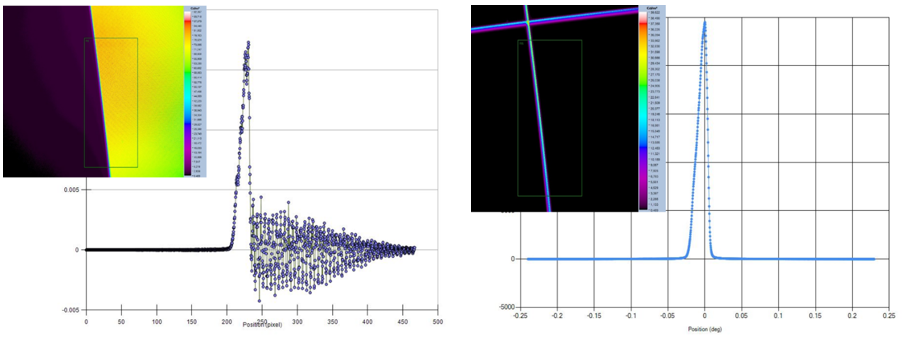
Using a high-resolution measurement system, an MTF Slant Edge test (left) resolves spaces between the display pixels, as shown by variations in the plot. Radiant’s Line Spread measurement method (right) characterizes transitions over the line to get a more accurate MTF result. Image credit: Radiant Vision Systems
Are there considerations for measuring waveguides?
Waveguides enable see-through AR and MR device designs in a variety of compact form factors. The waveguide layer can have different geometrical structures, including reflective, polarized, diffractive and holographic.
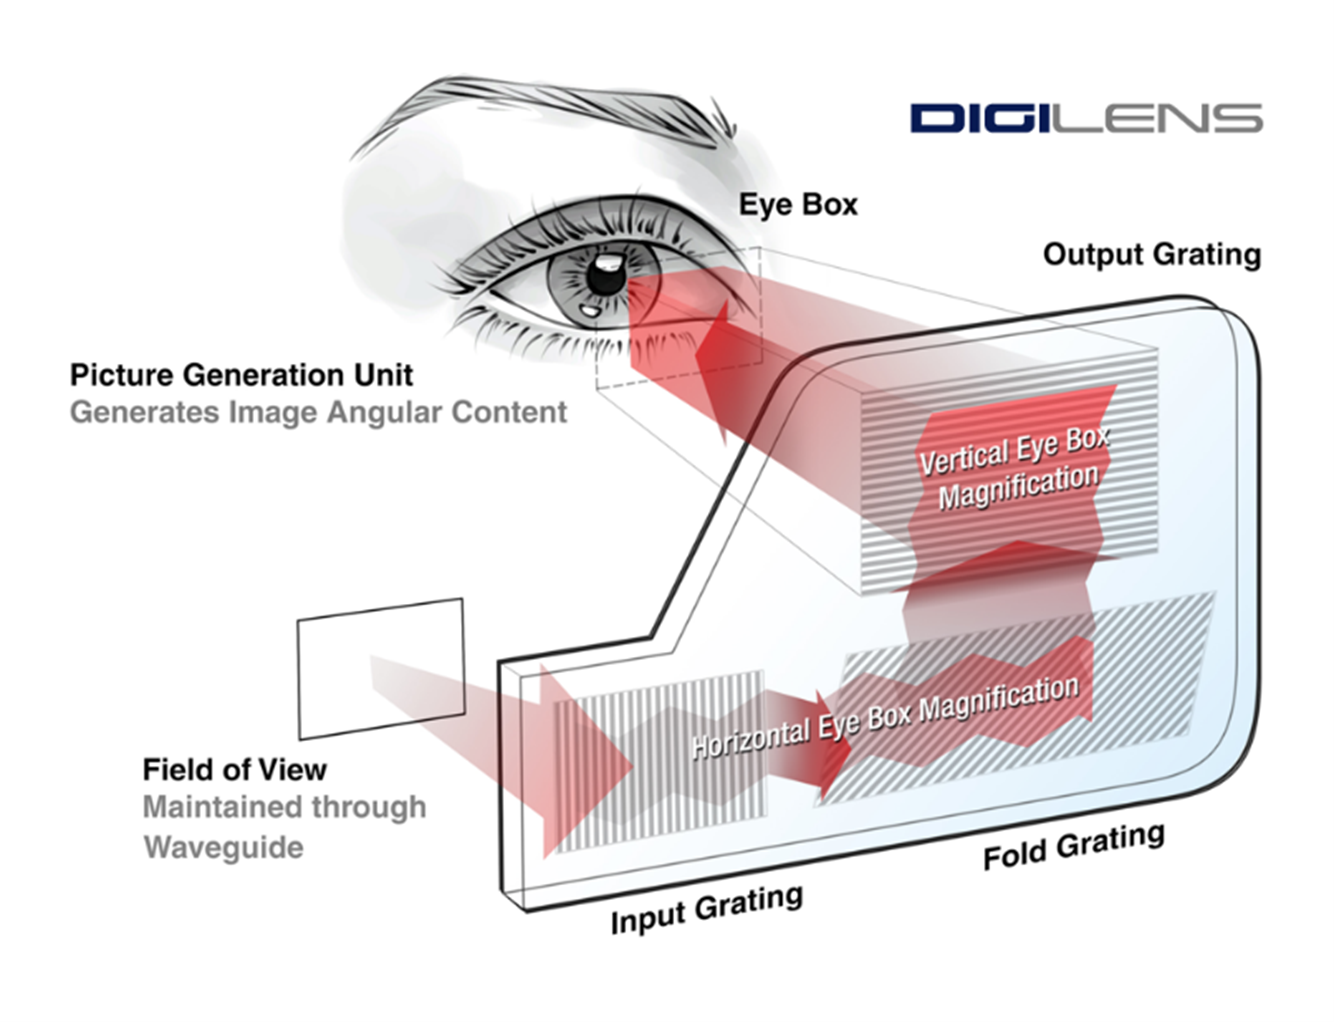
Illustration of a waveguide combiner. Source: DigiLens
The physical properties that help guide the light in these cases could be prisms, mirror rays, gratings and even metasurfaces, all taking a range of unique forms.
Light that is guided through an optical component is always impacted in some way by the physical properties of the component. By the time light from the waveguide reaches our eye, it’s already bounced many times through the optical structure. This has an impact on optical efficiency.
This means light energy is reduced as it travels from the source display to our eye. The results can be poor brightness, contrast and clarity perceived in the virtual image. This is especially important to control in see-through AR/MR designs where superimposed images must be visible in a range of ambient lighting conditions.
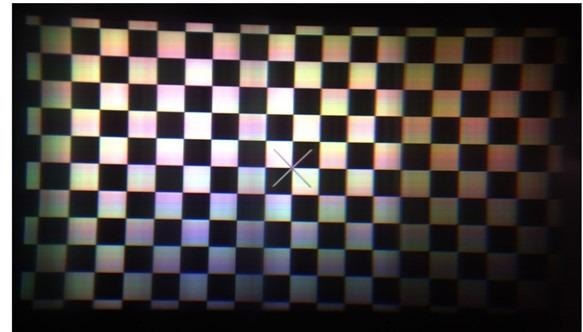
Projection from a diffractive waveguide exhibiting brightness non-uniformity and color tones on mid-level gray pixels. Source: Wagner et al., 20192
Waveguides can be tested by projecting light through a light source or picture-generating unit and evaluating the resulting image. Brightness, color, uniformity and sharpness should be evaluated using a colorimetric imaging system to obtain absolute values to guide the optical design. These values include luminance and chromaticity and how they change across the image to determine uniformity.
As measurement data is quantifiable, numerical values can be used to compare the quality of measured projections based on different structural changes to the waveguide.
What are the performance considerations for metalenses?
Like waveguides, recent advances in metasurfaces have yielded ultra-thin, lightweight, flat metalenses for XR headsets. Metalenses apply 3D nanostructures to change the polarization, intensity, phase and direction of incoming light waves. These waves can be focused by these structures into almost any form.
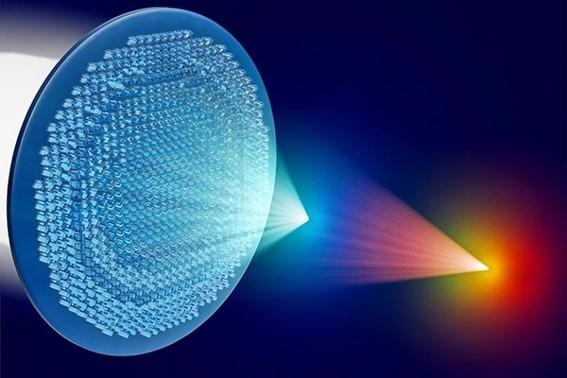
Illustration of light refraction and direction by a metalens. Image credit: Giuseppe Strangi & Federico Capasso
In AR, metalenses sit in front of the eye with the display in the metalens’ focal plane. Light from the display is focused onto the retina by the metalens, forming the virtual image, which is overlaid onto the scene viewed through the glasses.
While metalenses have design advantages, they also have lower optical efficiency than traditional lenses. Like waveguides, this is observed as reduced brightness, contrast and clarity.
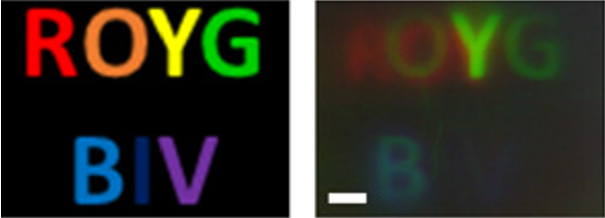
Original image (left) and image projected through a metalens (right) exhibiting chromatic aberration and loss of intensity. Source: Zhou et al., 20203
It is also difficult to place nanoscale structures on such small components. Imprecise metalens fabrication can cause chromatic and wave aberration and reduced focus performance. This is observed as poor intensity distribution, color uniformity and low clarity.
A microscope can be useful for testing metalenses, especially since these components are incredibly small. To isolate measurements to the metalens, the component can be illuminated using an LED light source. The imaging system can then capture the output image for evaluation.
Can you describe the optical components that enable tracking and sensing?
Near-infrared light is one of the predominant signals used for sensing in XR. Near-infrared wavelengths are above the visible spectrum, so they’re not distracting when cast into a user’s field of view.
Near-IR sensing systems function by receiving a signal from the environment. Light is cast by a source and illuminates an area for an IR camera to see the environment. When pulsed or cast in dot patterns, near-IR light can be used to determine object depth as well as curvature.
Sensing applications rely on either LED or laser light sources to produce near-IR emissions. Both types of sources can be used to enable object detection, identification and tracking.
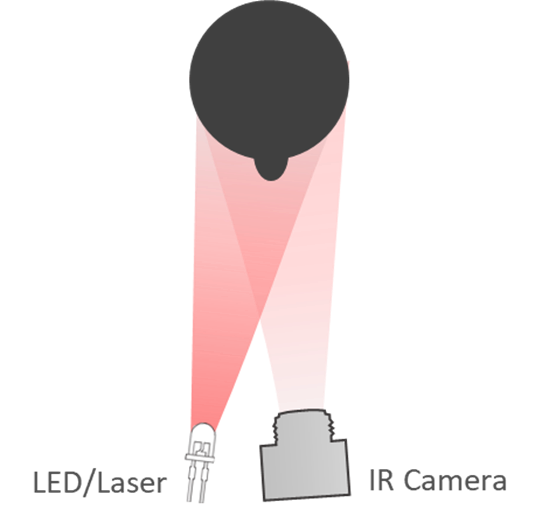
Illustration of near-IR light cast by an LED or laser light source, reflected off of an object, and captured by an IR-sensitive camera. Image credit: Radiant Vision Systems
An eye-tracking system detects the movement of the user’s gaze as well as pupil dilation to adjust visual elements within the headset accordingly. This is done by integrating near-IR LEDs around the eyepieces of the headset.
Eye-tracking can be used to improve visualization through foveated rendering. For example, optics can be adjusted in response to the eyes’ rotation.
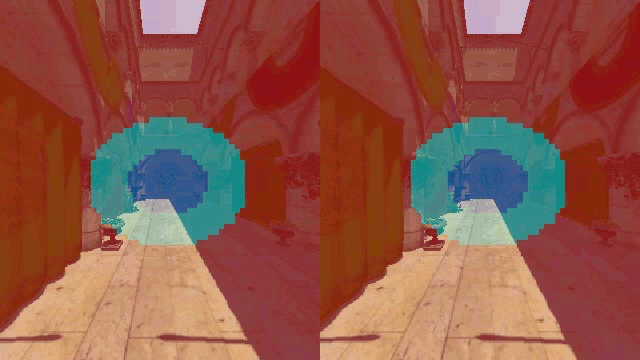
Example of how NVIDIA applies eye tracking to enable “Variable Rate Shading” (processing more pixels in the area of focus / blue circles). Source: NVIDIA
Spatial positioning, proximity detection, and hand and controller tracking can be enabled by near-IR LEDs as well.
What are the considerations for measuring near-IR light source performance for sensing?
Near-IR LEDs and lasers used in sensing applications must be measured, like any light source, to ensure that they provide adequate and accurate illumination. Sources are measured for radiant intensity to ensure the light that they emit is powerful enough to be detected by IR cameras.
A sufficient signal is needed from the light bouncing off of targets and objects to distinguish them from the background, just like sufficient visible light is needed to capture an object in a photograph.
Near-IR light source performance is also determined by the integrity of the light distribution. Understanding the hotspots and uniformity of distribution can tell us whether the light is directed appropriately or if there are any trouble areas. The same is true whether we’re casting a uniform beam of light or dot patterns from a diffracted laser.
What are some methods used to measure light source distributions?
Since light is emitted in angular space, measurement of the angular distribution is needed to evaluate the source’s performance. The solution requires an imaging radiometer. This kind of system measures light power rather than light the way it is perceived by a human eye.
The first method for angular light source measurement involves the use of goniometers. Goniometers capture the complete output of a light source in three-dimensional space. They do this by rotating the imager and a source relative to one another, measuring light distributions at every angle.
This method offers the most complete data, and it is great for light source modeling, but it can take hours and requires bulky equipment, so it’s not necessarily practical for production inspections.
Light can also be cast on a wall or a screen to measure the reflection or irradiance with an imaging radiometer. This method offers a limited angular field of view and does not measure the direct radiant intensity of a source, but it can be used for a pass-fail pattern match, especially for laser dot patterns.
Lastly, a Fourier optic lens or conoscope lens can capture the direct angular radiant intensity of a light source without the time, cost and equipment required for complete rotational measurement. This solution provides a good balance of speed and data for production testing.
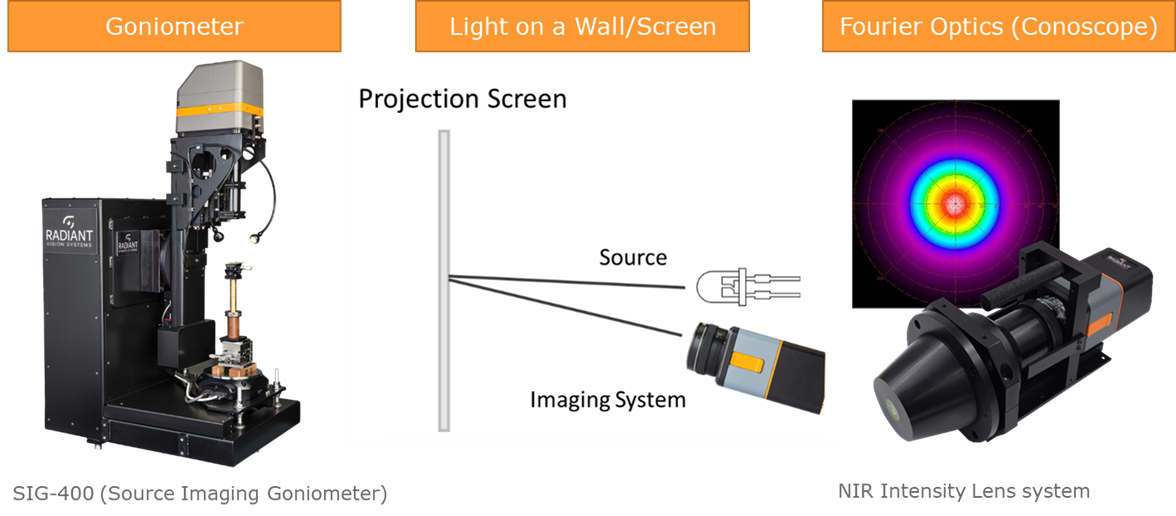
Three methods for light source measurement: Goniometric, cast on a wall, and using Fourier optics (also called a conoscope lens). Image credit: Radiant Vision Systems
Fourier optics work by capturing a directional distribution of light rays emanating from a single point and then transforming them to a lateral distribution. This allows the connected imaging system to be pointed directly at the light source to image the entire visible cone of angular light rays on a single plane (its internal image sensor). Diffracted lasers can also be evaluated by Fourier optics to determine the spatial position of dots in azimuth and inclination, and also evaluate their quality in terms of radiant intensity, uniformity, and distribution.
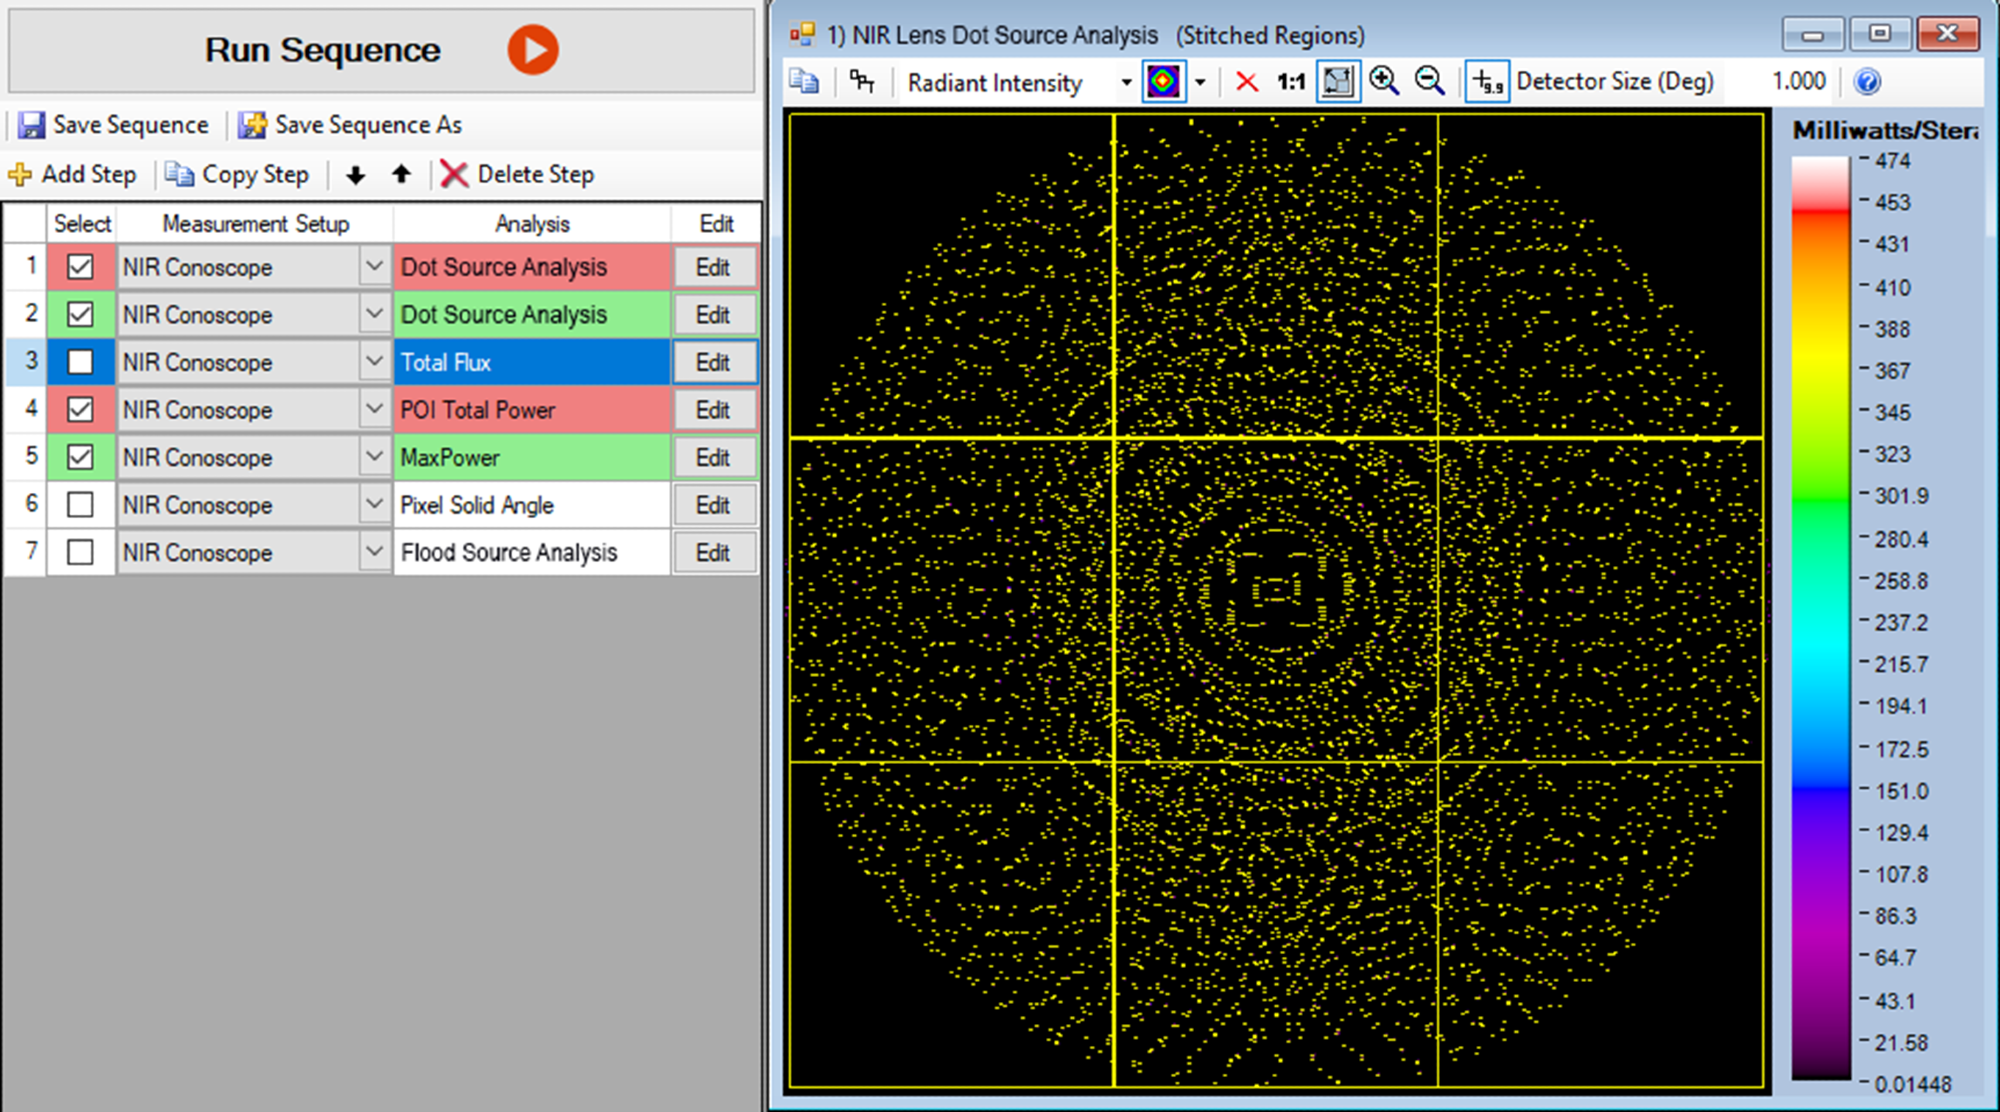
Measurement image in Radiant’s TT-NIRI™ Software showing analyses on thousands of dots produced by a diffracted near-IR laser. Captured using Radiant’s Fourier-optic NIR Intensity Lens. Image credit: Radiant Vision Systems
Once an XR headset is assembled, how does the measurement system get inside to measure the display?
As we discussed, we want to position our imaging system’s aperture or pupil at the human eye position in headsets in order to evaluate the complete viewing experience.
However, a camera lens is usually long and straight - and the overall measurement system is typically not in the shape of a human head. If we still want to get our lens aperture to the intended pupil position, we need to approach the display from a different angle.
Using a folded lens design, we can fit our measurement system’s aperture at the same near-eye pupil position without interference from any headset hardware. The basic principle is that a fold mirror inside the lens directs the light from the display through our imaging system’s sensor, located 90 degrees perpendicular.
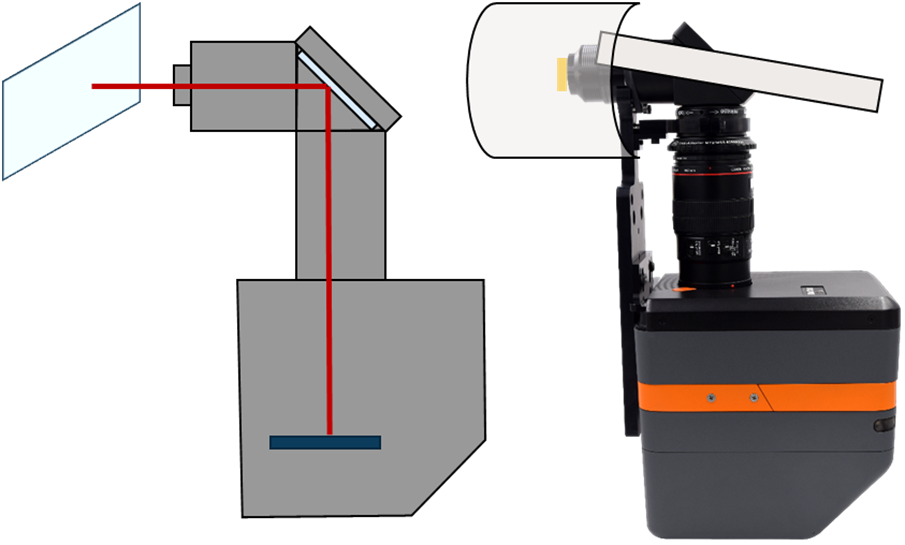
Radiant’s ProMetric Imaging Colorimeter paired with the XRE Lens (folded configuration). (Left: the optical path from the display, reflected by the internal fold mirror, and directed toward the image sensor; right: the XRE lens with entrance pupil at the eye position in the headset.) Image credit: Radiant Vision Systems
We still use wide-field-of-view optics, so we’re still able to capture the complete view of the projected display from a near-eye position. Additionally, both Radiant’s fold and non-fold lens designs offer an electronic focus for imaging at any perceived distance.
Can the XR display be measured from both eye positions at once?
Based on either fold or non-folded configurations, Radiant can provide a dual-eye measurement solution, where two lenses are fit within the same headset.
If needed, we can configure our measurement software’s pattern generator to push test images to two different displays, as we did with the foveated dual display measurement, or in the case of a single display, we can simply capture two perspectives of the same test image pushed to a single display in the headset.
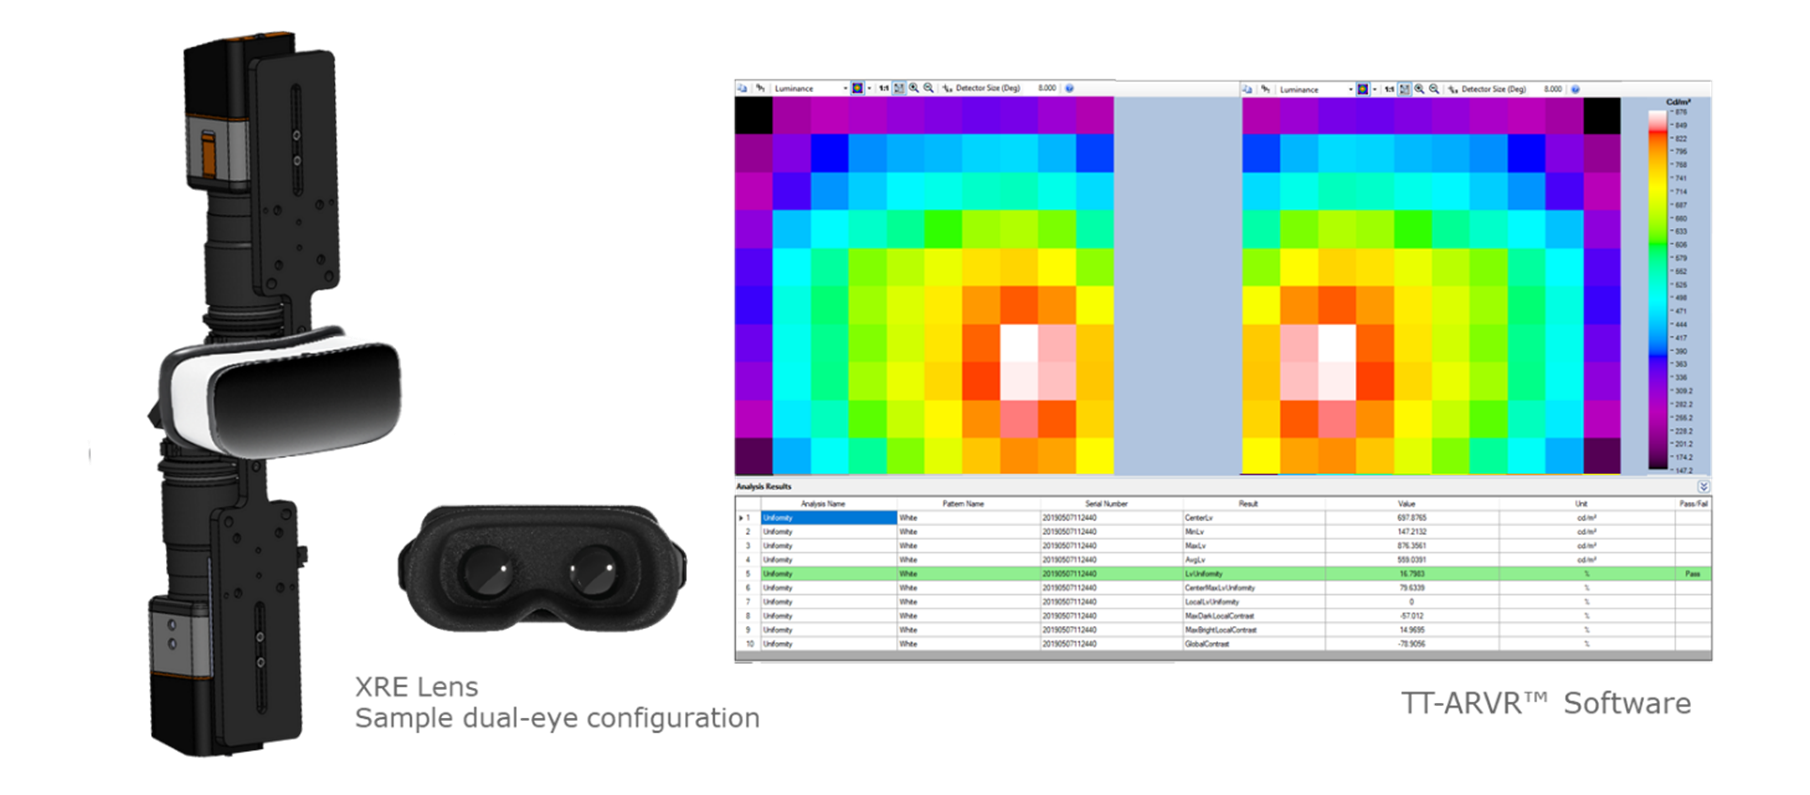
Example of a dual-eye measurement setup using two folded XRE Lenses and TT-ARVR analysis software. Image credit: Radiant Vision Systems
The two imaging systems can acquire measurement images at the same time, and the software can perform evaluations, facilitating side-by-side analysis of left and right eye fields of view. We can also perform differential measurements of left- versus right-eye images to ensure these images are equivalent and any discrepancies in brightness, color, contrast, clarity, or other factors are calculated.
How is a measurement system applied in fully automated production inspection?
Production efficiency requires automation, integration ease and flexible hardware options to meet a range of the manufacturing criteria. Our folded lens optics with electronic lens control help us visualize the XR projection from any angle or space, even measuring the view from two eyes at once.
But the measurement hardware is just a small part of the overall manufacturing engine. In order to provide information for other processes, the system needs to be integrated in some way.
Central to automating measurements for production level inspection is the software. Radiant’s TT-ARVR™ software was developed for visual testing of XR components. It applies analysis functions to evaluate measurement images and features an API to talk to all kinds of equipment. The software pushes test images to the headset and synchronizes measurement functions on the camera. In production, these functions may be further synchronized with test fixtures and robotic positioning.
When the software receives data back from the camera, it calculates the measurements and evaluates images against defined pass and fail parameters. All data is then output to the central manufacturing control system, and commands are reported out to other operations.
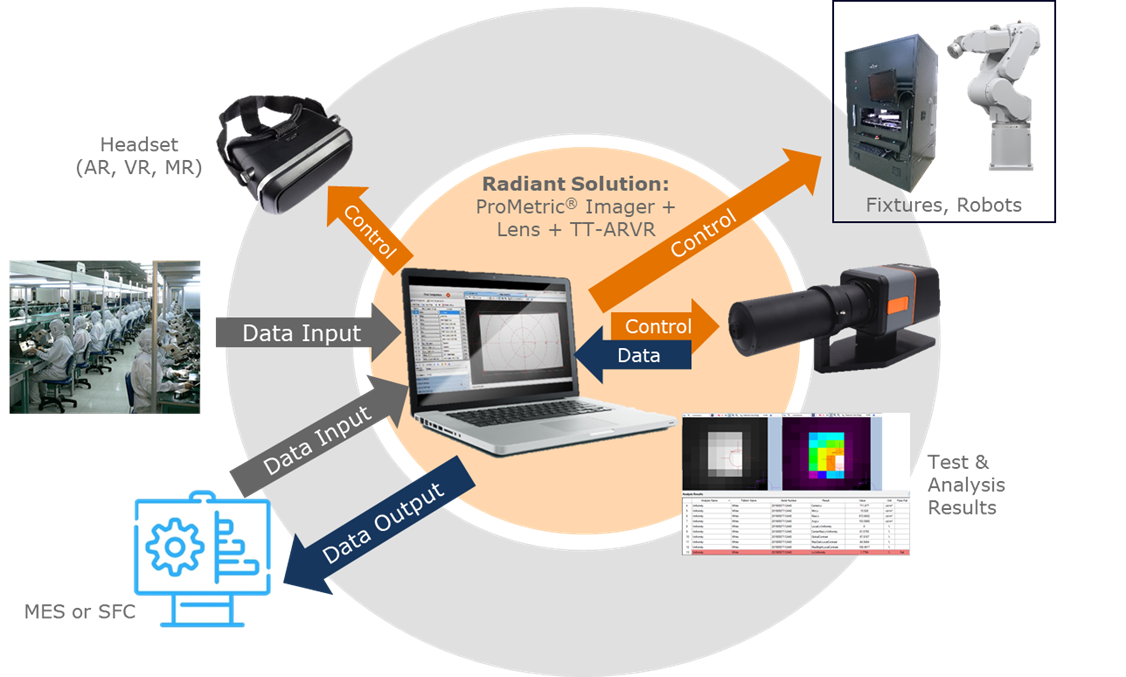
Example of production-level test system integration using Radiant’s TT-ARVR Software, imaging systems, lenses, and other manufacturing systems. Image credit: Radiant Vision Systems
This network requires plenty of expertise, but Radiant’s measurement solutions are geared to support production testing. Test pattern generation, headset display control, camera function and test processes are all run using automation within Radiant’s TT-ARVR software. Beyond this, the software supports a range of programming languages using its built-in API. This allows Radiant to provide the ultimate automated inspection solution for in-line and end-of-line XR testing.
How do Radiant’s solutions benefit manufacturers who are looking to implement optical testing?
There are plenty of optical components and architectures out there in the XR space, with a range of applications but all with a singular goal: to provide high-quality near-eye virtual experiences.
To help manufacturers meet this goal, optical test solutions need to be able to address the performance of each component and the holistic optical design. Most importantly, measurement solutions need to be able to act like the human eye in these cases, seeing what the user sees and evaluating it with objective, quantifiable data.
Radiant offers a suite of XR optical test equipment, pairing our scientific imaging photometers and colorimeters with specialized software and lens designs. The software analysis platform combines tests developed around customer XR applications and is geared towards scientific measurement and evaluation in immersive angular space and variable projection depths. Finally, we provide rapid, fully automated testing to improve efficiency and ease from design to production.
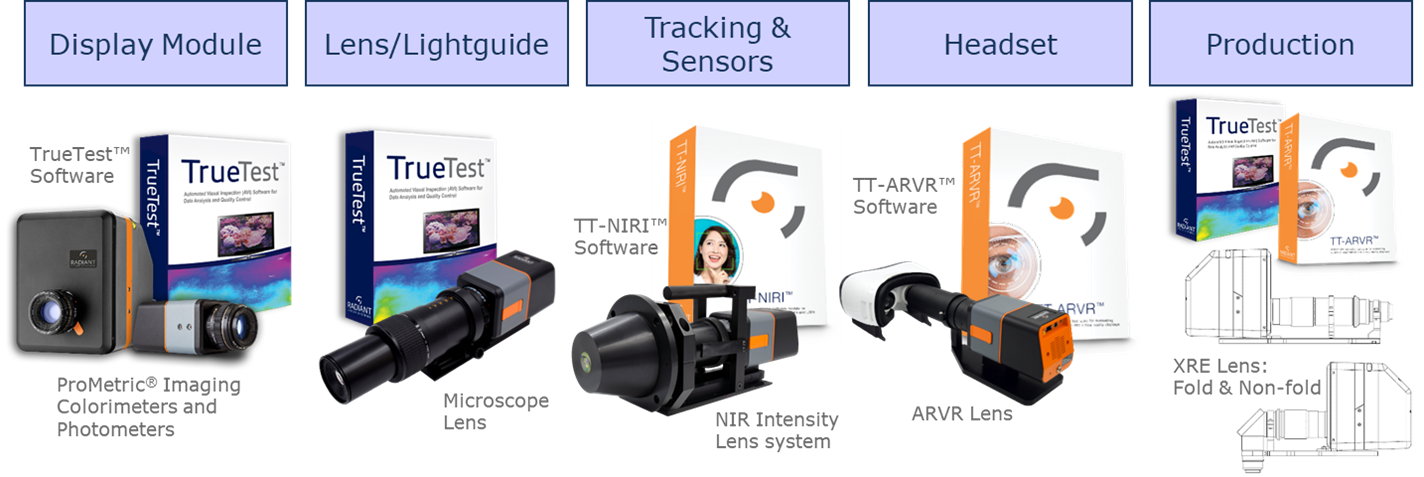
Radiant’s suite of solutions for optical testing at each component stage of XR optical design, from display module evaluation to production-level quality control. Image credit: Radiant Vision Systems
Radiant works directly with manufacturers to develop unique solutions that provide the exact tools they need for every job. With a range of equipment configurations available on the same fundamental measurement platform, manufacturers can measure all XR components from display to lens to lightguide to near-infrared systems with speed and ease.
About Mike Caputo
Mike Caputo is the Sr. Regional Sales Manager for the West Coast for Radiant Vision Systems, covering Washington, Oregon, and California. Before coming to Radiant, he spent 10 years in the machine vision industry solving inspection challenges across a diverse customer base, including Aerospace, Medical, Food, Consumer Electronics, and Packaging
References:
- Chang, J.-H. R., Vijaya Kumar, B. V. K. and Sankaranarayanan, A. C., “Towards Multifocal Displays with Dense Focal Stacks,” ACM Trans. Graph. 37, 6, Article 198, 13 pages (November 2018). https://doi.org/10.1145/3272127.3275015
- Wagner, D., Noui, L., & Stannard, A. (2019, August 7). Why is making good AR displays so hard? LinkedIn. Retrieved February 17, 2022, from https://www.linkedin.com/pulse/why-making-good-ar-displays-so-hard-daniel-wagner/
- Zou, X., Zheng, G., Yuan, Q. et al. “Imaging based on metalenses,” PhotoniX 1, 2 (2020). https://doi.org/10.1186/s43074-020-00007-9

This information has been sourced, reviewed and adapted from materials provided by Konica Minolta Sensing Americas.
For more information on this source, please visit Konica Minolta Sensing Americas.
Disclaimer: The views expressed here are those of the interviewee and do not necessarily represent the views of AZoM.com Limited (T/A) AZoNetwork, the owner and operator of this website. This disclaimer forms part of the Terms and Conditions of use of this website.