The field of biological science has been revolutionized by the invention of high-speed atomic force microscopy. Nevertheless, there are still many phenomena that are hard to be observed owing to their near-instantaneous dynamics. The first step toward observing these biofunctional dynamics is to improve the temporal resolution. To achieve this, the key hindrance has been the narrow bandwidth of the amplitude detector circuit.
Image Credit: dominika zara/Shutterstock.com
In a study published in Applied Physics Letters, researchers created a differential-based ultrafast amplitude detection method devoid of any intrinsic latency with the basic trigonometric theorem. They demonstrated that the method establishes greater performance over the traditional methods concerning the non-invasiveness and bandwidth. This method would be a novel innovation in the development of high-speed atomic force microscopy.
The study considered a differential-based (DB) detection algorithm by altering a proposed phase-shift-based (PSB) algorithm that was recently proposed. This method is straightforward and avoids intrinsic latency; therefore, it is much quicker than traditional methods. The researchers believe that this breakthrough will be an essential component in the faster HS-AFM.
Methodology
A common RMS-DC converter is adopted by the standard dynamic-mode AFM setups. However, its bandwidth is insufficient for HS-AFM applications because adequate ripple suppression needs the time integral across several cantilever oscillation periods.
Hence, three types of amplitude detectors have been proposed previously, which are Fourier-analysis-based (FAB), sample-and-hold-based (SHB), and PSB methods. The theoretical latencies of these methods are schematically summarized in Figure 1.
This study considered a DB method with zero intrinsic latency, resulting in the fastest performance. Further, the study compares and draws contrast of the DB and PSB methods, as they are analogous and demonstrate the utility of the DB method.
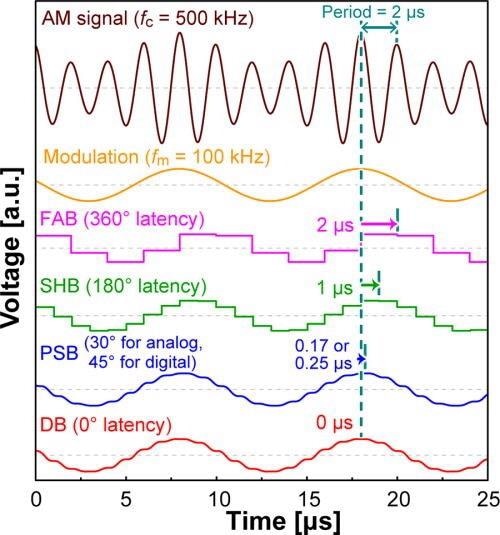
Figure 1. Theoretically simulated output waves of four types of amplitude detectors fed by a 500 kHz sinusoidal wave, whose amplitude is modulated by a 100 kHz sine wave. The horizontal arrows indicate the delay for each detector. Image Credit: Umeda, et al., 2021
The schematics of the PSB and DB methods are shown in Figure 2.
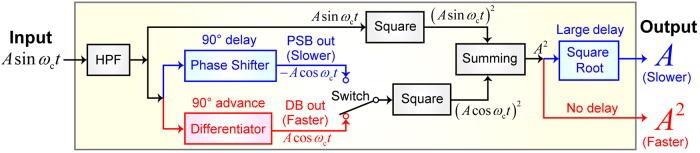
Figure 2. Schematics of differential-based (DB) and phase-shift-based (PSB) circuits. Image Credit: Umeda, et al., 2021
Results and Discussions
In this study, the scientists built two types of DB and PSB test circuits. One of which is an analog circuit using commercial operational amplifiers and the other one is the digital circuit using a field-programmable gate array (FPGA). To exhibit the superiority of the DB method, the frequency characteristics were measured using amplitude-modulated signals with fc of 300–1500 kHz (Figure 3a).
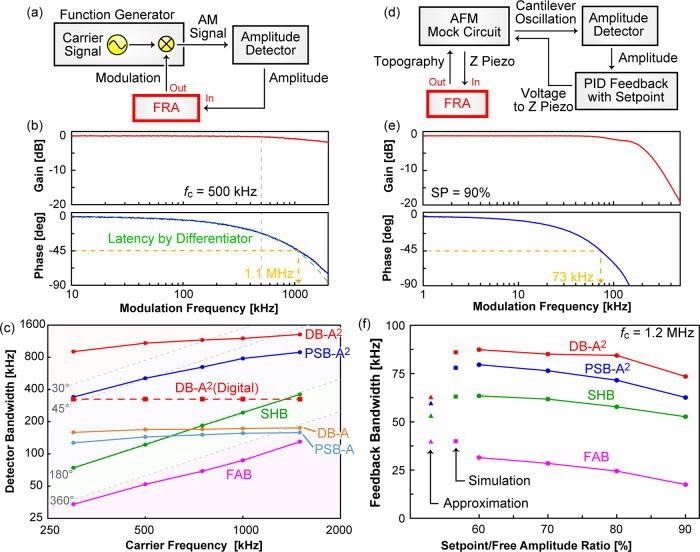
Figure 3. Schematics of the experimental setups (a), (d) and typical frequency response characteristics of the DB-A2 method (b), (e), for detector (a), (b) and feedback (d), (e) circuits. In (b), green broken curve indicates a theoretical fitted line by the dead time theorem. (c) Dependency of detector bandwidth on carrier frequency. (f) Dependency of feedback bandwidth on the setpoint/free amplitude ratio. Theoretical values calculated by approximate equation (▲) and simulation (■) are also displayed. For the calculations, the phase delay of SHB and FAB (190° and 540°) was taken from the data shown in Fig. 3(c), while those of DB-A2 and PSB-A2 (50° and 90°) were taken from the experimental data obtained with HPF (data are not shown). Image Credit: Umeda, et al., 2021
From the spectra achieved, it was shown that SHB and FAB produce dips at the harmonic frequencies of fc when PSB generates a single broad dip at the second harmonics of fc. Therefore, these methods do not create flat gain and phase curves.
Confirming the presence of intrinsic latency, these characteristics were reproduced through simulation. On the other hand, the gain curve of DB-A2 revealed an almost flat characteristic, especially at the frequency below fc (Figure 3b).
This saturated appearance is visible clearly in the DB-A2 digital circuit, while fD was 330 kHz over the entire fc range, as the cutoff frequency of the differentiator circuit correlates with fc, to some extent, whereas digital processing dead time is constant. In the FPGA system, the key latency is from the transceiver (300 ns)—an interface converting the analog signals to digital signals.
The fD was not higher when compared to that achieved by the analog circuit (Figure 3c), however, it surpassed those of the traditional methods.
To measure the superiority of DB in such conditions, the study evaluated fFB by using an AFM mock circuit (Figure 3d). On optimizing the PID feedback parameters under some conditions, the whole feedback circuit’s frequency response characteristics were quantified by sweeping the frequency of a sinusoidal topography wave (Figure 3e).
The fFB was quantified as the 45°-crossover frequency and plotted as a function of the setpoint/free amplitude ratio (Figure 3f).
To verify this hypothesis, fFB was also simulated depending on the closed-loop feedback system and achieved a higher quantitative agreement between the overall experimental and theoretical results regarding the individual amplitude detectors.
Finally, to validate the performance of the DB-A2 method experimentally, HS-AFM imaging of biopolymeric actin filaments was performed with FAB and DB-A2—as they can be easily depolymerized via tip perturbation, and they are ideal for testing the noninvasiveness of the feedback control.
In Figure 4, both the first images presented a clear 36-nm-pitch helical structure. In the FAB result, however, after a 1-second elapse, the filament started collapsing owing to the insufficient feedback bandwidth. On contrary, with the use of DB-A2, the molecule was observed stably and stayed intact for more than 30 seconds due to the significantly quicker feedback operation than that of FAB.
Notably, the noise performance of DB-A2 did not create any feasibility problems in AFM imaging. Also, the study determined that the square conversion makes the amplitude distance dependence steeper by performing force curve measurements. This could, in turn, reduce the invasiveness of bioimaging as a side effect.
Even in many AFM techniques, the amplitude detector is an important device, for example, the bimodal AFM, Kelvin-prove force microscopy, viscoelastic measurements in frequency-modulation AFM, and three-dimensional hydration measurements. In addition, this method can be used for improved phase shift detection in future diverse applications.
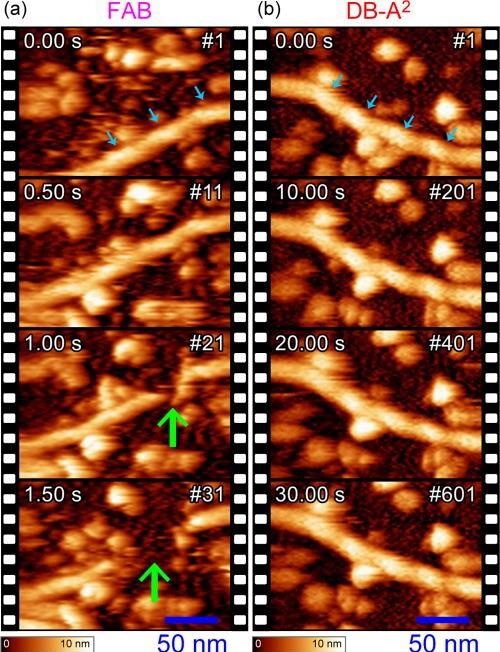
Figure 4. Time-lapse HS-AFM images of actin filaments adsorbed to an amino-silanized mica substrate observed with the FAB (a) and DB-A2 (b) methods. The images represent cropped data around actin filaments, and the original data can be seen in Movie S1. The cyan and green arrows indicate the positions of actin helical pitches and a collapsed part, respectively. Image Credit: Umeda, et al., 2021
Conclusion
The study developed a differential-based amplitude detection method with zero intrinsic latency, which attains significantly quicker performance than traditional methods. This technique can also be used to reduce the invasiveness of AFM imaging, rendering the possibility of observing fragile biomolecules. By successfully winning over the obstacle of the amplitude detector bandwidth, the study has paved the path to increase the temporal resolution of HS-AFM. If the speed performance of the Z-scanner and cantilever are improved, the full potential can be brought out to implementation.
Journal Reference:
Umeda, K., Okamoto, C., Shimizu, M., Watanabe, S., Ando, T., Kodera, N. (2021) Architecture of zero-latency ultrafast amplitude detector for high-speed atomic force microscopy. Applied Physics Letters, 119, p. 181602. Available Online: https://aip.scitation.org/doi/10.1063/5.0067224.
References and Further Reading
- Ando, T., et al. (2001) A high-speed atomic force microscope for studying biological macromolecules. Proceedings of the National Academy of Sciences, 98, p. 12468. doi.org/10.1073/pnas.211400898.
- Kodera, N., et al. (2010) Video imaging of walking myosin V by high-speed atomic force microscopy. Nature, 468, p. 72. doi.org/10.1038/nature09450.
- Uchihashi, T., et al. (2011) High-Speed Atomic Force Microscopy Reveals Rotary Catalysis of Rotorless F1-ATPase. Science, 333, p. 755. https://doi.org/10.1126/science.1205510.
- Ando, T., et al. (2014) Filming Biomolecular Processes by High-Speed Atomic Force Microscopy. Chemical Reviews, 114, p. 312. https://doi.org/10.1021/cr4003837.
- Preiner, J., et al. (2015) High-Speed AFM Images of Thermal Motion Provide Stiffness Map of Interfacial Membrane Protein Moieties. Nano Letters, 15, p. 759. doi.org/10.1021/nl504478f.
- Lin, Y. C., et al. (2019) Force-induced conformational changes in PIEZO1. Nature, 573, p. 230. doi.org/10.1038/s41586-019-1499-2.
- Heath, G R & Scheuring, S (2019) Advances in high-speed atomic force microscopy (HS-AFM) reveal dynamics of transmembrane channels and transporters. Current Opinion in Structural Biology, 57, p. 93. doi.org/10.1016/j.sbi.2019.02.008.
- Shibata, M., et al. (2010) High-speed atomic force microscopy shows dynamic molecular processes in photoactivated bacteriorhodopsin. Nature Nanotechnology, 5, p. 208. doi.org/10.1038/nnano.2010.7.
- Wickham, S. F. J., et al. (2011) Direct observation of stepwise movement of a synthetic molecular transporter. Nature Nanotechnology, 6, p.166. doi.org/10.1038/nnano.2010.284.
- Fantner, G. E., et al. (2010) Kinetics of antimicrobial peptide activity measured on individual bacterial cells using high-speed atomic force microscopy. Nature Nanotechnology, 5, p. 280. doi.org/10.1038/nnano.2010.29.
- Hiramoto-Yamaki, N., et al. (2014) Ultrafast Diffusion of a Fluorescent Cholesterol Analog in Compartmentalized Plasma Membranes. Traffic, 15, p. 583. doi.org/10.1111/tra.12163.
- Fukuda, S., et al. (2021) Faster high-speed atomic force microscopy for imaging of biomolecular processes. Review of Scientific Instruments, 92, p. 033705. doi.org/10.1063/5.0032948.
- Hansma, P. K., et al. (1994) Tapping mode atomic force microscopy in liquids. Applied Physics Letters, 64, p. 1738. doi.org/10.1063/1.111795.
- Miyagi, A & Scheuring, S (2018) A novel phase-shift-based amplitude detector for a high-speed atomic force microscope. Review of Scientific Instruments, 89, p. 083704. doi.org/10.1063/1.5038095.
- Kokavecz, J., et al. (2006) Novel amplitude and frequency demodulation algorithm for a virtual dynamic atomic force microscope. Nanotechnology, 17, p. S173. doi.org/10.1088/0957-4484/17/7/S12.
- Kodera, N., et al. (2006) Dynamic proportional-integral-differential controller for high-speed atomic force microscopy. Review of Scientific Instruments, 77, p. 083704. doi.org/10.1063/1.2336113.
- Umeda, K., et al. (2012) Direct actuation of cantilever in aqueous solutions by electrostatic force using high-frequency electric fields. Applied Physics Letters, 101, p. 123112. doi.org/10.1063/1.4754289.
- Umeda, K., et al. (2019) Atomic-Level Viscosity Distribution in the Hydration Layer. Physical Review Letters, 122, p. 116001. doi.org/10.1103/PhysRevLett.122.116001.
- Amo, C. A., et al. (2017) Mapping Elastic Properties of Heterogeneous Materials in Liquid with Angstrom-Scale Resolution. ACS Nano, 11, p. 8650. doi.org/10.1021/acsnano.7b04381.
- Martinez-Martin, D., et al. (2011) Noninvasive Protein Structural Flexibility Mapping by Bimodal Dynamic Force Microscopy. Physical Review Letters, 106, p. 198101. doi.org/10.1103/PhysRevLett.106.198101.
- Miyahara, Y., et al. (2015) Kelvin Probe Force Microscopy by Dissipative Electrostatic Force Modulation. Physical Review Applied, 4, p. 054011. doi.org/10.1103/PhysRevApplied.4.054011.
- Martin-Jimenez, D., et al. (2016) Atomically resolved three-dimensional structures of electrolyte aqueous solutions near a solid surface. Nature Communications, 7, p. 12164. doi.org/10.1038/ncomms12164.
- Söngen, H., et al. (2018) Resolving Point Defects in the Hydration Structure of Calcite (10.4) with Three-Dimensional Atomic Force Microscopy. Physical Review Letters, 120, p. 116101. doi.org/10.1103/PhysRevLett.120.116101.
- Li, Y. J., et al. (2008) High-Speed Phase-Modulation Atomic Force Microscopy in Constant-Amplitude Mode Capable of Simultaneous Measurement of Topography and Energy Dissipation. Japanese Journal of Applied Physics, 47, p. 6121 doi.org/10.1143/JJAP.47.6121.
- Miyata, K., et al. (2017) Dissolution Processes at Step Edges of Calcite in Water Investigated by High-Speed Frequency Modulation Atomic Force Microscopy and Simulation. Nano Letters, 17, p. 4083. https://doi.org/10.1021/acs.nanolett.7b00757.