Oscilloscopes are one of the most important tools in electronics. These testing instruments can be used to visualize a waveform of electrical signals. By transforming an electrical signal into an easy-to-interpret graphical form, it is possible to analyze many of the properties of the detected signal, such as its frequency and amplitude.
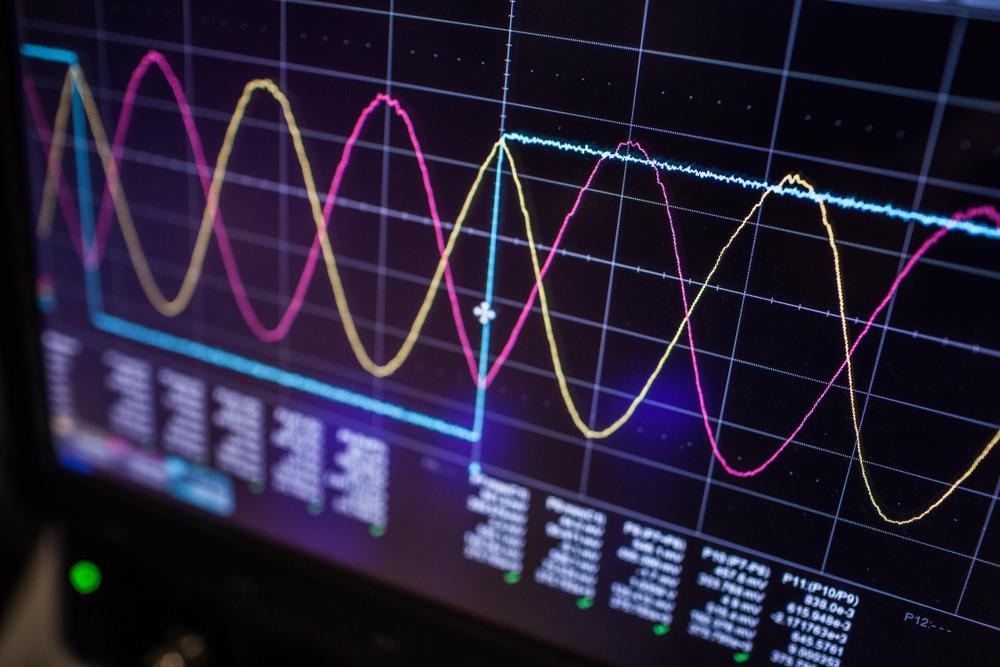
Image Credit: l i g h t p o e t/Shutterstock.com
For electronic circuits and more complex devices to function correctly, the signal properties must be correct. This is why oscilloscopes are such a powerful diagnostic tool.
On an oscilloscope display, the x-axis represents a time interval, and the y-axes corresponds to a frequency. Many electrical signals are pulsed, meaning their intensity is modulated as a function of time. The pattern of this modulation is often repeated, forming a wave. The repeated part of the signal sequence is known as a cycle and an oscilloscope will display this as a waveform.
The waveforms of electrical signals often have particular shapes, such as square and sine waves, depending on whether the rate of change of voltage switch is near-instantaneous or more gradual with time.
Many oscilloscopes have multiple channels that can measure several waveforms simultaneously. In this case, it can be interesting to look at the properties of the individual waveforms and compare differences between them – for example measuring phase shifts which are a measure of the difference in timing between two otherwise identical waves.1
Detecting Oscillations
Digital oscilloscopes use a probe to ‘connect’ to the device’s circuit being tested. Many probes use resistors to attenuate the measured voltage, which can then be compensated for on the readout of the oscilloscope. However, it is crucial that the probe does not distort the electrical signal of the device in any way.
Oscilloscopes have a given sampling frequency which determines how many measurements the oscilloscope can make in a given time. The sampling frequency of the oscilloscope must be shorter than the frequency of the wave being measured to correctly sample a waveform and reproduce the signal with no distortions.
For electronic signals, making transistors that can transmit frequencies in the GHz range is very challenging. While there are now several two-dimensional materials that can be used to fabricate transistors offering transmission frequencies in the hundreds of gigahertz range, moving towards higher frequencies is pushing the limitations of conventional electron-based circuitry and poses a significant number of design challenges.2
Light Movement
One solution to the need for higher device operating frequencies has been to move to optical-based devices. Photons travel at the speed of light and can be used to encode signals in a similar way that conventional electronic circuitry can. This has already become widely used in the telecommunications industry, where fiber-optic cables are now the technology of choice for infrastructure.
Building full optical analogs to traditional electronic circuits means being able to create devices such as transistors that use photons rather than electrons.3 It also means the need for optical analogs of tools such as oscilloscopes. For fiber optic cables, reflectometers that measure differences between transmitted and received signals can be used4, but an ideal diagnostics instrument would need to recover information such as the phase and amplitude of the electromagnetic light fields.
Optical Oscilloscope
Recent work from the University of Central Florida has led to the development of the first optical oscilloscope, capable of resolving an averaged light ‘pulse’ and the phase information within it.5 This new chip can reveal the complete characterization of a laser waveform by using a sub-cycle optical gate.
The chip works using a combination of beam splitters and few-cycle infrared pulses with a longer second harmonic pulse. These are then split and combined so the weaker pulse causes a small perturbation of the more intense few-cycle field. This change can be detected in a spatial displacement of the pulse that can be captured on an imaging sensor.
The intense 3.4 µm pulse is sufficiently powerful to multiphoton ionize the silicon in the imaging sensor and lead to the formation of charge packets of sufficient magnitude that can be detected. When the mid-infrared pulse is perturbed, this affects the ionization probability and in turn modulates the detected photocurrent.
As the infrared and perturbing beam are overlapped in a crossbeam geometry with cylindrical focusing, the time delay between the pulses maps onto the transverse spatial coordinate of the recorded image.
This is the first time that it has been possible to make a phase-resolved single-shot measurement of a few-cycle waveform. While the generation of attosecond pulses from a variety of laser and X-ray sources is now possible, one of the challenges for these experiments is truly characterizing the pulse – something this new optical oscilloscope is ideally suited for.
References and Further Reading
- Hickman, I. (2001). Oscilloscopes. Newnes.
- Zeng, S., Tang, Z., Liu, C., & Zhou, P. (2021). Electronics based on two-dimensional materials : Status and outlook. Nano Research, 14(6), 1752–1767. https://doi.org/10.1007/s12274-020-2945-z
- Miller, D. A. B. (2010). Are optical transistors the logical next step? Nature Photonics, 4(1), 3–5. https://doi.org/10.1038/nphoton.2009.240
- Bogachkov, I. V., & Trukhina, A. I. (2018, July). Early diagnostics of the pre-accident optical fiber sections by using Brillouin reflectometer. 2018Systems of Signal Synchronization, Generating and Processing in Telecommunications (SYNCHROINFO) (pp. 1-6). IEEE, 10.1109/SYNCHROINFO.2018.8457022
- Liu, Y., Beetar, J. E., Nesper, J., Gholam-mirzaei, S., & Chini, M. Single-shot measurement of few-cycle optical waveforms on a chip. Nature Photonics. https://doi.org/10.1038/s41566-021-00924-6
Disclaimer: The views expressed here are those of the author expressed in their private capacity and do not necessarily represent the views of AZoM.com Limited T/A AZoNetwork the owner and operator of this website. This disclaimer forms part of the Terms and conditions of use of this website.