The article evaluates the ability of pinhole-type lightfield monitors to provide a convincing 3D experience—images with enough brightness and continuous aspect. The research was published in the journal Optics Express.
Lightfield imaging technique enables the capture and display of 3D information from 3D scenes procured from computer simulations or the real world. It also has other various applications like carrying out digital refocusing, obtaining depth maps, discarding occlusions, or facilitating object recognition.
In lightfield systems, a 2D array of 2D elemental images of the provided surface 3D object is created by a microlens array and recorded by a CCD. The recorded elemental images are displayed by an optical device, such as an LCD, in front of another microlens array to reconstruct the 3D image.
Numerous methods for displaying lightfield images were generated in the past few years, however, they had their own set of disadvantages. The drawbacks were the limited viewing angle due to the properties of microlenses and chromatic aliasing that occurs in the display of non-monochromatic images. To address these drawbacks, numerous methods were developed.
A technique to address chromatic aliasing is employing pinhole arrays instead of microlenses, as pinholes do not have any refraction power. However, one major question remains - the use of an optimum value for the pinhole size that enables the observers to have a sufficient 3D experience. The pinholes should be small in size, but small pinholes give rise to dotted-like display aspects, and images with very low brightness.
This article intends to confirm the utility of pinhole arrays for effective lightfield display. The researchers devised a psychophysical test particularly adapted for lightfield monitors. This was based on stereoacuity measurements employing modified binary search (MOBS) to analyze the 3D capability of pinhole-type monitors. The stereoacuity measurements were analyzed.
Methodology
Lightfield Monitor
In lightfield technology, 3D images are shown by lightfield monitors, which are autostereoscopic—they do not need any type of special glasses—and display polychromatic 3D images with full parallax. The observer can adjust her/his accommodation and visual-axes convergence.
In a traditional lightfield monitor, an array of microlenses (MLA) are kept in front of a pixelated screen (OLED, LCD, AMOLED, etc.) and faces problems from the fact that any microlens has its optical center and hence light from various sub-pixels is refracted to different directions (see Figure 1).
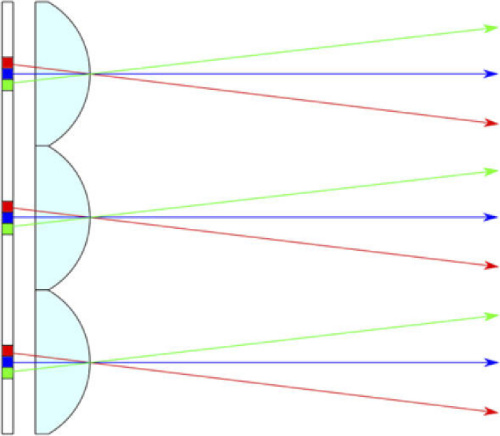
Figure 1. Light passing through the microlens from individual sub-pixels. As can be seen, the amount of light of a given color depends on the observation angle. For simplicity, the picture shows only 3 sub-pixels per microlens. Image Credit: Kopycki, et al., 2021.
The study to elaborate chromatic aliasing showed the lightfield image projected on the pixelated monitor (Figure 2a). To construct the lightfield monitor, a microlens array was placed at the focal length distance from the pixels and aligned with the microimages. The displayed image (Figure 2b) showed chromatic patches that follow a periodic pattern.
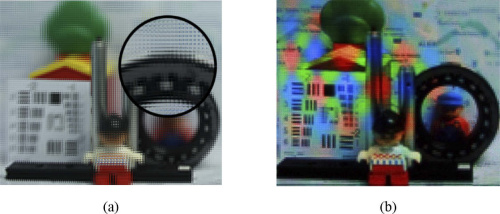
Figure 2. Real example of chromatic aliasing when the lightfield monitor is equipped with an MLA. (a) The collection of microimages, i.e., the lightfield image, projected onto the pixelated tablet; (b) Displayed 3D image as seen by a monocular observer placed in front of the lightfield monitor. Image Credit: Kopycki, et al., 2021.
Figure 3 shows equipping the lightfield monitor with a pinhole array instead of an MLA to avoid chromatic aliasing.
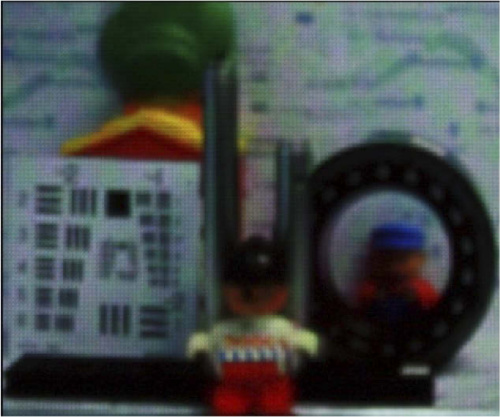
Figure 3. Displayed 3D image as seen by a monocular observer (a photography camera in our experiment) placed in front of the lightfield monitor. In Visualization 1 we can observe the parallax of such an image. Image Credit: Kopycki, et al., 2021.
A movie was captured by moving the photography camera laterally. This ascertains that the pinhole lightfield monitor provides different perspectives based on position and that it solves the chromatic aliasing issue.
Experimental Setup
Numerous questions were still persistent such as offering a convincing 3D experience, the brightness, and if the aspect of the 3D images is continuous.
A test was designed to measure the stereoscopic acuity depending on the classic Howard-Dolman test. The threshold distance was measured using the modified binary search (MOBS) psychophysical method.
Figure 4 shows an example of the measurement sequence.
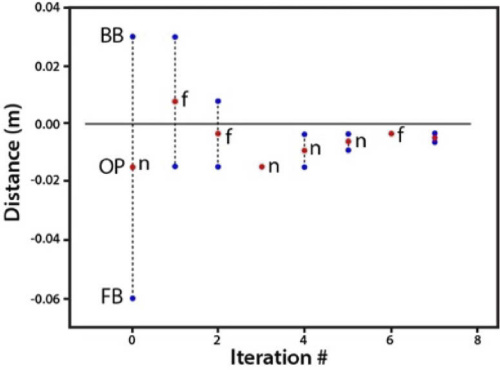
Figure 4. Example measurement sequence. Boundaries of the working intervals in normal trials are marked as blue dots, test positions are marked by the red dots. Single red dots indicate checking points. Observer’s responses are reported as “n” (“nearer”) and “f” (“farther”). Note that the trial for choosing the initial working interval is not shown. Image Credit: Kopycki, et al., 2021.
Image Generation
The initial step for the implementation of the proposed procedure is to develop an algorithm that enables the generation in real-time of the corresponding lightfield images. Figure 5 shows the scheme on which the algorithm is based.
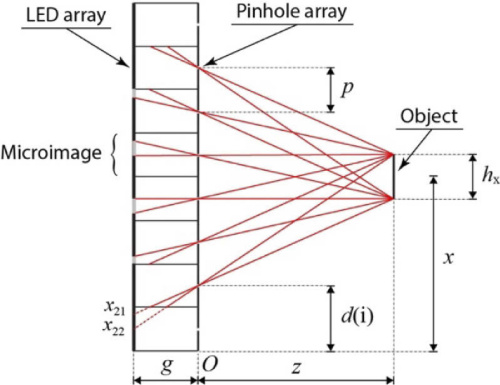
Figure 5. Lightfield image generation. The scheme shows a (x,z) meridian section. Each pinhole has associated one microimage. Note that in our experiment rods are plane objects with width ℎx and height ℎy. The height of the rod covers the vertical size of the tablet. Image Credit: Kopycki, et al., 2021.
The lightfield image corresponding to a given position of the right rod was calculated using the concept. The algorithm would work for every monitor by simply changing the value of pixel size in meters.
To evade the pseudoscopic effect, each microimage is rotated by π radians around its center (Figure 6).
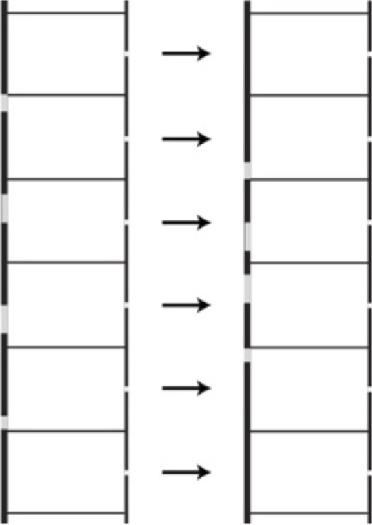
Figure 6. To avoid the pseudoscopic effect, every microimage is rotated by π around its center. Image Credit: Kopycki, et al., 2021.
Figure 7 depicts an example of the final lightfield frame.
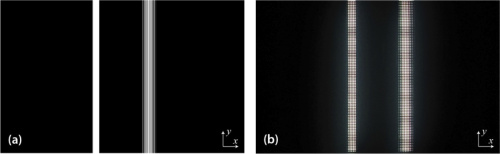
Figure 7. (a) Calculated lightfield image corresponding to the reference bar at z = 0, and the moveable bar at z =+25 mm; (b) Image displayed through a pinhole array as seen by a monocular observer placed in front of the lightfield monitor. Image Credit: Kopycki, et al., 2021.
Figure 8 illustrates the resulting lightfield image after the edges of the mobile rod were blurred.
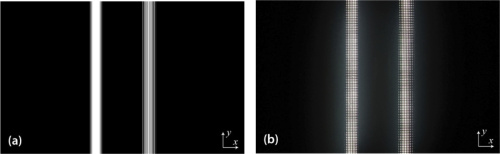
Figure 8. (a) Same lightfield image as in Figure 7, but with artificial blur added to the reference rod; (b) Display through the pinhole array. Image Credit: Kopycki, et al., 2021.
Results
The Howard-Dolman test was implemented and the lightfield images were calculated. For image generation and display, the PsychoPy package and the examination algorithm implemented in a Python script was used.
The pinhole arrays were manufactured by photolithographic means (Figure 9) and were tested in succession in a sample of 19 young observers with normal binocular vision. The observers were of the 20–25 age range and unaware of the experiment's aim.
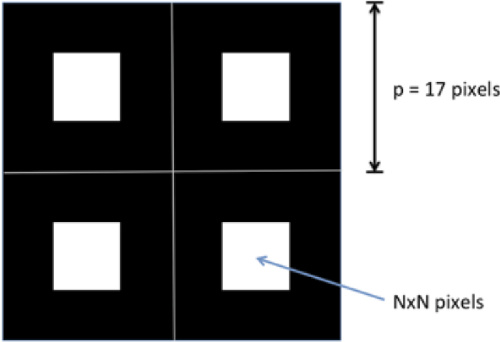
Figure 9. Subset of the pinhole screen formed by a periodic array of transparent squares. Image Credit: Kopycki, et al., 2021.
The observations show a trend for worse stereoacuity (Figure 10); however, Friedman’s test indicates significant differences between the different pixel arrays.
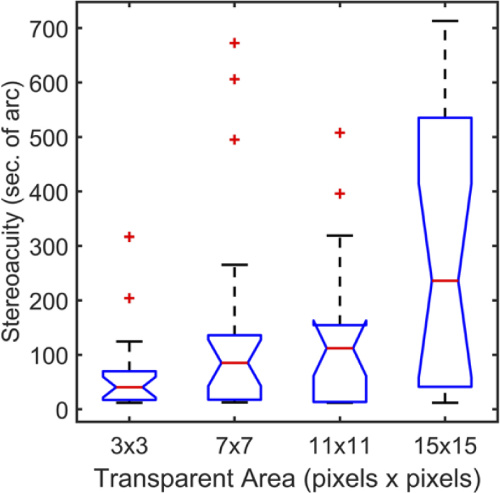
Figure 10. Stereoacuity distributions for the four pixel array sizes. Red lines: median. Upper and lower boundaries of the box, 25 and 75 percentiles. Whiskers: distribution range. Red markers: Outliers. Image Credit: Kopycki, et al., 2021.
Table 1 reveals significant results obtained with different pixel arrays.
Table 1. Pairwise comparison between the stereoacuity values obtained with different pixel arrays. Each row tests the null hypothesis that the Sample 1 and Sample 2 distributions are the same. Asymptotic significances P (2-sided tests) and Z-scores are displayed. The last column contains the Bonferroni correction. The significance level is 0.05. Source: Kopycki, et al., 2021.
| Sample 1-Sample 2 |
Test Statistic |
Std. Error |
Z score |
P-value |
Corr. P |
| 3 × 3 vs 7 × 7 |
-0.500 |
0.419 |
-1.194 |
0.233 |
1.000 |
| 3 × 3 vs 11 × 11 |
-0.553 |
0.419 |
-1.319 |
0.187 |
1.000 |
| 3 × 3 vs 15 × 15 |
-1.263 |
0.419 |
-3.016 |
0.003 |
0.015 |
| 7 × 7 vs 11 × 11 |
-0.053 |
0.419 |
-0.126 |
0.900 |
1.000 |
| 7 × 7 vs 15 × 15 |
-0.763 |
0.419 |
-1.822 |
0.068 |
0.411 |
| 11 × 11 vs 15 × 15 |
-0.711 |
0.419 |
-1.696 |
0.090 |
0.539 |
The results were consistent with the expected ones theoretically—worse results for larger pinhole sizes. They also ascertain the utility, with the present state of display technology, of pinhole-type lightfield monitors when employed in a dark environment.
Conclusion
The ability of pinhole-type lightfield monitors to display 3D images was evaluated. A psychophysical test and measurement protocol was devised enabling the demonstration that pinhole-type monitors provide good stereoacuity with good image brightness. The results obtained show that the use of pinhole-type monitors is feasible to evade chromatic Moiré problems inherent to microlenses-type lightfield monitors.
Journal Reference:
Kopycki, P., Tolosa, A., Luque, M. J., Garcia-Domene, M. C., Diez-Ajenjo, M., Saavedra, G., Martinez-Corral, M. (2021) Examining the utility of pinhole-type screens for lightfield display. Optics Express, 29(21), pp. 33357–33366. Available at: https://www.osapublishing.org/oe/fulltext.cfm?uri=oe-29-21-33357&id=460011.
References and Further Reading
- Lippmann, G., et al. (1908) Epreuves reversibles donnant la sensation du relief, Journal of Physics: Theories and Applications, 7(1), pp. 821–825. doi.org/10.1051/jphystap:019080070082100.
- Adelson, E H & Wang, J Y A (1992) Single lens stereo with a plenoptic camera IEEE Transactions on Pattern Analysis and Machine Intelligence, 14(2), pp. 99–106. doi.org/10.1109/34.121783.
- Cho, M., et al. (2011) Three-dimensional optical sensing and visualization using integral imaging. Proceedings of the IEEE, 99(4), pp. 556–575.
- Park, J. H., et al. (2009) Recent progress in three-dimensional information processing based on integral imaging. Applied Optics, 48 (34), pp. H77–H94. doi.org/10.1364/AO.48.000H77.
- Navarro, H., et al. (2010) Optical slicing of large scenes by synthetic aperture integral imaging. Proceedings of SPIE, 7690. doi.org/10.1117/12.852157.
- Xiao, X., et al. (2013) Advances in three-dimensional integral imaging: sensing, display, and applications. Applied Optics, 52(4), pp. 546–560. doi.org/10.1364/AO.52.000546.
- Navarro, H., et al. (2014) Three-dimensional imaging and display through integral photography. Journal of Information and Communication Convergence Engineering. 4(2), pp. 89–96. doi.org/10.6109/jicce.2014.12.2.089.
- Martinez-Corral, M., et al. (2017) Recent advances in the capture and display of macroscopic and microscopic 3D scenes by integral imaging. Proceedings of the IEEE, 105(5), pp. 825–836. doi.org/10.1109/JPROC.2017.2655260.
- Dorado, A., et al. (2018) Toward 3D integral-imaging broadcast with increased viewing angle and parallax. Optics and Lasers in Engineering, 107, pp. 83–90. doi.org/10.1016/j.optlaseng.2018.03.017.
- Arai, J., et al. (2006) Microlens arrays for integral imaging system. Applied Optics, 45(36), pp. 9066–9078. doi.org/10.1364/AO.45.009066.
- Lee, B., et al. (2002) Viewing-angle-enhanced integral imaging by lens switching. Optics Letters, 27(10), pp. 818–820. doi.org/10.1364/OL.27.000818.
- Kim, Y., et al. (2004) Viewing-angle-enhanced integral imaging system using a curved lens array. Optics Express, 12(3), pp. 421–429. doi.org/10.1364/OPEX.12.000421.
- Yang, J-Y & Cho, M (2016) Color artifact-free three-dimensional integral imaging display with large depth using a lens array based on sublens structure. Journal of Display Technology, 12(6), pp. 610–615. doi.org/10.1109/JDT.2015.2513079.
- Sasaki, H., et al. (2020) Color Moiré Reduction and Resolution Improvement for Integral 3D Displays Using Multiple Wobbling Optics. IEEE International Symposium on Mixed and Augmented Reality, pp. 109–116. doi.org/10.1109/ISMAR50242.2020.00031.
- Schwarz, A., et al. (2015) Lensless three-dimensional integral imaging using variable and time multiplexed pinhole array. Optical Letters, 40(8), pp. 1814–1817. doi.org/10.1364/OL.40.001814.
- Jung, J., et al. (2012) Integral imaging using a color filter pinhole array on a display panel. Optics Express, 20 (17), pp. 18744–18756. doi.org/10.1364/OE.20.018744.
- Choi, H., et al. (2008) Three-dimensional–two-dimensional mixed display system using integral imaging with an active pinhole array on a liquid crystal panel. Applied Optics, 47(13), pp. 2207–2214. doi.org/10.1364/AO.47.002207.
- Kim, Y., et al. (2007) Point light source integral imaging with improved resolution and viewing angle by the use of electrically movable pinhole array. Optical Express, 15(26), pp. 18253–18267. doi.org/10.1364/OE.15.018253.
- Tyrrell, R A & Owens, D A (1988) A rapid technique to assess the resting states of the eyes and other threshold phenomena: The Modified Binary Search (MOBS). Behavior Research Methods, Instruments, & Computers, 20 (2), pp. 137–141. doi.org/10.3758/BF03203817.
- Howard, H J (1919) A Test for the Judgment of Distance. American Journal of Ophthalmology, 2(9), pp. 656–675. https://linkinghub.elsevier.com/retrieve/pii/S0002939419901802
- Navarro, H., et al. (2010) 3D integral imaging display by smart pseudoscopic-to-orthoscopic conversion (SPOC). Optics Express, 18(25), pp. 25573–25583. doi.org/10.1364/OE.18.025573.
- Peirce, J., et al. (2019) PsychoPy2: Experiments in behavior made easy. Behavior Research, 51(1), pp. 195–203. doi.org/10.3758/s13428-018-01193-y.
- Mueller, C G & Lloyd, V V (1948) Stereoscopic Acuity for Various Levels of Illumination. Proceedings of the National Academy of Sciences of the United States of America, 34 (5), pp. 223–227. doi.org/10.1073/pnas.34.5.223.
- Geib, T & Baumann, C (1990) Effect of luminance and contrast on stereoscopic acuity. Graefe’s Archive for Clinical and Experimental Ophthalmology, 228(4), pp. 310–315. doi.org/10.1007/BF00920053.
- Piano, M. E. F., et al. (2016) Normative Values for Near and Distance Clinical Tests of Stereoacuity. Strabismus, 24(4), pp.169–172. doi.org/10.1080/09273972.2016.1242636.
- International Organization for Standardization (2008) Ergonomics of human-system interaction – Part 307: Analysis and compliance test methods for electronic visual displays. ISO 9241-307.