Extracting information about dynamic processes in the picosecond (ps) requires extensive modification and optimal control of the operation conditions. This research, published in Ultramicroscopy surpasses these shortcomings by combining a delay line detector with continuous illumination in a transmission electron microscope.
An electron microscope. Image Credit: Bildagentur Zoonar GmbH/Shutterstock.com
The study of magnetization dynamics on the nanometer scale is vital for fundamental science and nanoelectronics and there are numerous applications such as developing racetrack memories, information transport by spin waves, and many more. Numerous methods are used to date for time-resolved magnetic imaging, including transmission electron microscopy (TEM), synchrotron X-rays, and scanning electron microscopy with polarization analysis.
However, these techniques have their own set of drawbacks in terms of the need for careful control of the operating conditions as it is vital not to compromise the electron beam quality.
This article puts forth a real-time picosecond observation of the gyration of a magnetic vortex core in a ferromagnetic thin film using a delay line detector (DLD)—a high-sensitivity, fast detector. It is mounted on a spherical aberration-corrected transmission electron microscope.
The analyses performed involve imaging a magnetic vortex core and electron diffraction, to reveal temporal resolution around 100 ps, and have the capability to measure a beam deflection at a frequency of up to 2.3 GHz.
The setup detailed here does not need any significant modification to the electron microscope, thereby enabling electron beam coherence and spatial resolution to be retained in both traditional and magnetic-field-free (Lorentz) imaging and diffraction. The illumination is uninterrupted and hence there is no need for pulsing to access magnetization dynamics.
Methodology
Figure 1 shows the experimental setup.
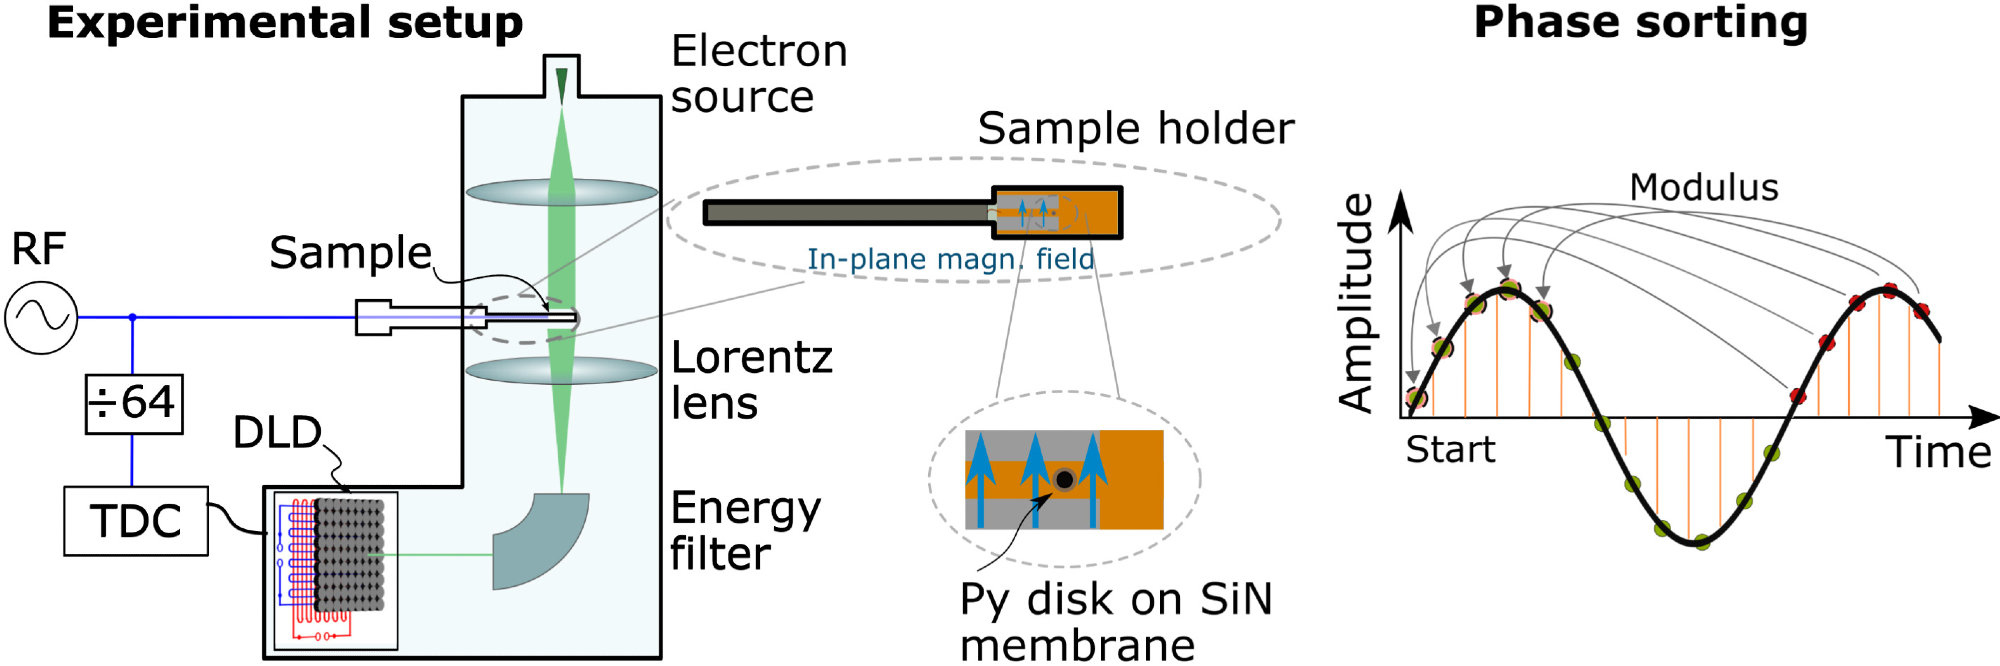
Figure 1. Schematic diagram of the measurement setup and time binning used in the present study. (Left) The electron beam is deflected by a magnetic vortex core in permalloy (Py) sample and imaged using a small area on the delay line detector (DLD). Two meanders on the detector record the times and positions of incoming electrons. Excitation of the magnetic vortex core and detection using the DLD are synchronized by using a frequency divider. (Right) The excitation cycle is divided into multiple steps. Steps corresponding to the same phase are summed up. Image Credit: Weßels, et al., 2021.
The researchers selected a sample comprising a permalloy [(Py), Ni81Fe19 alloy] disk with a thickness of 130 nm and a diameter of 1.68. It is patterned with the help of electron beam lithography onto a 20 nm thick SiN membrane. Analysis of the sample takes place in an FEI Titan G2 60–300 TEM (300 kV) equipped with an objective lens aberration corrector and an imaging filter.
Magnetic-field-free imaging conditions needed to analyze magnetic vortex states are provided by the non-immersion Lorentz lens situated below the sample. The objective lens later applies out-of-plane, static magnetic fields to the sample.
An in-plane RF magnetic field excites the magnetic vortex core and to acquire temporal resolution, a frequency divider after the amplifier was used which divides the RF frequency by 64 to produce the starting signal of the DLD.
The DLD measures the positions and arrival times of detected electrons. The positions of the detected electrons are determined by measuring the difference in arrival time at the ends of the meanders. The DLD provides three-dimensional information.
DLD positioned after the energy filter provides numerous advantages such as higher magnifications and avoiding detector illumination.
Results
Magnetic Vortex Core Dynamics
Magnetic vortices are ideal structures owing to their stability, simple geometry, and resonant dynamics. In this research, the magnetic vortex core was imaged in Lorentz mode using Fresnel defocus imaging (Figure 2a) and the in-plane field of the magnetic vortex is depicted in Figure 2b. In-plane magnetic fields oscillating at microwave frequencies excites the magnetic vortex core.
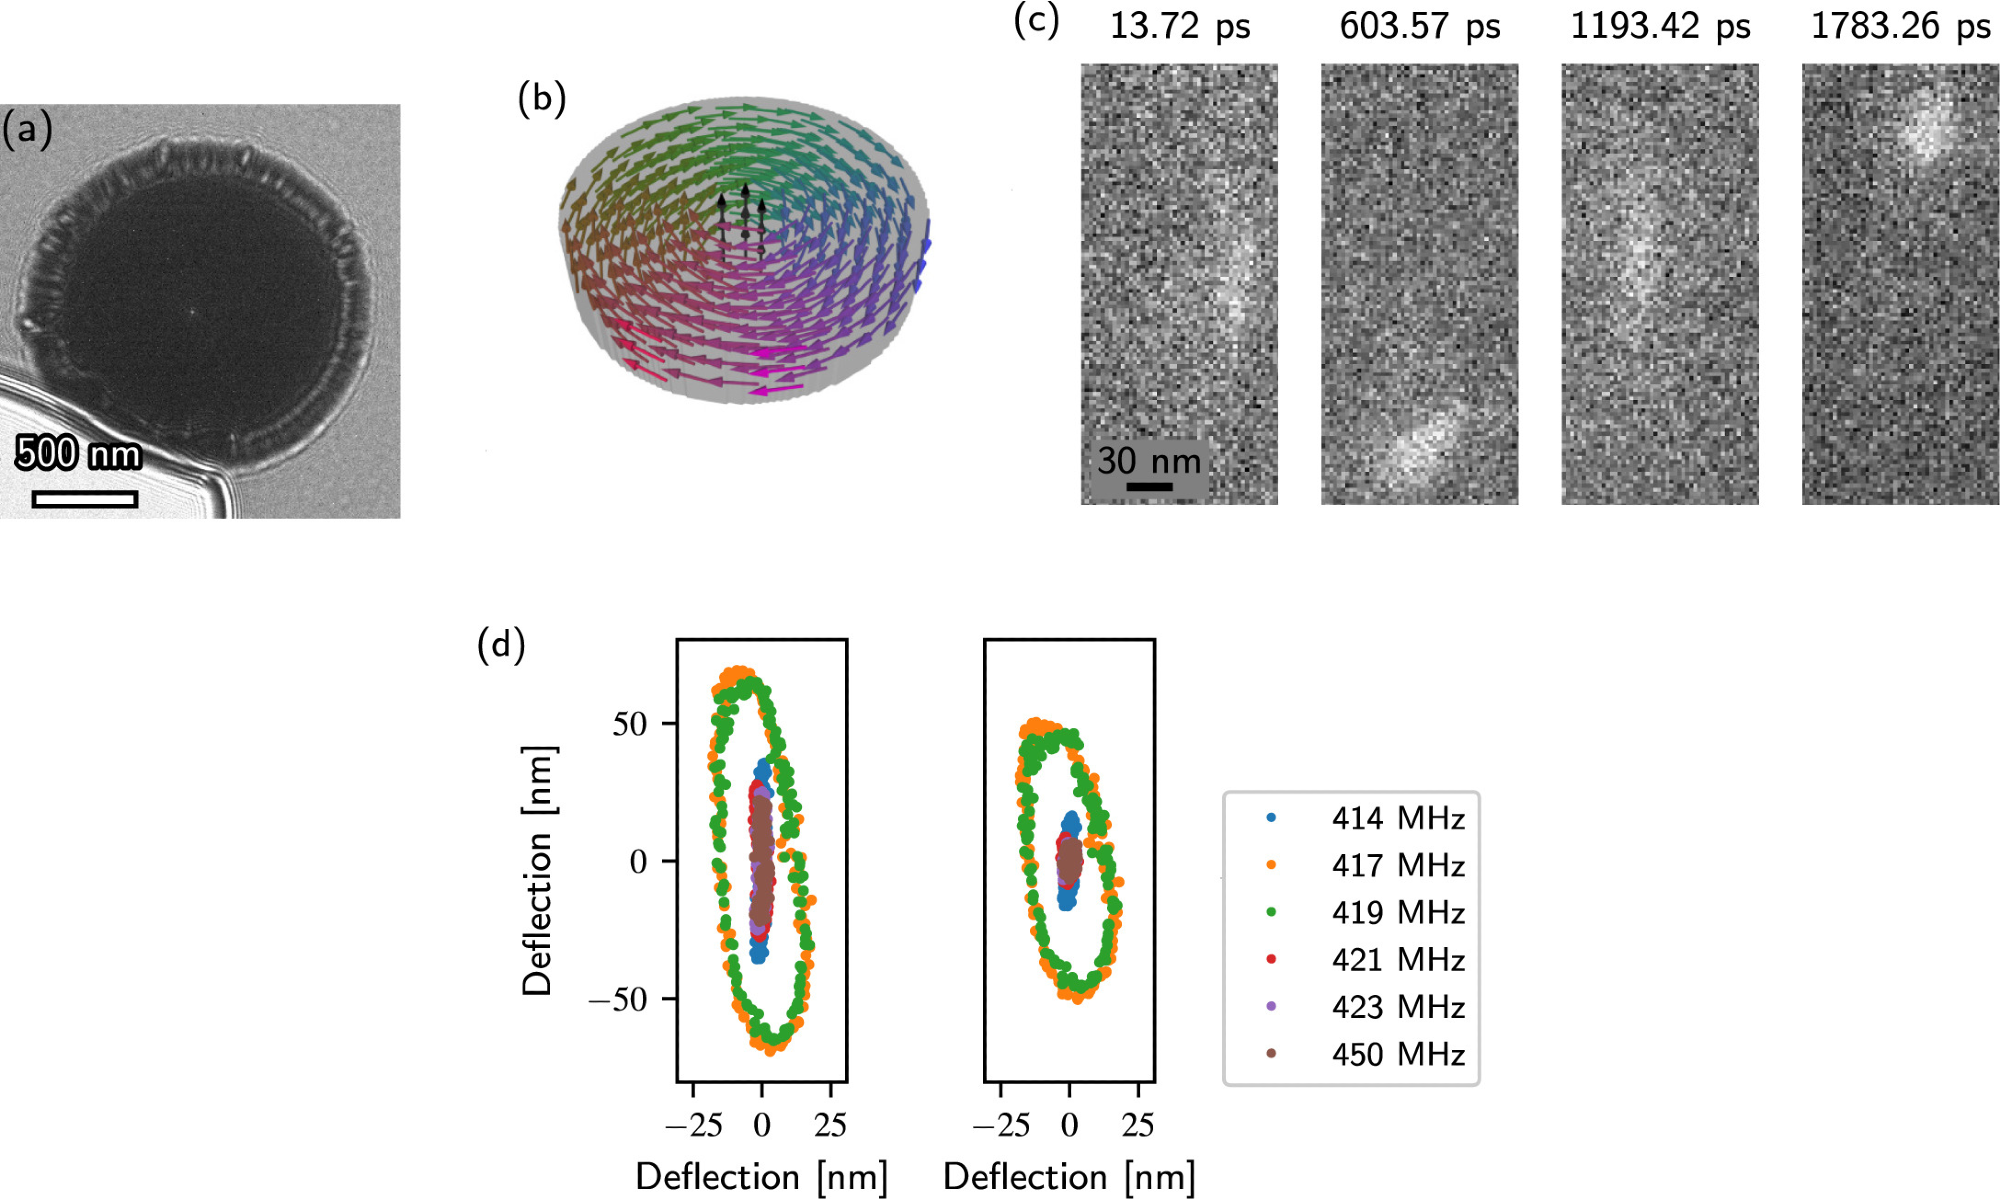
Figure 2. Magnetic vortex core gyration. (a) Fresnel defocus image of a permalloy disk recorded in Lorentz mode at a defocus of 1 mm recorded with a K2 detector. The bright spot in the center indicates the position of the vortex core. The bright region at the lower-left edge is a cut in the supporting membrane. (b) Schematic image of a magnetic vortex state with clockwise rotation and a core pointing upwards. (c) Snapshots of magnetic vortex core motion recorded at different time steps over 13 ps during excitation at 417 MHz in an 18 mT static out-of-plane applied magnetic field. The images reveal the clockwise motion of the magnetic vortex core. They have been binned by a factor of 4 in the x and y directions for better visibility. (d) Dependence of position of magnetic vortex core in each frame on applied frequency, showing measurements before (left) and after (right) correction by subtraction of the image shift due to the electron beam - microwave interaction. The resonant frequency of the magnetic vortex core is characterized by an increase in the amplitude of the gyration at 417 and 419 MHz. The x and y axes have the same scaling. Image Credit: Weßels, et al., 2021.
The real space snapshots of the motion of the magnetic vortex core at various phases of the excitation cycle are shown in Figure 2c. The location of the magnetic vortex core at the time of a full excitation cycle for all frequencies is depicted by the left plot in Figure 2d. The actual position of the magnetic vortex core is determined by subtracting the image shift from the total deflection.
The right plot in Figure 2d depicts the dependence of the resultant magnetic vortex core motion on the applied frequency.
The results obtained were with simulations based on the LLG equation obtained using MuMax software. Figure 3 depicts the results of the simulations revealing a sharp resonant frequency at 400. The simulations show a slightly elliptical trajectory with a diameter of around 20 nm.
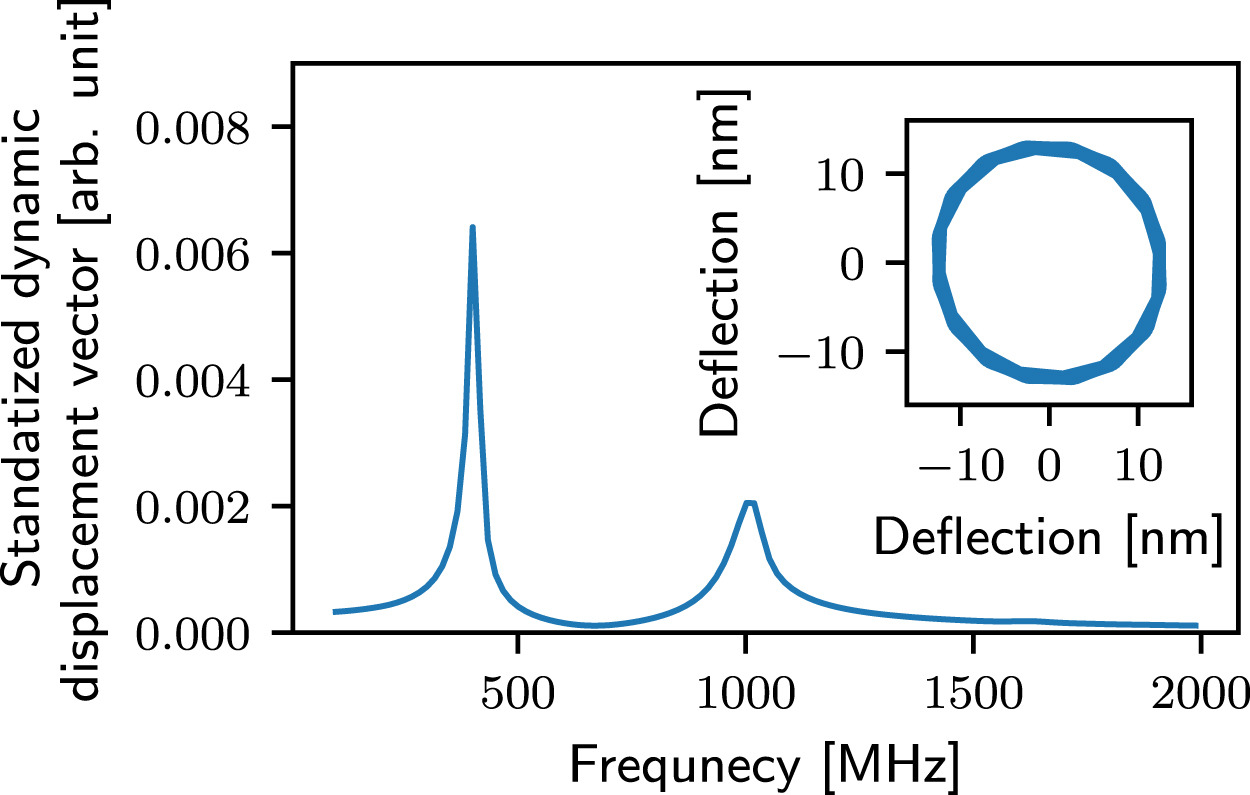
Figure 3. Simulation of characteristics of magnetic vortex core dynamics, showing resonances at 400 and 1000 MHz. The stationary trajectory of the motion of the magnetic vortex core is shown in the inset for a frequency of 400 MHz. Image Credit: Weßels, et al., 2021.
Temporal Resolution
Further prospects of combining a DLD with a TEM were investigated by determining the highest frequency that can be applied during imaging and the temporal resolution of the setup. For this purpose, the electron beam was positioned to lighten the SiN membrane. The time-integrated trajectory of the electron beam for various applied frequencies is depicted in Figure 4.
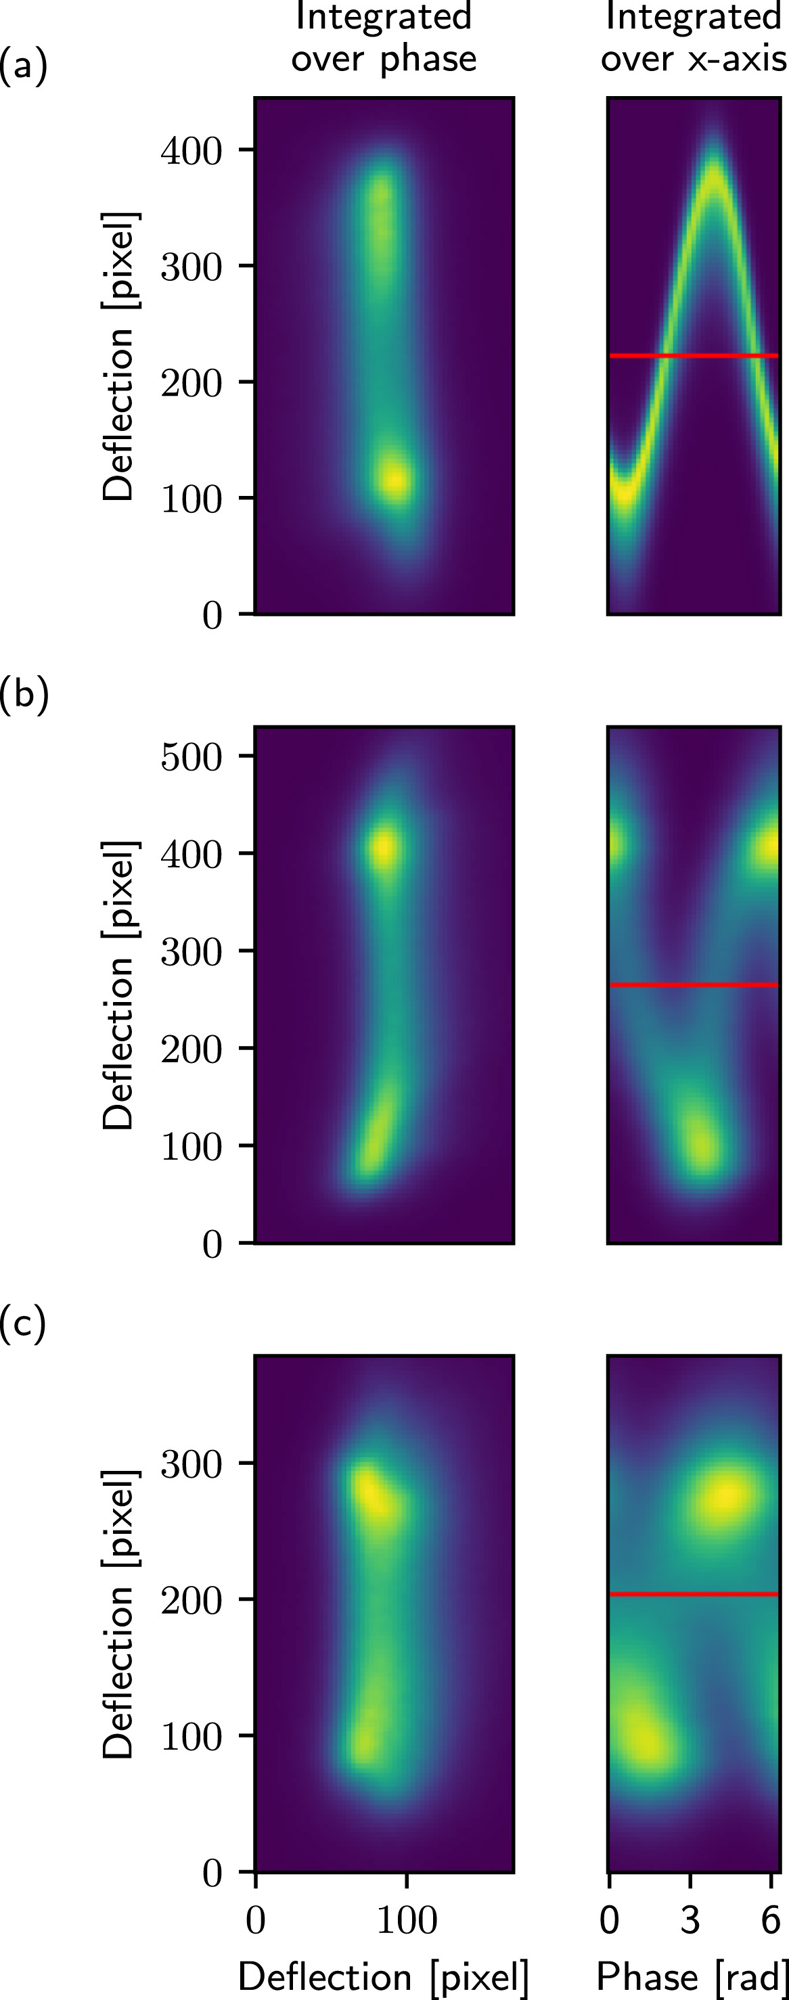
Figure 4. Deflection of the electron beam by a microwave magnetic field is visualized using low angle diffraction. The (x, y, pn) datasets reveal sinusoidal motion for various frequencies: (a) 0.1 GHz, (b) 1.5 GHz and (c) 2.5 GHz. Integration over the different phases and the x-axis are shown in the left and right columns, respectively. The red line marks the position where a linescan was extracted. Image Credit: Weßels, et al., 2021.
The highest resolvable frequency was determined by taking a linescan through the phase domain. The position of the linescan was chosen to be in the center of the deflection. The highest resolvable frequency was determined and the position of the linescan is shown as a red line in Figure 4.
Linescans for various frequencies are shown in Figure 5a. Figure 5b depicts the full width at half maximum (FWHM) of the broadest peak in the linescan for each frequency.
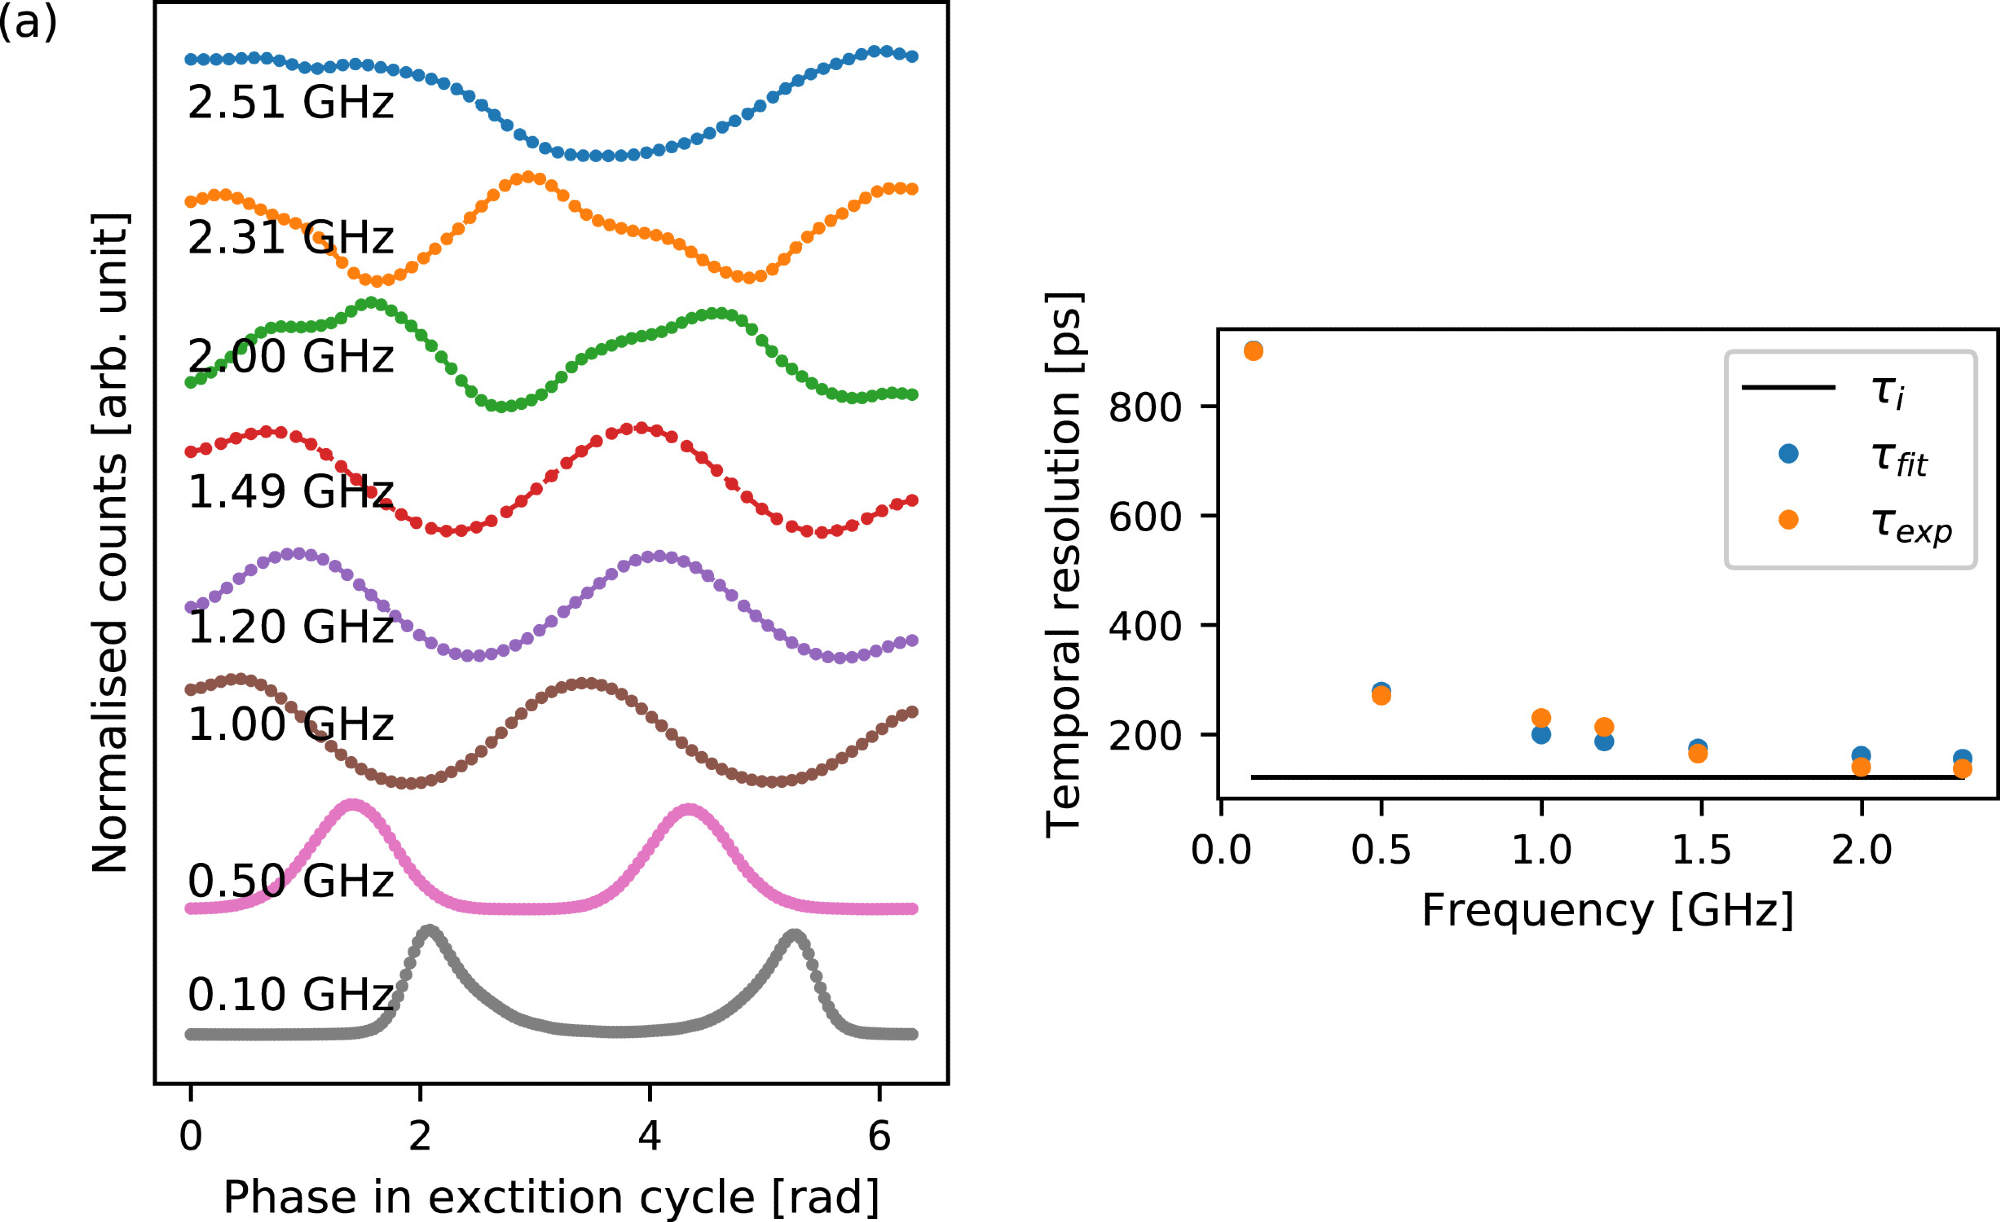
Figure 5. Estimation of usable frequency range and temporal resolution. (a) Linescans recorded along the time domain of the integrated data over x for varying frequencies. Two peaks can be differentiated up to 2.3 GHz, suggesting that a sinusoidal motion is present and dynamic measurements can be performed up to this frequency. (b) FWHM τexp of the largest peak for the respective frequencies. τfit is a fit to τexpt with contributions from τi and the effect of the spot size. The intrinsic spot size is ∼122 ps. Image Credit: Weßels, et al., 2021.
Discussion
The observations show the use of a DLD to offer access to temporal resolutions in the picosecond regime for various dynamic mechanisms and the technique is not limited to mapping magnetic properties. A major advantage of using a DLD is its simplicity, and the DLD being a single electron detection camera, the arrival time of each electron is measured.
DLDs enhance the temporal resolution by six orders of magnitudes and a DLD can be used only in experiments that do not need very good spatial resolution and large field of views.
Conclusion
The article demonstrates two proof-of-principle experiments that offer insights into the use of a delay line detector for time-resolved transmission electron microscopy. Observations demonstrated that it is possible to image the deflection of the electron beam up to frequencies of 2.3 GHz while achieving a temporal resolution down to 122 ps.
Journal Reference
Weßels, T., Däster, S., Murooka, Y., Zingsem, B., Migunov, V., Kruth, M., Finizio, S., Lu, P.-H., Kovács, A., Oelsner, A., Müller-Caspary, K., Acremann, Y., Dunin-Borkowski, R. E. (2021) Continuous illumination picosecond imaging using a delay line detector in a transmission electron microscope. Ultramicroscopy. Available at: https://doi.org/10.1016/j.ultramic.2021.113392
References and Further Reading
- Parkin, S. S., et al. (2008) Magnetic Domain-Wall Racetrack Memory. Science, 320 (5873), pp. 190–194. doi.org/10.1126/science.1145799.
- Zingsem, B. W., et al. (2019) Biologically encoded magnonics. Nature Communications, 10 (1), pp. 1–8. doi.org/10.1038/s41467-019-12219-0.
- Wintz, S., et al. (2016) Magnetic vortex cores as tunable spin-wave emitters. Nature Nanotechnology, 11 (11), pp. 948–953. doi.org/10.1038/nnano.2016.117.
- Jenkins, A. S., et al. (2020) Digital and analogue modulation and demodulation scheme using vortex-based spin torque nano-oscillators. Scientific Reports, 10(1), pp. 1–7. doi.org/10.1038/s41598-020-68001-6.
- Fischer, P., et al. (2003) Magnetic soft X-ray transmission microscopy. Current Opinion in Solid State and Materials Science, 7(2), pp. 173–179. doi.org/10.1016/S1359-0286(03)00002-0.
- Chao, W., et al. (2012) Real space soft x-ray imaging at 10 nm spatial resolution. Optical Express, 20 (9), pp. 9777–9783. doi.org/10.1364/OE.20.009777.
- Frömter, R., et al. (2016) Time-resolved scanning electron microscopy with polarization analysis. Applied Physics Letters, 108 (14), p. 142401. doi.org/10.1063/1.4945053.
- Kovács, A., et al. (2018) Magnetic imaging of nanostructures using off-axis electron holography. Handbook of Magnetic Materials, 27, pp. 59–153. doi.org/10.1016/bs.hmm.2018.09.001.
- Krajnak, M., et al. (2016) Pixelated detectors and improved efficiency for magnetic imaging in STEM differential phase contrast. Ultramicroscopy, 165, pp. 42–50, doi.org/10.1016/j.ultramic.2016.03.006.
- Hawkes, P W & Spence, J C (2019) Springer Handbook of Microscopy. Springer Nature. doi.org/10.1007/978-3-030-00069-1.
- Gamble, S. J., et al. (2009) Electric field induced magnetic anisotropy in a ferromagnet. Physical Review Letters, 102, p. 217201. doi.org/10.1103/PhysRevLett.102.217201.
- Van Waeyenberge, B (2006) Magnetic vortex core reversal by excitation with short bursts of an alternating field. Nature, 444 (7118), pp. 461–464. doi.org/10.1038/nature05240.
- Shi, X., et al. (2016) Soft x-ray ptychography studies of nanoscale magnetic and structural correlations in thin SmCo5 films. Applied Physics Letters, 108 (9), p. 094103. doi.org/10.1063/1.4942776.
- Flannigan, D J & Zewail, A H (2012) 4D electron microscopy: Principles and applications. Accounts of Chemical Research, 45 (10), pp. 1828–1839. doi.org/10.1021/ar3001684.
- Piazza, L., et al. (2013) Design and implementation of a fs-resolved transmission electron microscope based on thermionic gun technology. Chemical Physics, 423, pp. 79–84. doi.org/10.1016/j.chemphys.2013.06.026.
- Feist, A., et al. (2017) Ultrafast transmission electron microscopy using a laser-driven field emitter: Femtosecond resolution with a high coherence electron beam. Ultramicroscopy, 176, pp. 63–73. doi.org/10.1016/j.ultramic.2016.12.005.
- Yang, J., et al. (2018) Ultrafast electron microscopy with relativistic femtosecond electron pulses. Microscopy, 67, pp. 291–295. doi.org/10.1093/jmicro/dfy032
- Oelsner, A., et al. (2001) Microspectroscopy and imaging using a delay line detector in time-of-flight photoemission microscopy. Review of Scientific Instruments, 72, pp. 3968–3974, doi.org/10.1063/1.1405781.
- Jannis, D., et al. (2019) Spectroscopic coincidence experiments in transmission electron microscopy. Applied Physical Letters, 114 (14), p. 143101. doi.org/10.1063/1.5092945.
- Zingsem, B (2020) Pico-second Spin Dynamics in Nano-Structures: Towards Nanometer Spatial Resolution by Transmission Electron Microscopy. (Ph.D. thesis) Universität Duisburg-Essen.
- Boothroyd, C., et al. (2016) FEI titan G2 60–300 HOLO. Journal of Large-Scale Research Facilities, 2, p. 44. doi.org/10.17815/jlsrf-2-70.
- Finizio, S., et al. (2018) Thick permalloy films for the imaging of spin texture dynamics in perpendicularly magnetized systems. Physical Review B, 98, p. 104415. doi.org/10.1103/PhysRevB.98.104415.
- Frequency divider. Available at: https://github.com/eduphys/frequency-divider.
- Choe, S.-B., et al. (2004) Vortex core-driven magnetization dynamics. Science, 304, pp.420–422. doi.org/10.1126/science.1095068.
- Antos, R., et al. (2008) Magnetic vortex dynamics. Journal of the Physical Society of Japan, 77 (3), p. 031004. doi.org/10.1143/JPSJ.77.031004.
- Rubiano da Silva, N., et al. (2018) Nanoscale mapping of ultrafast magnetization dynamics with femtosecond Lorentz microscopy. Physical Review X, 8 (3), p. 031052. doi.org/10.1103/PhysRevX.8.031052.
- Möller, M., et al. (2020) Few-nm tracking of current-driven magnetic vortex orbits using ultrafast Lorentz microscopy. Communications Physics, 3 (1), pp. 1–7. doi.org/10.1038/s42005-020-0301-y.
- Guslienko, K. Y., et al. (2002) Eigenfrequencies of vortex state excitations in magnetic submicron-size disks. Journal of Applied Physics, 91 (10), pp. 8037–8039. doi.org/10.1063/1.1450816.
- Novosad, V., et al. (2005) Magnetic vortex resonance in patterned ferromagnetic dots. Physical Review B, 72 (2), p. 024455. doi.org/10.1103/PhysRevB.72.024455.
- Brown, C (1981) Close range camera calibration, Symposium on close range photogrammetry. Engineering & Remote Sensing, 8, pp. 855–866.
- Vansteenkiste, A (2014) The design and verification of Mumax3. AIP Advances, 4 (10), p. 107133. doi.org/10.1063/1.4899186.
- Exl, L (2014) LaBonte’s method revisited: An effective steepest descent method for micromagnetic energy minimization. Journal of Applied Physics, 115 (17), p. 17D118. doi.org/10.1063/1.4862839.
- Pozar, D M (2011) Microwave Engineering. John Wiley & Sons.
- Goncalves, F., (2017) Probing microwave fields and enabling in-situ experiments in a transmission electron microscope. Scientific Reports, 7 (1), pp. 1–6. doi.org/10.1038/s41598-017-11009-2.
- Debrah, D. A., et al. (2020) Developing a camera-based 3D momentum imaging system capable of 1 Mhits/s. Review of Scientific Instruments, 91 (2), p. 023316. doi.org/10.1063/1.5138731.
- Huth, M., et al. (2014) Electron pair emission detected by time-of-flight spectrometers: Recent progress. Applied Physics Letters, 104 (6), p. 061602. doi.org/10.1063/1.4864274.
- Berntsen M.H., et al. (2011) An experimental setup for high resolution 10.5 eV laser-based angle-resolved photoelectron spectroscopy using a time-of-flight electron analyzer. Review of Scientific Instruments, 82 (9), p. 095113. doi.org/10.1063/1.3637464.
- Williamson J. C., (1997) Clocking transient chemical changes by ultrafast electron diffraction. Nature, 386 (6621), pp. 159–162. doi.org/10.1038/386159a0.
- Fu X., (2020) Direct visualization of electromagnetic wave dynamics by laser-free ultrafast electron microscopy. Science Advances, 6 (40), p. eabc3456. doi.org/10.1126/sciadv.abc3456.
- Lau, J.W., et al. (2020) Laser-free GHz stroboscopic transmission electron microscope: Components, system integration, and practical considerations for pump–probe measurements. Review of Scientific Instruments, 91 (2), p. 021301. doi.org/10.1063/1.5131758.
- Van Rens J., et al. (2018) Dual mode microwave deflection cavities for ultrafast electron microscopy. Applied Physics Letters, 113 (16), p. 162104. doi.org/10.1063/1.5049806.
- Houdellier, F., et al. (2019) Optimization of off-axis electron holography performed with femtosecond electron pulses. Ultramicroscopy, 202, pp. 26–32. doi.org/10.1016/j.ultramic.2019.03.016.
- Zhang, L., et al. (2020) Beam displacement and blur caused by fast electron beam deflection. Ultramicroscopy, 211, p. 112925. doi.org/10.1016/j.ultramic.2019.112925.
- Campbell M., et al. (2016) Towards a new generation of pixel detector readout chips. The Journal of Instrumentation, 11 (01), pp. C01007. doi.org/10.1088/1748-0221/11/01/C01007.