Omega Optical has lately modified its multispectral fluorescence detection system to flow-cytometry. The hardware was first created for confocal applications and comprises of pulsed laser excitation with a serial array of reflecting fiber tips, divided by fiber delay lines.
The proximal tip of the fiber array performs as the confocal pinhole. A time-indexed spectrum is created as each fiber tip in the sequence reflects a sequentially longer wavelength into the PMT detector. As many as 10 spectral bins are specified by the wavelength intervals between the reflecting components.
This system allows for the capture of a multispectral dataset in 2.5 microseconds utilizing a single PMT, which can be processed further or spectrally unmixed.
A series of excitation lasers with matched detectors and fiber arrays can be positioned in the flow path to increase the number of potential labels even more.
The fiber-based technique can be utilized to identify side and forward scattering in the cells at the same time. It is predicted that up to 80,000 cells can be sorted per second in a non-imaging application. Using Omega’s present hardware, it should be possible to image up to 400 cells per second.
Changing to a resonant-scanning mirror rather than the galvo mirror currently in use could increase the imaging rate further.
The spatial resolution can be modified through defocusing and focusing. This article will outline the preliminary results of both imaging and sorting channels to demonstrate how this approach will result in light-weight and compact flow systems with several channels.
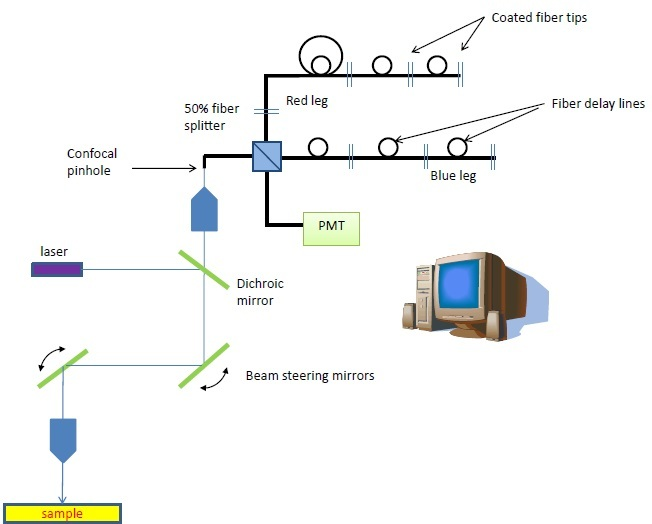
Figure 1. The fiber-based multispectral confocal microscope was developed with an SBIR grant from the NIH/NCI. The unique detection scheme is composed of 2 serial arrays of coated fiber tips that reflect wavelength bins to the detector at sequential timepoints, building a spectrum of each pixel within 2.5 μs.
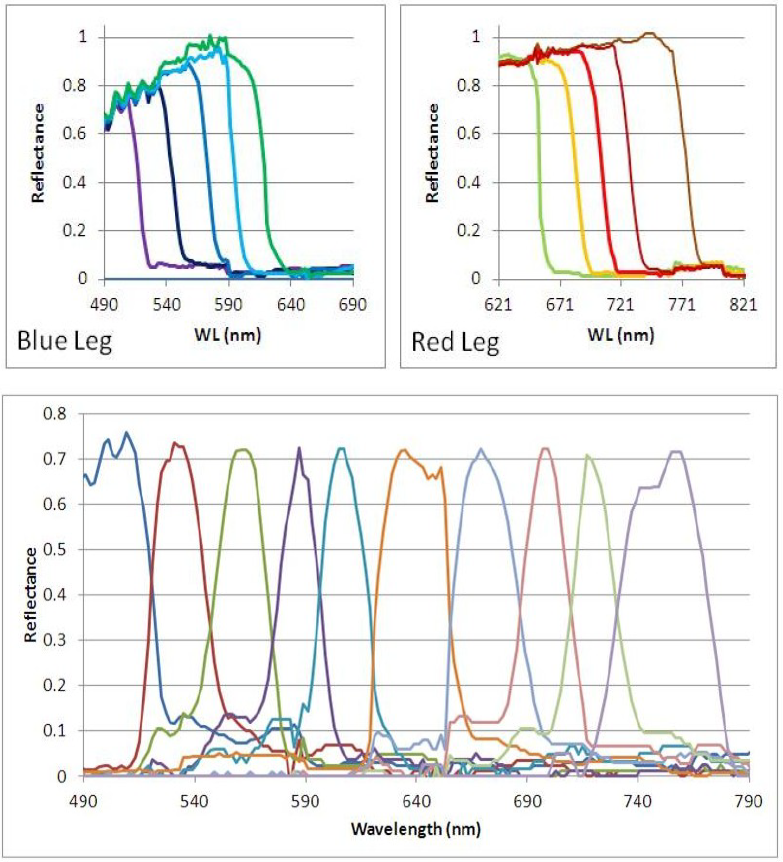
Figure 2. Top, spectral response of the individual fiber tips. The blue wavelengths exhibit fiber loss. Bottom- Scaled spectral response of the entire fiber array. The light reaching the PMT is a time-indexed series of band-passed light centered at progressively longer wavelengths.
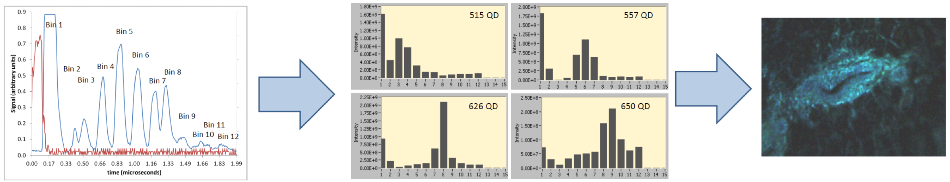
Figure 3. The data acquisition and display process.
The red pulse means ‘go’ and is communicated to the laser, which sends a 100 ns laser pulse to the sample. The wavelength bins return to the detector in sequence over time. The raw data is detector-limited in speed.
The rejection of ‘blue leg’ light from the red leg is the first bin. The second is empty, while bins 3-12 signify the wavelength bins detailed above. To ensure the optimal response from the detector and to allow for recovery between the pulses, the delay lines are spaced out.
The data displayed is processed to eliminate tiny amounts of cross-talk between the channels and to compensate for the non-centrosymmetric state of the sequential fiber arrays.
These are histogram examples obtained from the GUI, which detail the emission spectra of a number of quantum dots excited at 488 nm. All the bins are collected and processed for every pixel.
The data can be presented in a variety of ways. The two-in-one fiber combiner in real-time can display monochrome (maximum pixel intensity), three channels at the same time (RGB and above), multichannel math, spectral angle mapping, and monochrome single channel.
Preliminary Results
The system was configured with imaging in mind, so the starting point was its current capabilities. Independent control of the mirrors was unavailable at this time, so single-point scanning was used to establish the speed restrictions of the system.
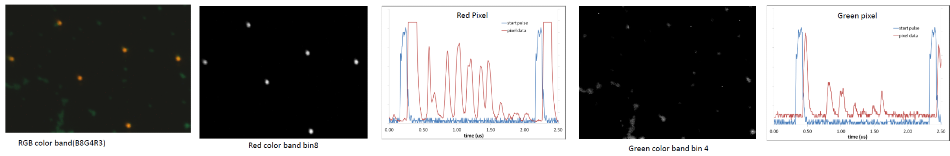
Figure 4. Illustrates mixed beads and the raw data traces that correspond to the red and green pixels from the oscilloscope. Red pixels were 4 μm, and green beads were 2 μm in diameter. These were colorized in real-time by assigning RGB colors to bins x,y,z, respectively.
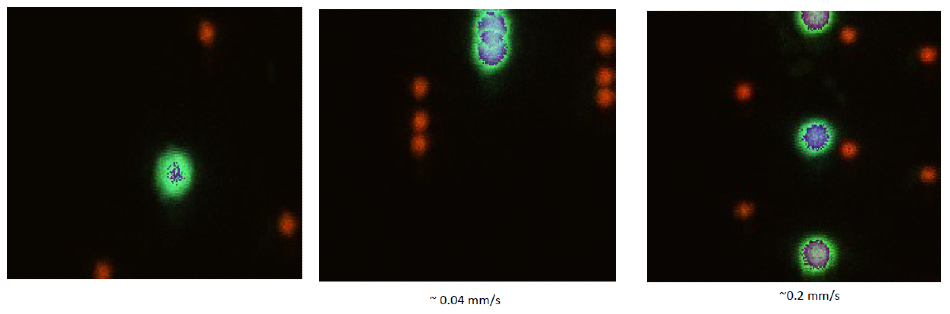
Figure 5. Overlay of sequential images while moving the stage. Images are displayed with RGB. We manually moved the stage while acquiring sequential images to illustrate the speed of the system. Note that the shapes are not perturbed by the motion at these speeds.
Methods - Single Point Measurements
Pulled round glass tubing or 100 mm ID square quartz tubing was used to mimic the detection chamber of the flow cytometer.
These were epoxied onto a microscope slide and into syringe needles to ensure stability within the experiments. Manual compression was used on the syringes to stimulate the flow of beads within the tubing.
The beads in the tubing were the primary focus of the system, and then the scanning mirrors were centered and disabled. Direct oscilloscope output was used to bypass the image processing part of the software to establish the system’s speed.
Oscilloscope output (TIFF) was investigated for FWHM of the time responses utilizing ImageJ to quantify the linear speed of the beads in the system.
The first experiments used 6 mm diameter 6-color Spherotech beads for an even signal and speed estimation. Experiments were also carried out on a combination of 2 mm green, 4 mm red, and 6 mm Spherotech beads.
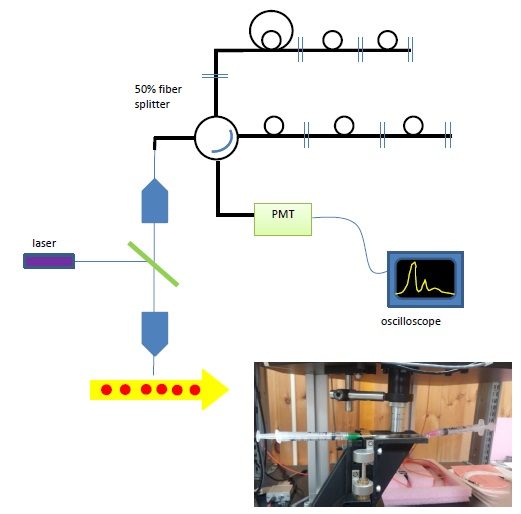
Figure 6. (top) Schematic of Single-point measurements, (inset) photo of the flow cell installed on the stage.
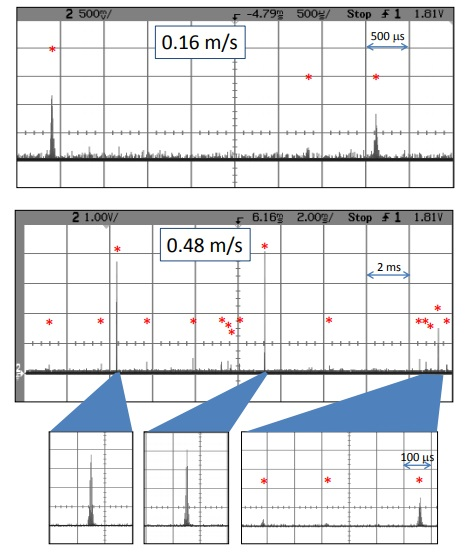
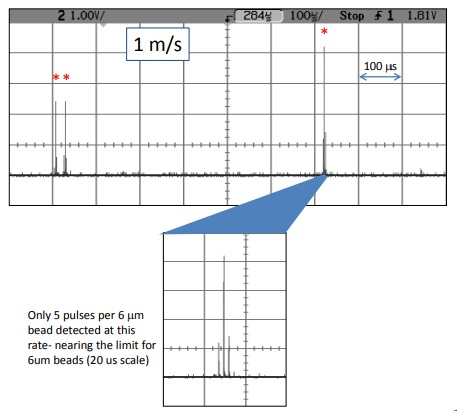
Figure 7. These are 6 mm Spherotech beads that exhibit a variety of intensity levels. The theoretical limit for 6 mm beads is 2.4 m/s, which would give one pulse per particle. Electronic noise does not show up in all bins, but rather as random spikes, allowing for filtering.
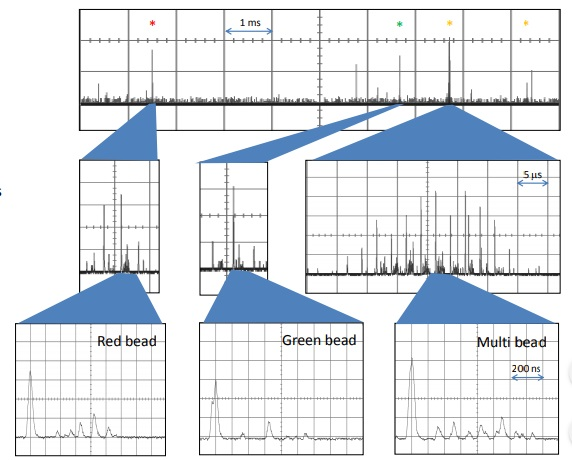
Figure 8. Single-point detection of mixed beads flow rate ~ 0.5 m/s A mixture of beads with different colors and sizes 1 μm green beads 2 μm red beads 6 μm multi-colored beads. The system can easily determine the bead type based on size and spectral composition.
Conclusions and Future Directions
The investigations showed that a single-point, 10-channel fluorescence flow-cytometer detection system is capable of linear flow rates of 1 m/s.
The efficiency can be improved according to the size of the particles. This scheme can be adjusted to include side and front-scattering capabilities, as detailed in Figure 9.
With slight alterations to the system, it is anticipated that 10-color imaging detection will also be achievable at rates up to 400 cells per second (6 μm diameter). The mirror-control software would need to be modified for this to happen, as shown in Figure 10.
Each perspective would demand revisions of the user interface to be enhanced for flow. Collaborators are welcome in the ongoing development of this system.
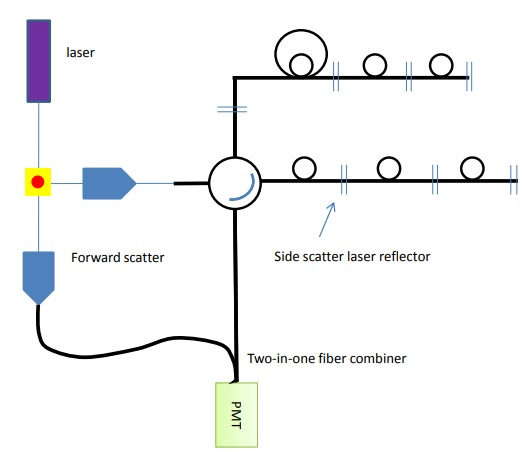
Figure 9. Forward and side scatter channels can be added to the detection array by adding another reflector and a fiber combiner.
Figure 10. In imaging mode, a single x-mirror can be used to raster across the cells while detecting in the back-scatter direction.
References and Further Reading
- Carver, G.E., Locknar, S.A., Morrison, W.A., Ramanujan, V.K. and Farkas, D.L. High-speed multispectral confocal biomedical imaging", J. Biomed. Opt. 19(3), 036016 (Mar 21, 2014).; http://dx.doi.org/10.1117/1.JBO.19.3.036016
- Carver, G.E., Chanda, S.K., Morrison, W.A., Locknar, S.A., and Johnson, R.L. System for Multispectral Imaging of Fluorescence US Patent 9,155,474 (Oct 13, 2015)
Acknowledgments
Harika Vengaladasu for help in data collection, analysis and poster preparation. The prototype confocal instrument was developed with funding from the National Cancer Institute through the NIH (SBIR Ph. II 5R44CA124036-03).
Produced from materials originally authored by Sarah Locknar, John Barton, and Gary Carver from Omega Optical, Inc.

This information has been sourced, reviewed and adapted from materials provided by Omega Optical, Inc.
For more information on this source, please visit Omega Optical, Inc.