For more than 20 years, Thermo Scientific has led the way in ultra-fast spark OES research on nonmetallic micro-inclusions. The Spark-DAT inclusion analysis of the Thermo ScientificTM ARL iSparkTM Plus Optical Emission Spectrometer builds on this vast experience and the many innovations and discoveries it has enabled.
Leading steel firms employ Thermo Scientific's spark OES inclusion analysis solutions globally, and the number of businesses using them each year increases in the non-ferrous metals, aluminum, and steel sectors.
The application support options, software tools, and techniques for inclusion analysis are described on this product page.
Ultra-Fast Inclusion Analysis
The ARL iSpark Plus with Spark-DAT provides unparalleled speed for inclusion analysis. Delivering the combined results of elemental and inclusion analysis in a single test in about the same amount of time as elemental analysis alone enables effective control over the quality of the metal and the production process.
This suggests that all materials that the OES spectrometer analyzes in concentration—up to several hundred samples per day—can have inclusions evaluated. Consequently, abundant informative inclusion data may be acquired to consistently improve process efficiency and product quality.
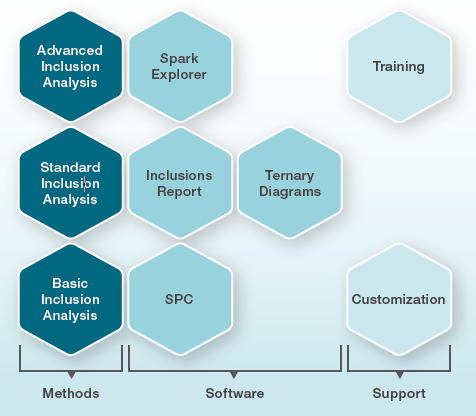
Options for Spark-DAT inclusion analysis. Image Credit: Thermo Fisher Scientific - Elemental Analyzers and Phase Analyzers
Key Benefits
- Specifically designed for ARL iSpark Plus automation with ARL SMS (Sample Manipulation System)
- A measurement that combines elemental analysis with inclusion analysis
- Checks for inclusion in hundreds of samples almost instantly each day
- Significant cost savings because less expensive inclusion issues arise
- No changes to the ARL iSpark Plus operation or the sample preparation process
Inclusion Analysis Methods
Depending on the metal or alloy of the samples to be examined, up to three distinct Spark-DAT inclusion analysis techniques are available. Elemental analysis is applied with Basic, Standard, and Advanced level analyses. The ARL iSpark Plus is ready to use when they arrive.
With the ARL iSpark Plus, they may often be added to elemental analysis methods that are already being used in the lab.
An overview of the salient traits and attributes of the different inclusion analysis methodologies is given in the table.
Principal features and specificities of the different inclusion analysis methods.* by inclusion type. Source: Thermo Fisher Scientific - Elemental Analyzers and Phase Analyzers
| |
Inclusion analysis method |
| |
Basic |
Standard |
Advanced |
| Available for |
Low alloy steel |
All metals and alloys |
Low alloy steel |
| Types of inclusions measurable |
Main |
Many |
Many |
| Qualitative/Quantitative data |
Qualitative |
Qualitative |
Both |
| Special feature |
Dedicated report |
Customizable |
Customizable |
| Typical inclusion data obtained |
| Number* |
✓ |
✓ |
✓ |
| SML classification* |
✓ |
✓ |
✓ |
| Size and size distribution* |
|
|
✓ |
| Inclusion volume fraction* |
|
|
✓ |
| Inclusion concentration* |
|
|
✓ |
| Oxygen content |
|
|
In killed steel |
| Available software options |
| Spark Explorer |
✓ |
✓ |
✓ |
| Inclusions Report |
|
✓ |
✓ |
| Ternary Diagrams |
|
|
✓ |
| SPC |
✓ |
✓ |
✓ |
Basic Inclusion Analysis
For low-alloy steels, the Basic Inclusion Analysis is a basic technique that evaluates the inclusions of numerous important elements, including Al, Ca, Mg, and S (calcium sulfides, aluminum oxides, and calcium aluminates). Basic Inclusion Analysis also includes a downloadable one-page report with the inclusion analysis results.
Standard Inclusion Analysis
All metals and alloys that may be examined with the ARL iSpark Plus, such as Fe, Al, Cu, Ni, Co, Pb, Zn, Sn, Mg, Ti, Ag, Au, Pd, and Pt, can be examined using the Standard Inclusion Analysis method. This makes it possible to assess the characteristics of various inclusions with different compositions.
Advanced Inclusion Analysis
In addition to the same inclusion properties as the Standard Inclusion Analysis method, the Advanced Inclusion Analysis method enables the evaluation of additional, more advanced properties like inclusion volume fraction and ESD (equivalent sphere diameter) in μm. It is a full-capability approach for low-alloy steels.
OXSAS Analytical Software
Where the Heart of Inclusion Analysis Beats
OXSAS is the program that manages all aspects of the elemental analysis and runs the ARL iSpark Plus. The whole set of Spark-DAT tools needed to carry out the selected inclusion analysis approach is also included with OXSAS. These tools cover everything from setup to handling findings to inclusion of data collection and processing.
The fast, statistically based Spark-DAT algorithms convert individual spark signals into meaningful inclusion data.
After analysis, OXSAS displays the element concentrations and inclusion data. The inclusion data can be transferred to a LIMS, another computer, or statistical process control software like the concentrations.
Quality Data in Quantity
Massive amounts of data regarding the different inclusion types (i.e., compositions) that are present in the sample can be generated by Spark-DAT approaches. This is not a problem because the OXSAS analysis software can handle practically infinite outcomes.
The supreme effectiveness of Spark-DAT algorithms, which use specially developed statistical techniques to provide an optimal compositional evaluation of the inclusions, improves the quality of the inclusion data.
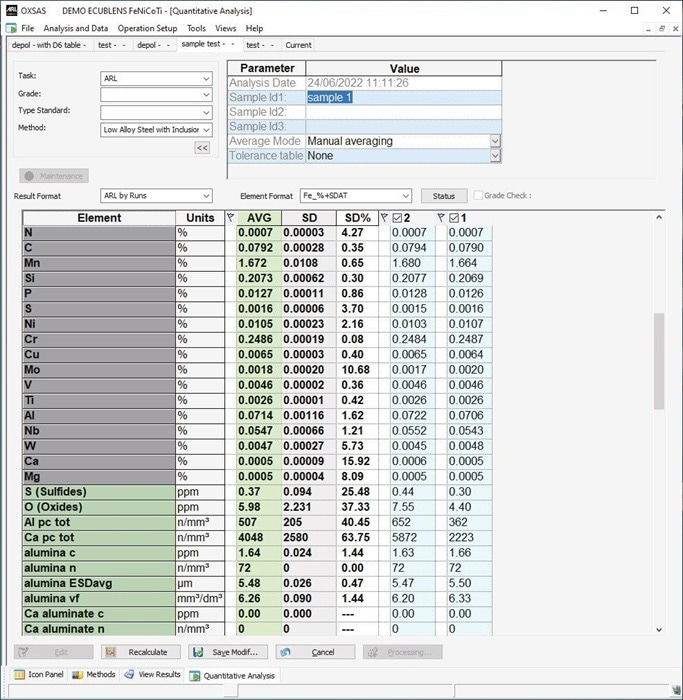
Result display of a two-run advanced inclusion analysis combined with elemental analysis of a low alloy steel sample. Image Credit: Thermo Fisher Scientific - Elemental Analyzers and Phase Analyzers
Key Features
- Almost no limitations on the number of properties that can be included
- Recalculation of inclusion characteristics following parameter adjustments for the Spark-DAT algorithms
- Efficient differentiation of inclusions with varying compositions
- Class editor for individual spark intensity and size distributions
- Data in the.txt and.csv formats for usage in commercial applications
- Data transmission to remote computers, LIMS, or statistical process control software
Software Tools for Inclusion Analysis
Spark Explorer
Understand What Lies Beyond Numbers
Investigating the raw inclusion data becomes essential when the user needs to better comprehend any inclusion analysis outcomes or wants to hone the methodology. For this reason, the so-called single spark signals used in inclusion analyses are more efficient thanks to Spark-DAT Explorer.
It offers several ways to visualize and compare the signals corresponding to inclusions on different element channels or samples and numerous useful features.
With Spark Explorer, users may dynamically adjust the parameters of methods and algorithms to produce the best possible ultra-fast inclusion analysis. Two examples of helpful usage are looking into and recording in the event of a problem with product quality or manufacturing concerns.
Key Features
- Display individual spark run charts for an endless number of elements, runs, and samples
- Interactive statistical data computation and other key inclusion metrics, like the insoluble ratio and peak counts
- Distribution histograms
- simultaneous display of the run chart, histogram, and S-chart of the single spark intensity signals
- Graphical adjustment of the inclusion signal detection threshold (intensity peaks)
- Printing reports and exporting charts to image files
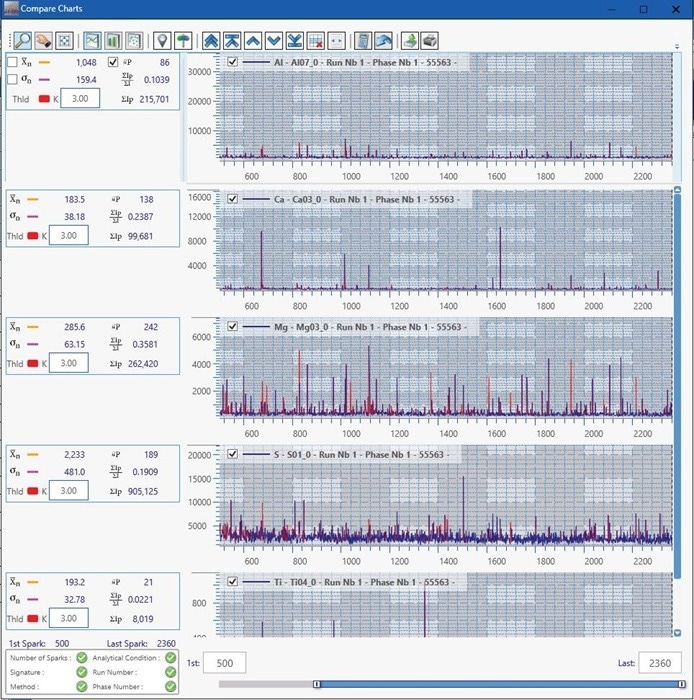
Comparison of single spark signals of Al, Ca, Mg, S and Ti in a low alloy steel sample. Image Credit: Thermo Fisher Scientific - Elemental Analyzers and Phase Analyzers
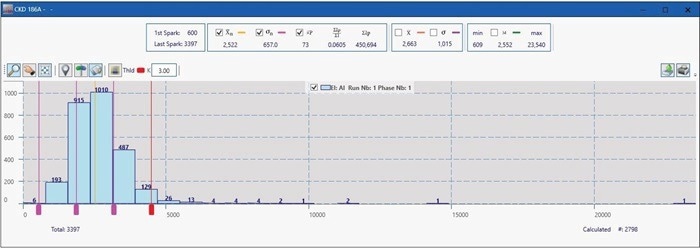
Distribution histogram of Al single spark intensities in a low alloy steel sample. Image Credit: Thermo Fisher Scientific - Elemental Analyzers and Phase Analyzers
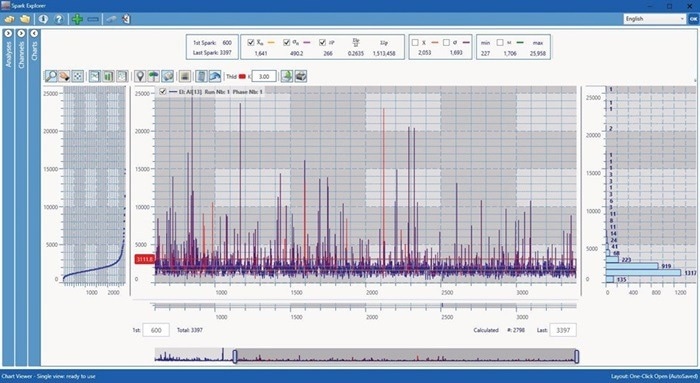
Display of S-chart, run chart and histogram of Al single spark signals in a low alloy steel sample. Image Credit: Thermo Fisher Scientific - Elemental Analyzers and Phase Analyzers
Inclusions Report
A Digest of the Inclusion Data
When using the Inclusions Report option, all the data and information required for the inclusion review are in a single, dedicated document. The inclusions report (e.g., defectology and process specialists) is recommended for carefully reviewing inclusion analysis results, documenting and archiving results, or providing information to specialists in the business divisions or roles involved with inclusion concerns.
Certain sections and contents of the paper may change based on the inclusion analysis method selected.
Key Features
- Contents available with both Standard and Advanced Inclusion Analysis
- The surface, volume, and mass of the assessed sample material
- The elemental makeup of the sample. and the primary inclusion indices that the user defines
- Inclusion numbers and relative size distribution (SML classification)
- In addition, advanced inclusion analysis contents are provided, such as:
- Size distribution (in μm)
- Inclusion concentrations (in ppm)
- Inclusion volume fractions (in mm³/dm³).
- If the option is selected, the concentration of soluble/insoluble fractions of elements (e.g., Al, B, and Ti).
- Determining whether dead steels have low oxygen concentrations
- Optional ternary diagrams
- Concentration of soluble/insoluble fractions of elements (e.g., Al, B, and Ti) if option selected
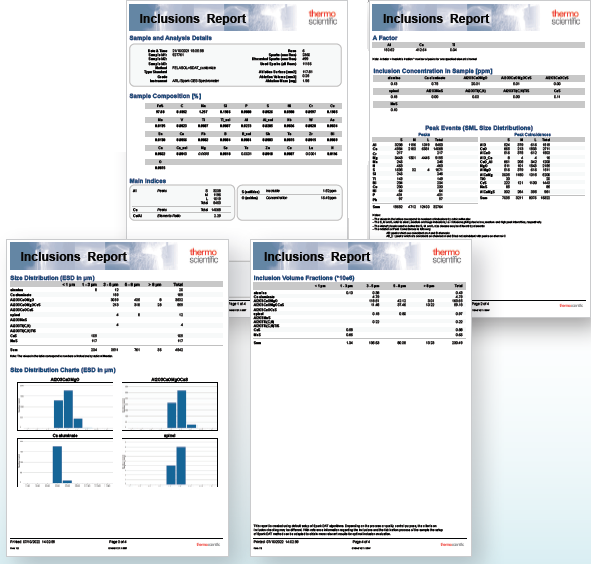
Example of an inclusion analysis report of a low alloy steel sample measured with Advanced Inclusion Analysis method. Image Credit: Thermo Fisher Scientific - Elemental Analyzers and Phase Analyzers
Ternary Diagrams
Snapshots of the Inclusion Population
Ternary diagrams show inclusions' size distribution and composition consisting of one to three chemical components. Examples of these diagrams include those for Al₂O₃–CaO–MgO or Al₂O₃–CaO–MnS. They provide an image of the included population, usually at a specific point in the production process.
Ternary diagrams, for instance, allow one to observe the changes the calcium treatment has on the aluminum oxides. They are created using the Ternary Diagrams software module, which offers an option for Advanced Inclusion Analysis in low alloy steel and an inclusion report.
Key Features
- A breakdown of inclusions per mm³ by size class
- Size classes expressed in μm
- The average inclusion composition, represented by a dot on the diagram and reported as a percentage.
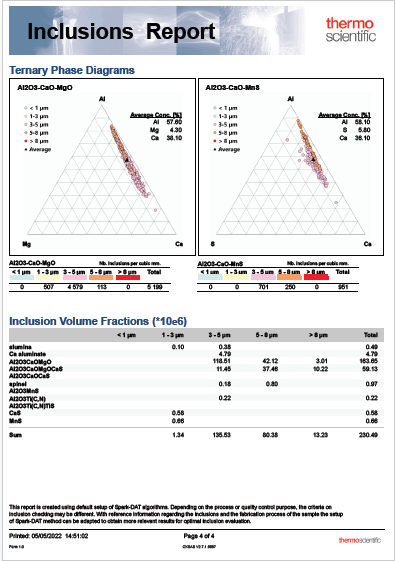
Examples of ternary diagrams in an inclusion analysis report. Image Credit: Thermo Fisher Scientific - Elemental Analyzers and Phase Analyzers
SPC
A Most Effective Way for Inclusion Control
OXSAS facilitates simple, virtually online inclusion control by transferring inclusion data measured with the ARL iSpark Plus to statistical process control (SPC) software. SPC software is a fantastic option for companies trying to lower inclusion-related issues as well as scrap, rework, and non-compliant goods.
Key Features
- Upper Specification Limit (USL): the user-set limit
- Trend notices: a rising drift in the number of inclusions; incident warnings: these normally happen when the specification limit is surpassed
- Applicable to element concentrations and inclusion data simultaneously
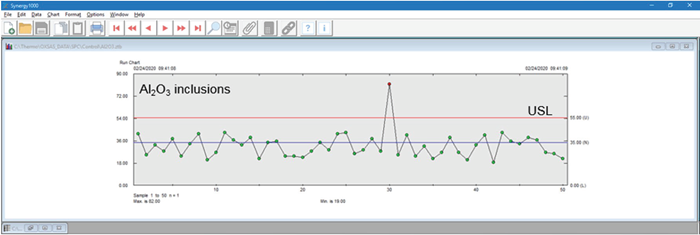
SPC run chart of aluminum oxides in 50 steel production samples. Number of inclusions in sample 30 is above USL, which signifies that its inclusion content is not compliant. Image Credit: Thermo Fisher Scientific - Elemental Analyzers and Phase Analyzers
Application Support
Thermo Fisher Scientific experts offer various support options to tailor the techniques to individual materials analysis requirements and staff training.
Customization
The production method and the quality of the metal can significantly impact the inclusion content, particularly the kind of inclusions in the samples. For this reason, the Spark-DAT method’s configuration—either Standard Inclusion Analysis or Advanced Inclusion Analysis—is crucial.
To customize the Spark-DAT analysis as closely as possible to the demands during the production of the ARL iSpark Plus, the application specialists will be pleased to speak with users.
There are other choices accessible when finer tweaks to the approaches are required. The possibility of personalizing the approach with experts in Ecublens, Switzerland, before sending the ARL iSpark Plus is extremely useful and appreciated.
Image Credit: Thermo Fisher Scientific - Elemental Analyzers and Phase Analyzers
Training
A training course is advised for people new to Spark-DAT inclusion analysis who want to optimize or design their own methods. Training can be provided in the regional application labs or via web sessions.