Microplastics (<5 mm) and nanoplastics (<1 µm) are a growing concern in environmental, food, and health research. To accurately characterize these particles, scientists require particle-level data on chemical composition, size, and shape.
Raman microscopy is a non-destructive analytical technique with submicron spatial resolution, allowing for comprehensive chemical characterization and imaging of micro- and nanoplastics.
Raman spectroscopy uses inelastic light scattering to produce molecular fingerprints that allow for unambiguous material classification. This article compares two complementary Raman-based nanoplastics investigation methods: particle-by-particle micro-spectroscopy and Raman imaging.
Comparing Measurement Strategies
Particle-by-particle micro-spectroscopy selects and measures particles individually. This method is adaptable and appropriate for targeted analysis, but it suffers from selection bias, limited statistical relevance, and longer measurement times with greater particle counts.
Raman imaging generates spatially resolved chemical datasets. This enables chemical contrast-based identification, facilitates heterogeneous particle analysis, and enhances classification reliability via spectrum averaging.
Experimental Setup
All measurements were taken using a confocal RAMANtouch Raman microscope coupled with a high numerical aperture objective.
Because accurate nanoplastic characterization requires careful measurement optimization, parameters were chosen to strike a compromise between acquisition speed, spectrum quality, and spatial resolution.
- Laser wavelength: 532 nm
- Laser power: 8.7 mW (point mode)/115 mW (line mode)
- Integration time: two x 0.5 seconds (point mode)/three seconds (line mode)
- Objective: 100×, NA 0.9
- Step size (imaging): 200 nm
- Identification method: library matching (particle mode)/correlation (imaging)
Results and Discussion
The reference sample of nanoplastic particles was evaluated on a flat glass surface to reduce the impact of a filter substrate on the comparison. The performance of particle detection, identification, and characterization was compared using both particle-by-particle and imaging techniques.
Particle-by-Particle Microspectroscopy
The initial phase involved localizing nanoplastic particles based on their visual contrast in an optical image. Particle detection was improved by altering critical parameters like intensity thresholds, size filters, and focusing settings.
These variables directly impact the resulting particle metrics and therefore require careful customization. Prior to the measurement, the laser power and integration time were determined. Once the measurement began, the retrieved particle coordinates were evaluated consecutively.
A Raman spectrum was obtained for each detected particle (Fig. 1, top right), which was then matched to the associated morphological parameters from the visual image.
Finally, material identification was accomplished by database matching of the collected spectra, completing the automated analysis cycle from particle detection to chemical categorization. The particles were appropriately recognized as polystyrene.
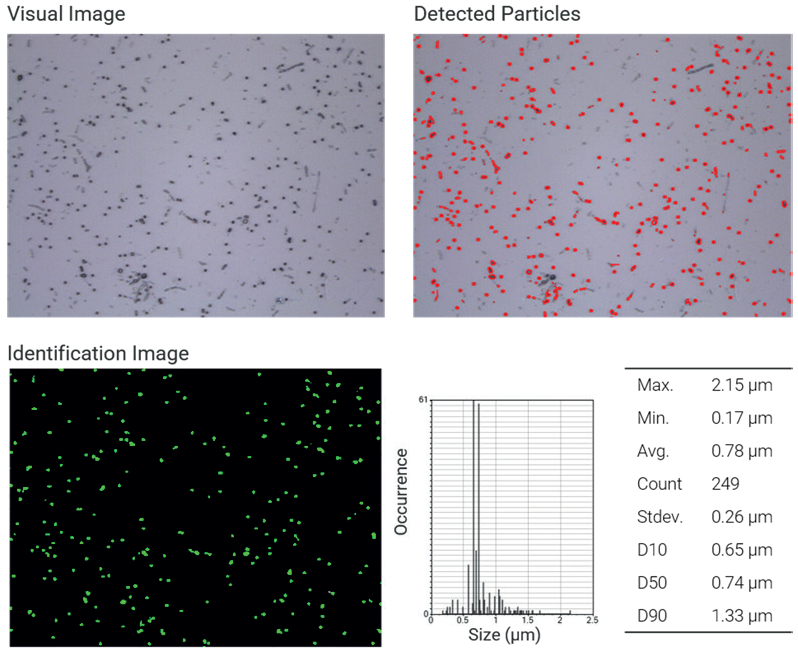
Fig 1. NP analysis particle by particle. Top left: Visual image of nanoplastics (100x objective lens). Top right: Map of detected particles based on visual contrast. Bottom left: Identified polystyrene particles based on the Raman spectrum. Bottom right: Particle and size statistics. Image Credit: Bruker Optics
Raman Imaging
The same field of view was used to investigate Raman imaging using laser line scanning. In this approach, the laser power and integration time, as well as the scanning step size, have to be calibrated to achieve a balance between quick acquisition and sufficient signal-to-noise ratio.
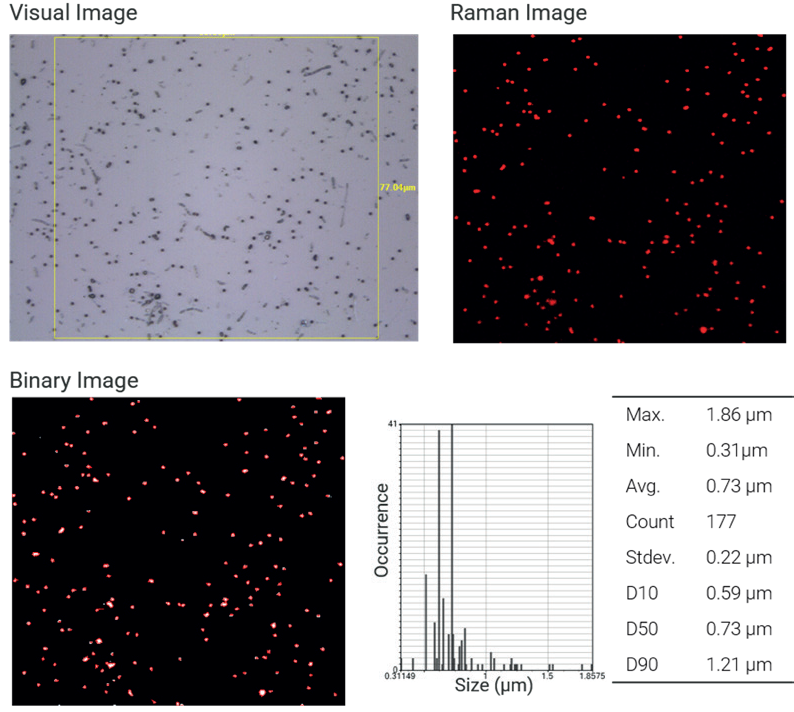
Fig 2. NP analysis by imaging. Top left: Visual image of nanoplastics with region of interest (100x objective lens). Top right: Raman image of polystyrene particles based on correlation analysis. Bottom left: Binarization of the Raman image to extract particle statistics. Bottom right: Particle and size statistics. Image Credit: Bruker Optics
The generated Raman dataset (Figure 2) was assessed using correlation analysis, which utilized reference spectra from various polymer kinds. A significant correlation with the polystyrene reference spectrum is shown in red, confirming the expected material composition.
Particle metrics (Figure 2, bottom right) were then obtained by binarizing the correlation image.
It should be emphasized that these metrics are strongly dependent on the spatial resolution of the measurement, namely the chosen step size, which has a direct impact on the accuracy of particle size and shape determination, as well as the binarization thresholds.
Direct Comparison
Both techniques allowed for the reliable identification and detection of nanoplastics down to submicron sizes. After removing particles outside the Raman imaging area, comparable particle counts were obtained for both methods.
However, minor discrepancies were found:
- In Figure 3, two particles discovered in Raman imaging are not identified in the particle-by-particle techniqueand vice versa.
- Optical detection produces bigger particle sizes due to the incorporation of nearby features (Figure 3).
- Raman imaging sizing is heavily influenced by step size and resolution.
These variances stem from fundamentally different detection and evaluation procedures. Particle-by-particle analysis is based on optical pre-selection and may overlook low-contrast particles, whereas Raman imaging produces an unbiased chemical map of the entire measurement area.
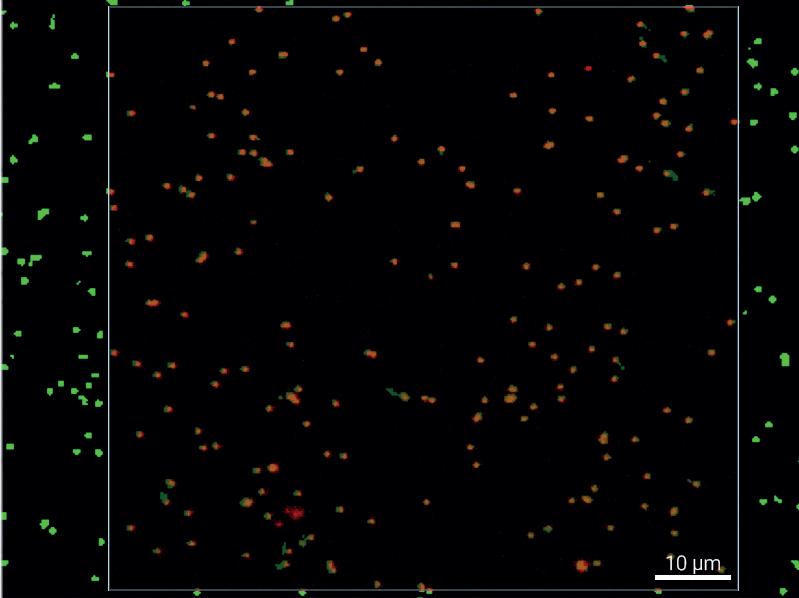
Fig 3. Particle Analysis Overlay. Merge of particle-by-particle and Raman imaging analysis results. Image Credit: Bruker Optics
Conclusion
Raman microscopy is a potent and adaptable method for characterizing nanoplastics, allowing for chemical identification and particle-resolved analysis on the submicron scale. In a controlled model system, both particle-by-particle microspectroscopy and Raman imaging show consistent performance and produce results that are very similar.
While particle-by-particle analysis offers fast and targeted measurements, Raman imaging gives unbiased, spatially resolved chemical information.
The close agreement between the two techniques demonstrates their complementary nature. Together, these methodologies constitute a robust and adaptable analytical workflow for nanoplastics research, laying the groundwork for future investigations of complex mixes and real-world samples.
Acknowledgments
Produced using materials originally authored by Fabian Knechtel, Product Manager Raman Imaging, at Bruker Optics GmbH & Co. KG.

This information has been sourced, reviewed, and adapted from materials provided by Bruker Optics.
For more information on this source, please visit Bruker Optics.