Sponsored by MKS OphirReviewed by Olivia FrostAug 5 2026
Since 2024, the MKS Ophir BeamSquared analyzer has featured the new SP204S backside-illuminated CMOS camera, offering a number of benefits over the previously equipped CCD camera (SP920).
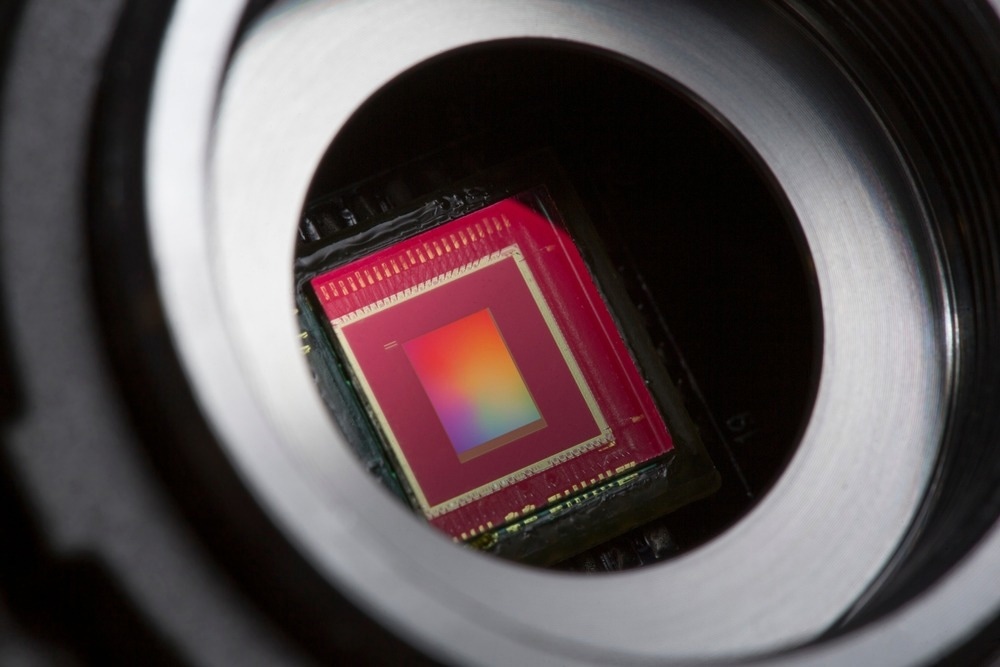
Image Credit: Pixel 4 Images/Shutterstock.com
One notable advantage of CMOS cameras is that they lack the smearing found in CCD cameras. Ophir Photonics’ latest cameras also demonstrate a significantly reduced blooming effect, an effect that is particularly attributed to CMOS sensors.
Backside-illuminated CMOS sensors flip and thin the silicon, improving photodiode light-collection efficiency and delivering enhanced sensitivity. The combination of this new camera and the advanced BeamSquared system delivers sensitivity improvements and M2 measurement in the NIR region.
The new camera’s reduced pixel size also enables the accurate measurement of smaller beam sizes.
Advantages of CMOS Over CCD Technology
Both CMOS and CCD sensors absorb light via similar semiconductor heterojunction structures, typically a pinned photodiode.
CMOS architecture has each pixel use its own transistors to convert the generated electrons into a voltage and amplify it. These voltages are sequentially sampled using analog-to-digital circuits at the edge of the active area to produce the digital readout signal.
In contrast, CCDs transport the photoexcited charges from pixel to pixel before finally transporting these to the edge of the active region. Once at the edge, the charges are converted into a voltage before being digitized to provide the reading.
CMOS cameras solve the smearing problem by sampling voltage rather than transporting charge. This issue is prevalent in CCD cameras close to saturation. Smearing also occurs in the CCD farther from saturation for near-infrared (NIR) light, above 1000 nm (Figures 1 and 2). This smearing is also absent in CMOS cameras.
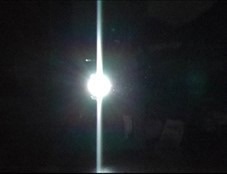
Figure 1. Smearing in CCDs. Image Credit: MKS Ophir
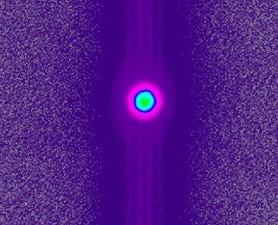
Figure 2. Smearing in SP920, 1070 nm. Image Credit: MKS Ophir
Some CMOS cameras exhibit blooming, which can be understood as a different, less severe form of beam broadening for NIR light. Blooming has been attributed to poorly absorbed NIR light bouncing off the back of the silicon wafer in which the CMOS pixel array has been formed. This NIR light diffracts sideways, causing blooming.
The photodiode pixels and accompanying transistors in a typical CMOS sensor are fabricated in the top layer of a silicon substrate. Metal wires are deposited on top of this to transmit the data for further processing.
In the backside-illuminated sensor, silicon is flipped and thinned, enabling the illumination of photodiodes without metal wires shading them. This increases the photodiode’s light-collecting efficiency and improves sensitivity.
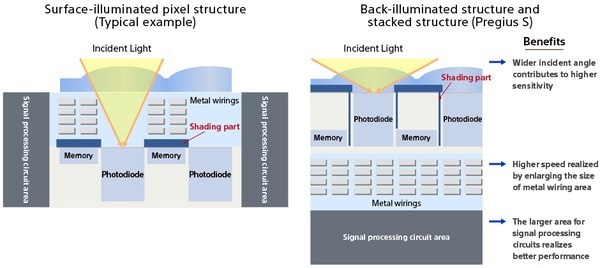
Figure 3. Image Credit: https://www.sony-semicon.com/en/technology/industry/pregius.html
Signal processing circuitry in the latest backside-illuminated sensors is embedded in a separate layer underneath the sensing layer, rather than in the same layer off to the side. These layers can be independently optimized for their respective tasks, resulting in reduced noise and increased saturation levels.
Blooming is also greatly reduced in the thinner silicon of the backside-illuminated CMOS sensor. Figure 4 compares blooming in a frontside-illuminated sensor and a backside-illuminated sensor.
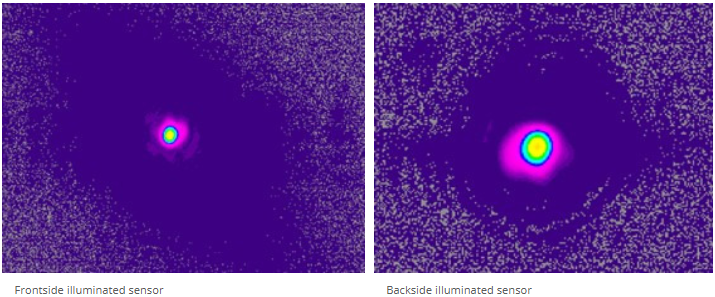
Figure 4. 1064 nm laser, 10 ms exposure. Image Credit: MKS Ophir
The new camera also boasts lower temporal dark noise, meaning it offers a significantly greater dynamic range and a higher sensitivity threshold than the company’s previous cameras.
Comparison of camera performance properties. Source: MKS Ophir
| Camera |
SP920 |
SP932 |
SP204S |
| Sensor |
CCD |
CMOS,
frontside ill. |
CMOS,
backside ill. |
| EMVA data |
|
|
|
| Quantum efficiency at 530 nm [%] |
54.62 |
71.61 |
73.7 |
| Gain K [DN/e-] |
6.9061 |
5.7837 |
0.58 |
| Inverse Gain 1/K [e-/DN] |
0.1448 |
0.1729 |
1.730 |
| Temporal dark noise (read noise) [e-] |
12.0473 |
15.4 |
2.2 |
| Signal to Noise Ratio SNRmax |
95.5324 |
103.9763 |
80.1 |
| 1/SNRmax [%] |
1.0468% |
0.9618% |
1.2% |
| Signal to Noise Ratio SNRmax [dB] |
39.603 |
40.3387 |
38.1 |
| Signal to Noise Ratio SNRmax [bits] |
6.5779 |
6.7 |
6.3 |
| Absolute sensitivity Threshold μp.min [photons] |
22.9715 |
21.75 |
3.7 |
| Absolute sensitivity Threshold μe.min [e-] |
12.55 |
15.58 |
2.7 |
| Saturation Capacity μe.sat [e-] |
9126.4 |
10811 |
6415 |
| Saturation Capacity μp.sat [photons] |
16709 |
15097 |
8710 |
| Dynamic Range |
727.3562 |
694.0765 |
2340 |
| DR [dB] |
57.2349 |
56.8281 |
67.4 |
| DR [bits] |
9.5065 |
9.439 |
11.2 |
| DSNU1288 [e-] |
5.1395 |
6.4715 |
0.3 |
| DSNU1299 [DN] |
35.4895 |
37.4334 |
0.2 |
| PRNU1288 [%] |
0.8304 |
1.2753 |
0.4 |
| Linearity error LEmin [%] |
-1.254 |
-0.0823 |
-0.1 |
| Linearity error LEmax [%] |
1.0284 |
0.3258 |
0.1 |
| Dark current [e-/sec], μI.mean |
|
|
0.15 |
| Camera Temperature [C] |
65 |
58 |
|
BeamSquared and the New CMOS SP204S Camera
The new camera’s most relevant improvement in terms of the M2 measurement is its smaller pixel size. The SP204S 2.74 μm pixels are 61% smaller than those of the SP920, meaning that the new camera can better measure smaller focal spots.
This improved capability also allows the use of shorter focal-length lenses for a specific input beam size or the measurement of larger beams for a specific focusing lens.
Images in the near IR range tend to exhibit broadening at moderate spot sizes and short exposure times. Broadening in a few data points is diluted when fitting to the full data set, so this improvement is only weakly reflected in the calculated M2 parameters.
Good agreement was observed when comparing the measured beam parameters of different lasers using the old and new cameras (Figure 6). The values agree to within 1 or 2%, well within the specifications. The only exceptions were the waist location (which is known to have a larger relative error) and the M2 value for the IR laser.
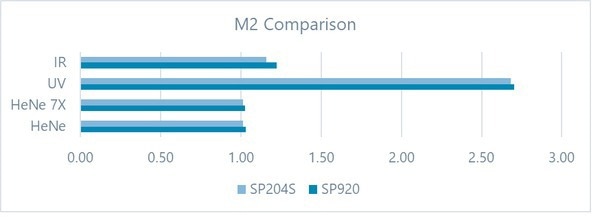
Figure 5. Comparison measurements between the old and new cameras. Image Credit: MKS Ophir
Source: MKS Ophir
| Parameter |
Laser |
SP920 |
SP204S |
%Change |
| M-squared |
HeNe |
1.03 |
1.01 |
-1.5% |
| HeNe 7X |
1.03 |
1.01 |
-1.6% |
| UV |
2.70 |
2.68 |
-0.8% |
| IR |
1.22 |
1.16 |
-5.0% |
| Waist Width (mm) after lens |
HeNe |
199 |
197 |
-0.8% |
| HeNe 7X |
71.4 |
71.0 |
-0.6% |
| UV |
213 |
211 |
-0.9% |
| IR |
73.8 |
74.0 |
0.3% |
| Waist Location (mm) laser |
HeNe |
1431 |
1432 |
0.0% |
| HeNe 7X |
1888 |
1814 |
-3.9% |
| UV |
10526 |
10905 |
3.6% |
| IR |
2153 |
2147 |
-0.3% |
| Rayleigh Length (mm) laser |
HeNe |
370 |
367 |
-0.6% |
| HeNe 7X |
25601 |
25769 |
0.7% |
| UV |
18838 |
18761 |
-0.4% |
| IR |
66.6 |
67.2 |
0.8% |
| Divergence (mrad) laser |
HeNe |
1.50 |
1.49 |
-0.4% |
| HeNe 7X |
0.180 |
0.178 |
-1.1% |
| UV |
0.264 |
0.263 |
-0.6% |
| IR |
4.99 |
4.85 |
-2.8% |
| BPP (mm mrad) laser |
HeNe |
0.21 |
0.20 |
-1.2% |
| HeNe 7X |
0.21 |
0.20 |
-1.5% |
| UV |
0.323 |
0.320 |
-0.9% |
| IR |
0.41 |
0.39 |
-5.1% |
Some broadening still occurs for the smallest NIR spots when using the SP204S, but this will only affect a few of the measurement points in the M2 measurement of the largest input beams, notably above 4 mm diameter, when employing a 600 mm focal-length lens. The impact on the derived beam parameters will remain minimal.
The standard deviation for successive measurements on a given camera and for the measurements between different units is low, highlighting good repeatability (see Figure 6).
The value derived for the waist location remains the exception, however, with a varying standard deviation between 4 and 14%. This variation becomes relatively small when normalized by the Rayleigh length rather than by the waist-location value itself (see the table below).
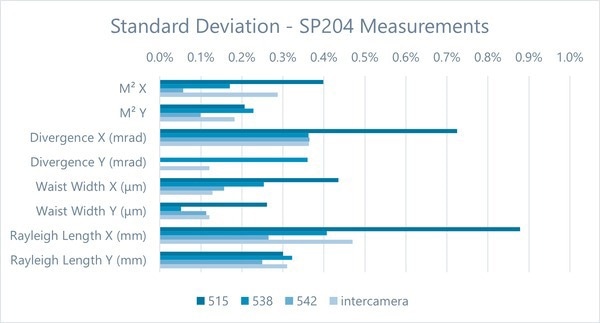
Figure 6. Standard deviation in three measurements taken with each camera and between the averaged readings of the three cameras. Image Credit: MKS Ophir
Standard deviation in waist location relative to location value and Rayleigh length. Source: MKS Ophir
| |
|
Waist Location
X (mm) |
Waist Location
Y (mm) |
| 515 |
Relative to location |
5.0% |
-13.7% |
| |
Relative to Rayleigh's length |
0.8% |
0.7% |
| 538 |
Relative to location |
4.0% |
-7.5% |
| |
Relative to Rayleigh's length |
0.6% |
0.4% |
| 542 |
Relative to location |
8.8% |
-3.0% |
| |
Relative to Rayleigh's length |
1.2% |
0.1% |
| Between cameras |
Relative to location |
8.1% |
-10.8% |
| |
Relative to Rayleigh's length |
1.2% |
0.6% |
Conclusion
The new BeamSquared camera has been confidently shown to be superior to its predecessor, but its benefits may go unnoticed when performing routine measurements. When equipped with an SP204S camera, it exhibited reduced broadening and may yield slightly smaller M2 values at NIR wavelengths.
Acknowledgments
Produced from materials originally authored by Mark Ivker, Sneha Patil, and Karol Sanilevitch from Ophir Photonics Group.

This information has been sourced, reviewed, and adapted from materials provided by MKS Ophir.
For more information on this source, please visit MKS Ophir.