Raman spectroscopy is a well-established and powerful analytical tool for measuring both organic and inorganic chemicals. It is widely used in academic and corporate research and development, industrial process monitoring and control, and for the routine identification of illicit drugs, pharmaceuticals, explosives, and hazardous materials.
A Raman analyzer consists of three key components: A light source, a detection module, and a sampling interface. The choice of the best components for Raman analysis generally depends on the application.
Lasers for Raman Analyzers
Raman spectroscopy is predicated on the ability to measure a shift in wavelength (or frequency) and, therefore, a monochromatic excitation source, should be used. The most common excitation source in most modern Raman instruments is a laser. A key consideration when selecting a Raman laser is its wavelength. The Raman signature and specific peak position of any material are related to the material’s unique chemical structure. As a result, the molecular fingerprint remains the same, regardless of the excitation laser wavelength.
However, different excitation wavelengths have distinct strengths and weaknesses, allowing users to optimize measurements for specific samples by selecting the appropriate laser wavelength. Several excitation options are available for different applications, with the three most commonly used being 532 nm, 785 nm, and 1064 nm.
Factors to Consider for Laser Wavelength Selection
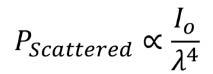
Raman Signal Strength: The most prominent difference is the excitation efficiency. Raman scattering efficiency is proportional to λ-4, where λ is the laser wavelength. Raman scattering at 532 nm is 4.7 times more efficient than at 785 nm and 16 times more efficient than at 1064 nm. This effectively means that longer wavelengths require comparatively longer scan times, assuming all other conditions remain the same.
Fluorescence: Fluorescence can interfere with Raman spectral measurements and is often the decisive factor when choosing a Raman excitation wavelength. Although the generation of fluorescence is similar to Raman scattering, it is based on a photoluminescence mechanism. Fluorescence emission is typically broadband, with bandwidths of many tens of nanometers, whereas the bandwidths of Raman peaks are significantly narrower, often a fraction of a nanometer.
In practice, fluorescence in a Raman spectrum is observed as a broad, intense background upon which the Raman scattering peaks are superimposed. Fluorescence is generally much more intense than Raman scattering, so it can add significant shot noise to the Raman spectrum, or, in some cases, overwhelm the Raman signal completely, preventing Raman analysis.
Fluorescence is often due to impurities in the sample, and a phenomenon known as photobleaching can be used to reduce its impact. However, the preferred solution to handling fluorescence is to move to longer laser wavelengths, where fluorescence is not generated. Fluorescence is often seen when measuring dark samples, dyes, and natural products.
Sample Heating: Sample absorption of laser energy must also be considered, as it can cause heating and alter the sample. Often, longer excitation wavelengths correspond to increased sample light absorption and greater heating effects. In extreme cases, low-volume liquid samples may boil, while colored, dark, or black samples may be damaged.
Laser energy absorption-related sample damage can be mitigated by rotating the sample or reducing the laser power density at the sample. However, these approaches increase complexity and/or prolong measurement time. Therefore, although Raman is a non-destructive technology, improper measurement configurations may still result in sample damage.
Detectors for Raman Analyzers
The second key consideration when selecting a Raman instrument is the detection module. Due to the highly selective nature of Raman spectra, they may include closely spaced peaks that may need to be resolved depending on the application. This can be achieved using a high-resolution spectrometer. These spectrometers can provide a range of configurations that are designed for high resolution and wide spectral range to provide the most spectral information. Standard spectral ranges are available from as low as 65 cm-1 (filter dependent) to as high as 4000 cm-1, with a spectral resolution as fine as 3 cm-1.
The data quality of Raman spectra, often reported as the signal-to-noise ratio (SNR), is greatly influenced by the choice of detector and its characteristics. Commonly used detectors for Raman analysis are charge-coupled devices (CCD) detectors and complementary metal-oxide semiconductor (CMOS) detectors for the UV and Visible spectral regions and indium gallium arsenide for the short-wave near-infrared region.
The choice of detector is also influenced by the number of detector elements, the degree to which the detector can be cooled, full-well charge capacity, readout noise, and readout speed.
Factors to Consider for Detector Selection
Detector Sensitivity: Wavelength sensitivity is a determining factor when choosing a detector for a Raman analyzer. Silicon-based CMOS and CCD detectors can be used to measure light between 180 and 1050 nm, with back-illuminated CCD's provide stronger response at longer wavelengths than front-illuminated CCD's or CMOS detectors. InGaAs arrays are generally used for measuring wavelengths between 900 and 2500 nm. Figure 1 shows the quantum efficiency of a typical back-thinned CCD detector and an InGaAs detector optimized for 1064 nm Raman analysis relative to the three common laser wavelengths used for Raman analysis.
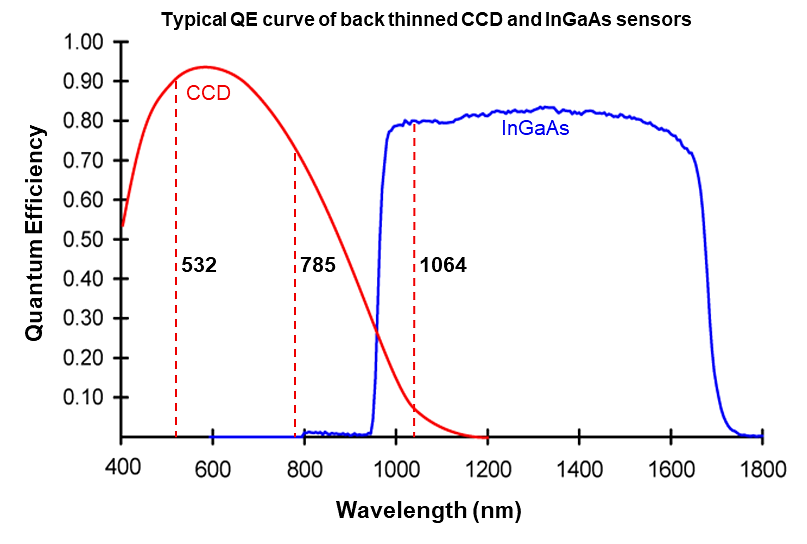
Figure 1. Quantum Efficiency (QE) curves for typical back-thinned CCD and InGaAs detectors versus wavelength, relative to the three common laser wavelengths for Raman analysis; 532nm, 785 nm, and 1064 nm excitation. Image Credit: Metrohm AG
Raman signals generated with 532 nm laser generally fall between 532 nm and 676 nm (0-4000 cm-1), where CCD and CMOS detectors exhibit optimal response. Raman signals generated with a 785 nm laser fall between 785 nm and 1050 nm (0-3200 cm-1), limited by the lower sensitivity of silicon detectors beyond 1000 nm.
Raman signals with a 1064 nm laser fall between 1064 and 1450 nm (0-2500 cm-1) and require the use of an InGaAs detector. These detectors have higher inherent noise than CCD and CMOS detectors. Combined with the lower Raman signal strength, Raman data from a 1064 nm Raman analyzer typically have lower data quality (signal-to-noise) than equivalent 532 nm and 785 nm Raman analyzers.
Furthermore, most dispersive 1064 nm Raman instruments incorporate a 512-pixel sensor, compared to 1024 and 2048 pixels for commonly used CCD and CMOS sensors. As such, 1064-nm Raman analyzers often involve a trade-off between spectral range and resolution. But with highly fluorescent samples, such systems are often the only option.
Detector Noise: There are three key sources of noise in a typical Raman analyzer. Readout noise is associated with transferring the signal off the detector. The detector sensor itself has a readout noise specification, and the support electronics to read out the array provides additional noise. Dark current is current that builds up charge in the detector when no light is falling on the detector elements. Dark current can be reduced by cooling the detector, most commonly using 1- and 2-stage thermoelectric coolers. . InGaAs detectors have higher dark noise than CCD detectors, so generally require deeper cooling to provide sufficient data quality for many Raman applications. Shot noise is proportional to the level of signal that is collected by the detector and is proportional to the square root of the signal collected.
Sample Interfaces for Raman Analyzers
One of the advantages of using visible and near-infrared light for measuring the properties of molecules is that the light can efficiently be coupled into fiberoptic cables, which can transmit the excitation wavelength and the collected Raman signals to the sample, allowing the analysis to be brought to the sample for in situ measurement. Fiber-optically coupled Raman probes typically have an 'excitation fiber' that brings the laser light to the probe. Optics in the probe direct and focus the laser light onto the sample and collect the Raman scattered light, removing most of the Rayleigh scattered signal that can overwhelm the Raman measurement. The probe optics couple the Raman light into a 'collection fiber', which directs the light to the spectrometer for measurement. A typical design for a Raman probe is shown in Figure 2.
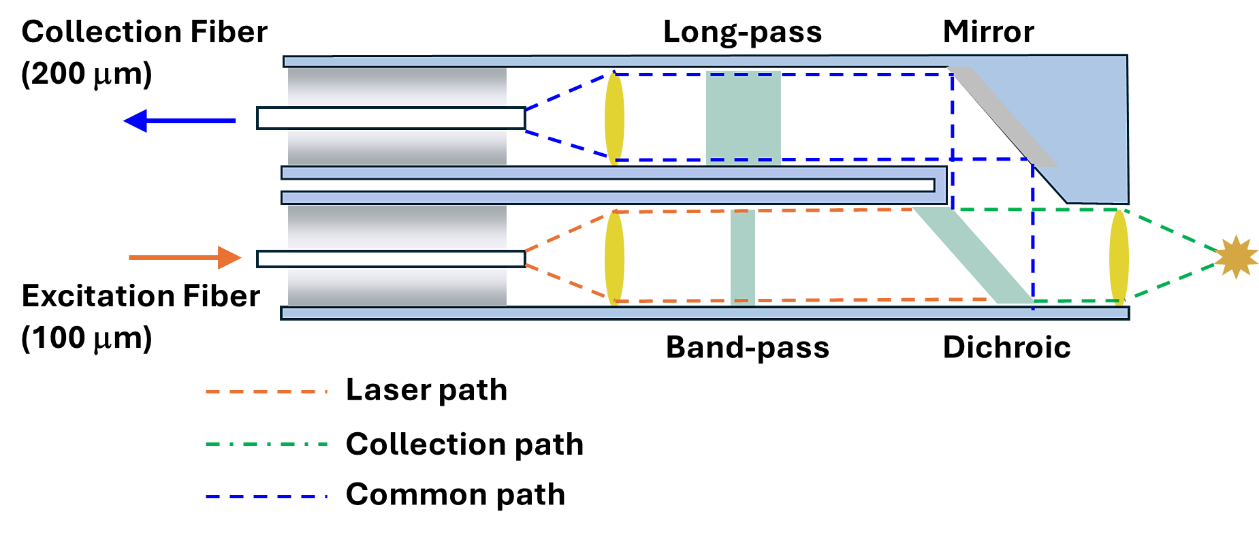
Figure 2. Typical design of a Raman probe. Image Credit: Metrohm AG.
Given that a pure signal is very important to Raman spectroscopy, a narrow band-pass filter is placed in the optical path of the excitation source before it reaches the sample to remove all light other than the laser line. This includes induced Raman signal from the silica typically used for optical fibers.
For collection geometry, many early Raman experiments utilized a 90-degree geometry between the excitation beam and the collected Raman signal. While this reduces the intensity of the unwanted Rayleigh scattering signal relative to the Raman signal of interest, it is challenging to ensure complete overlap of the excitation and collection optical paths.
Most Raman probes in use today use an epi-illumination geometry. Where the angle between the excitation and collection paths is 180 degrees. This is commonly referred to as a back-scattering geometry. This geometry ensures complete overlap between the excitation and collection geometries, as they are coincident. However, back-scattered collection results in the collection of a much higher intensity of the laser line, resulting in interference from Rayleigh scattering. In most Raman probes, the collected signal is filtered through a long pass filter or laser notch filter before it is directed to the spectrometer. The characteristics of these filters dictate how close to the laser line Raman peaks can be measured and results in the definition of a key characteristic of Raman probes called the Raman cut-on frequency.
The flexibility of fiber optics allows the probe to be taken to a solid sample and also enables it to be immersed in slurries or liquids in both process and lab environments. Fiber optic probes can also be coupled to cuvette holders, microscopes, and a host of sampling accessories, enhancing the utility of the Raman technique for a wider range of applications.
Examples
The Raman spectra of many common solvents and other clear/colorless liquids can be readily measured using all three standard excitation lasers. Figure 3 illustrates the spectrum of toluene using 532 nm, 785 nm, and 1064 nm lasers.
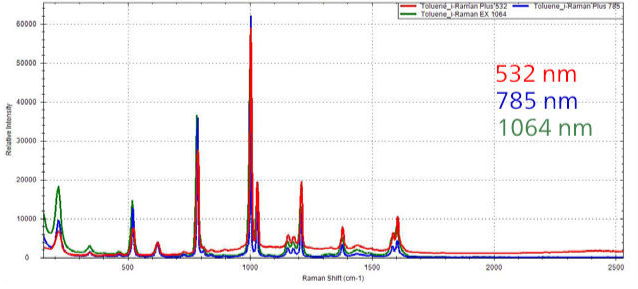
Figure 3. Raman Spectra of toluene measured using 532 nm, 785 nm, and 1064 m laser excitation. Image Credit: Metrohm AG
532 nm laser excitation: Using a 532 nm laser offers exceptional sensitivity and is widely employed to analyze carbon nanotubes, which may burn when using either 785 nm or 1064 nm lasers. Although laser power can be reduced for higher wavelengths, this also results in a lower SNR, often resulting in longer analysis times to achieve the desired data quality. 532 nm excitation is also well suited for metal oxides, minerals, and inorganic materials in general.
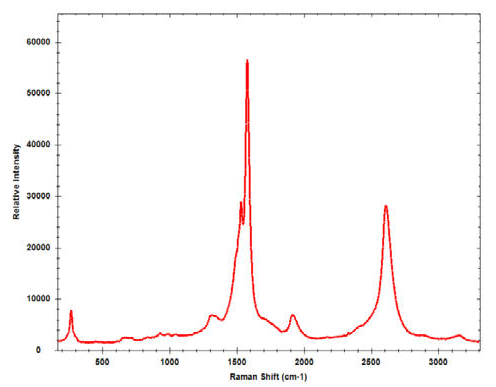
Figure 4. Raman spectrum of carbon nanotubes collected with 532 nm excitation. Image Credit: Metrohm AG
Another advantage of the 532 nm instrument is its ability to cover the full range from 65 cm-1 to 4000 cm-1. This offers potential benefits for certain applications involving distinct signals in the higher Raman shift region, such as the –NH and –OH functional groups between 2800 and 3700 cm-1.
785 nm laser excitation: Using 785 nm excitation works efficiently for more than 90 % of Raman-active materials while limiting fluorescence interference. Depending on the sample and the strength of the corresponding Raman signal, a single scan can take anywhere from one second to several minutes. Among the three standard wavelengths, the 785 nm offers the best balance of fluorescence reduction and spectral resolution, making it an ideal choice for many applications.
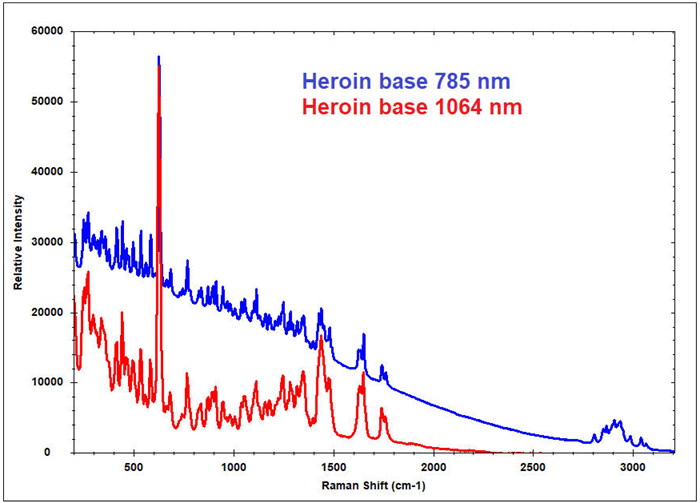
Figure 5. Raman spectra of heroin collected with 785 nm and 1064 nm excitation. In this case, the fluorescence reduction by the 785 nm laser is sufficient to result in a high-quality Raman spectrum while also providing data in the CH-stretch region. Image Credit: Metrohm AG
As illustrated in Figure 5, when heroin base is scanned using 785 nm and 1064 nm excitation, the 785 nm spectrum exhibits greater detail due to its higher resolution. In addition, this spectrum was collected with a significantly shorter integration time than the 1064 nm, 10 seconds versus over 60 seconds.
1064 nm laser excitation: For highly fluorescent samples, such as sesame oil, a dark liquid, a useful Raman spectrum can often only be measured using a 1064 nm laser excitation. In contrast, the Raman features in the spectra gathered from 532 nm and 785 nm are masked by strong fluorescence (Figure 6). Since it is the sample that is fluorescing and not an impurity, and because the sample is a liquid, photobleaching with the 785 nm wavelength is ineffective at removing the fluorescence background.
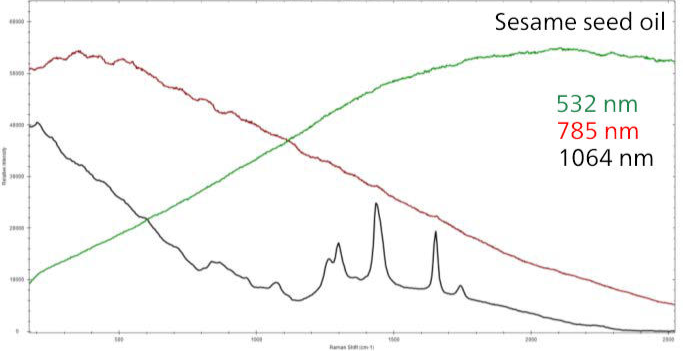
Figure 6. Raman spectra of sesame oil, overwhelmed by fluorescence when measured with 532 and 785 nm excitation, and with clearly evident Raman peaks at 1064 nm excitation. Image Credit: Metrohm AG
Summary
- Using a 532 nm laser provides the strongest Raman signals for the same incident laser power (mW) and can provide Raman data out to 4000 cm-1, which is key for some applications. However, many samples or impurities in samples exhibit strong fluorescence, which typically limits its use to samples such as carbon allotropes, clear/colorless liquids, and many inorganic materials. Silicon-based CCD and CMOS detectors are ideal for this wavelength.
- Using a 785 nm laser offers a balance of performance, producing lower Raman signals than an equivalent power at 532 nm, but with a significantly lower probability of fluorescence. It delivers the best economic performance, making it the preferred choice for most chemicals. A back-thinned CCD is often needed for this laser wavelength to enhance signals beyond 1000 cm-1.
- Using a 1064 nm laser offers superior fluorescence rejection, but generates the lowest intensity of Raman signal, so often requires longer acquisition times to achieve adequate signal quality. It is better suited for colored and darker materials such as natural products, dyes, oils, and colored polymers. An InGaAs detector is necessary due to the longer wavelengths of the Raman data. Such detectors require deeper cooling, producing spectra with lower spectral resolution, but often limiting the highest Raman shift data to around 2500 cm-1.
- Fiber-optically-coupled Raman probes have revolutionized the use of Raman analyzers in real-world samples by allowing the measurement to be brought to the sample, with fiber distances often exceeding 500 meters for some process applications, and with immersion probes allowing for many key in situ measurements, such as monitoring cell growth in Life Science applications.

This information has been sourced, reviewed and adapted from materials provided by Metrohm AG.
For more information on this source, please visit Metrohm AG.