Raman spectroscopy is a molecular spectroscopy, which is observed as inelastically scattered light and enables the interrogation and identification of vibrational (phonon) states of molecules. Therefore, Raman spectroscopy provides an invaluable analytical tool for molecular finger printing and for monitoring changes in molecular bond structure that can be induced by local environment, state changes, as well as physical stresses and strains.
Raman spectroscopy has several major advantages over other vibrational spectroscopy techniques, such as FT-IR and NIR spectroscopy. Some of these advantages stem from the fact that the Raman effect manifests itself in the light scattered off a sample as opposed to the light absorbed by a sample
The selection rules for vibrational spectroscopy indicate that, for a vibrational mode in a molecule to be IR/NIR active, the bond must possess a permanent dipole. For Raman scattering, the bond must exhibit a change in polarizability. This difference is one of the reasons these techniques are often considered complimentary analytical tools. IR and NIR are quite sensitive to structures such as carbonyls and hydroxy bonds, whereas Raman may be more sensitive to carbon-carbon bonds. Other bonds result in both IR/NIR absorption and Raman scattering and can be measured using any of these techniques.
In some cases, these differences are exclusive. Homonuclear diatomic gases, such as hydrogen, nitrogen, and chlorine have vibrations that are forbidden in the infrared, but that generate strong Raman signals. As another example, water has a very strong absorption in the infrared, so aqueous solutions typically very difficult to analyze using NIR/FTIR. The bonds in water are highly polarized, so are very weak Raman scatterers, readily enabling Raman analysis of a variety of aqueous samples, such as cell growth in stirred tank reactors.
Raman spectroscopy is highly selective, allowing it to detect and distinguish between molecules and chemical species that are very similar. Figure 1 illustrates an example of five common solvents. From top to bottom, these are acetone, ethanol, dimethyl sulfoxide, ethyl acetate, and toluene.
Although the molecular structure of these chemicals is similar, their Raman spectra are clearly differentiable, even to the untrained eye. With Raman spectral libraries, it is easy to see how easily material identification and verification can be performed using Raman spectra.
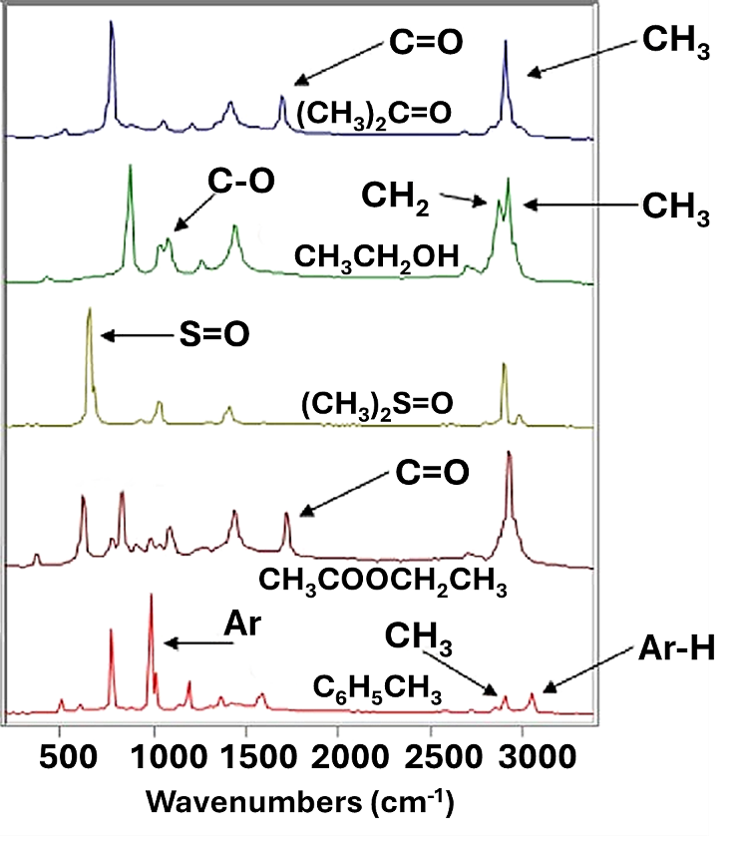
Image Credit: Metrohm AG
Theory of Raman Scattering
When considering Raman scattering, the physics can be thought about in one of two ways: the classical wave interpretation or the quantum particle interpretation. In the classical wave interpretation, light is considered as electromagnetic radiation, which consists of an oscillating electric field that interacts with a molecule through its polarizability.
Polarizability is measured by the ability of an electron cloud to interact with an electric field. For example, soft molecules such as benzene have the tendency to be strong Raman scatterers, whereas harder molecules like water tend to be fairly weak Raman scatterers.
When considering the quantum particle interpretation, light is considered a photon, which strikes the molecule and then inelasticaly scatters. In this interpretation, the number of scattered photons is proportional to the size of the bond. For instance, molecules with large Pi bonds such as benzene have the tendency to scatter lots of photons, while water with small single bonds is often a very weak Raman scatterer. Figure 2 illustrates a visual comparison of the two methods.
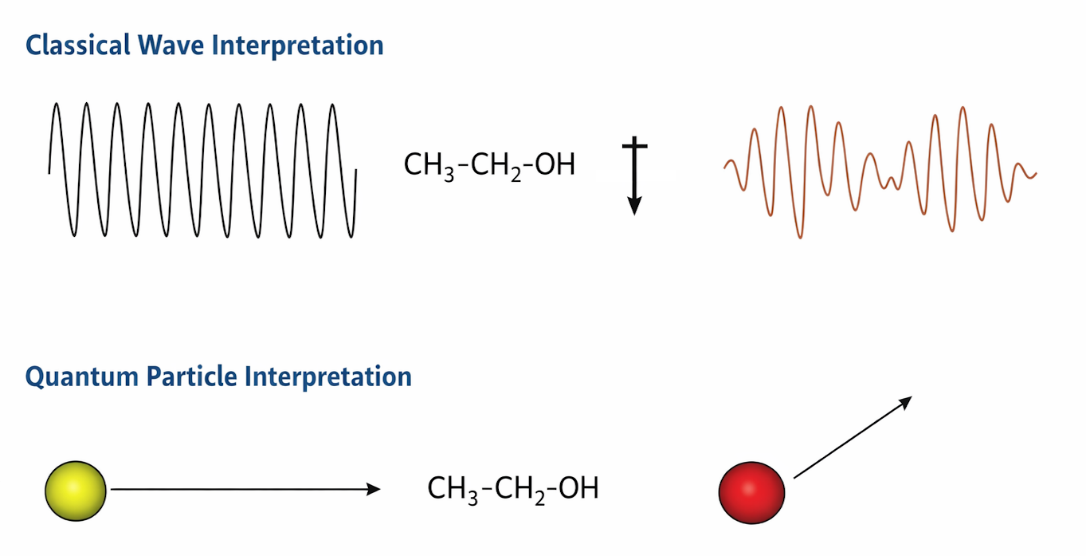
Figure 2. Comparison of Raman scattering interpretations. Image Credit: Metrohm AG
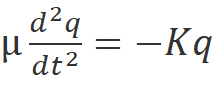
When deriving the Raman effect, it is often easiest to start with the classical interpretation by considering a simple diatomic molecule as a mass on a spring (Figure 3), where m is the atomic mass, x is the displacement, and K is the bond strength.
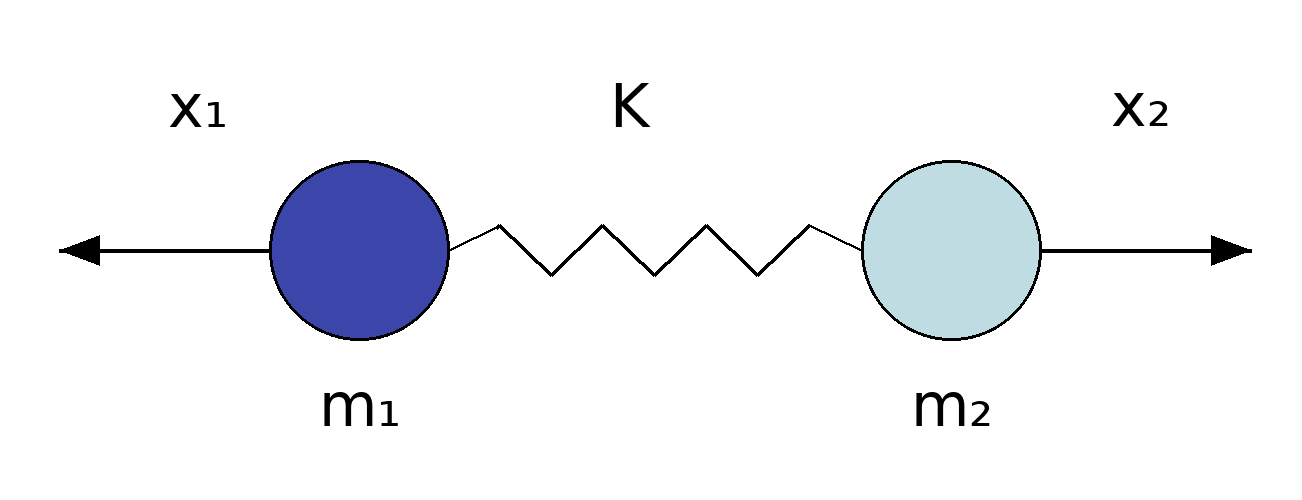
Figure 3. Diatomic molecule as a mass on a spring. Image Credit: Metrohm AG
When using this approximation, the displacement of the molecule can be expressed by using Hooke’s law as,
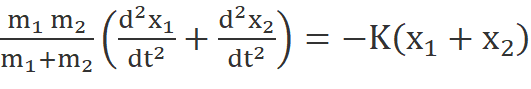 Equation (1)
By replacing the reduced mass (m1m2/[m1+m2]) with µ and the total displacement (x1+x2) with q, the equation can be expressed as,
 Equation (2)
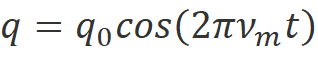
By solving Equation 2 for q we get,
 Equation (3)
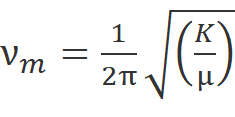
where nm represents the molecular vibration and is defined as,
 Equation (4)
Equations 3 and 4 indicate that the molecule vibrates in a cosine pattern with a frequency proportional to bond strength and inversely proportional to the reduced mass. From this, each molecule will have its own unique vibrational signature, which is determined by the characteristics of the individual bonds.
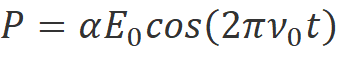
Through the Raman effect, these vibrational frequencies can be measured because the polarizability of a molecule, α, is a function of displacement, q. When incident light interacts with a molecule, it induces a dipole moment, P, equal to that of the product of the polarizability of the molecule and the electric field of the incident light source. This can be expressed as
 Equation (5)
where Eo is the intensity and no is the frequency of the electric field. Using the small amplitude approximation, the polarizability can be described as a linear function of displacement,
 … Equation (6)
Which, when combined with Equations 3 and 5, results in,
 Equation (7)
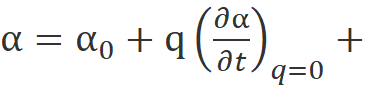
Equation 7 indicates that there are two resulting effects from the interaction of the molecule and the incident light. The first effect is called Rayleigh scattering, which is the dominate effect and results in no change in the frequency of the incident light. The second effect is the Raman scattered component and when expanded to
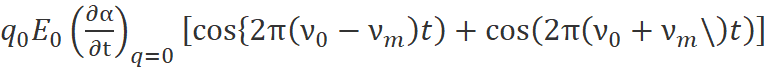 Equation (8)
Indicates a shift of the frequency of the incident light by plus or minus the frequency of the molecular vibration. The increase in frequency is known as an Anti-Stokes shift and the decrease in frequency is known as a Stokes shift.
By measuring the change in frequency from the incident light (typically only the Stokes shift is used for this measurement), the Raman effect now gives spectroscopists a way of directly measuring the vibrational frequency of a molecular bond.
Now that we have derived the Raman effect using the classical wave interpretation, we can use the quantum particle interpretation to better visualize the process and determine additional information. As discussed earlier in the quantum interpretation, the Raman effect is described as inelastic scattering of a photon from its interaction with a molecular bond. The Jablonski diagram shown in Figure 4 shows that this results from the incident photon exciting the molecule into a virtual energy state.
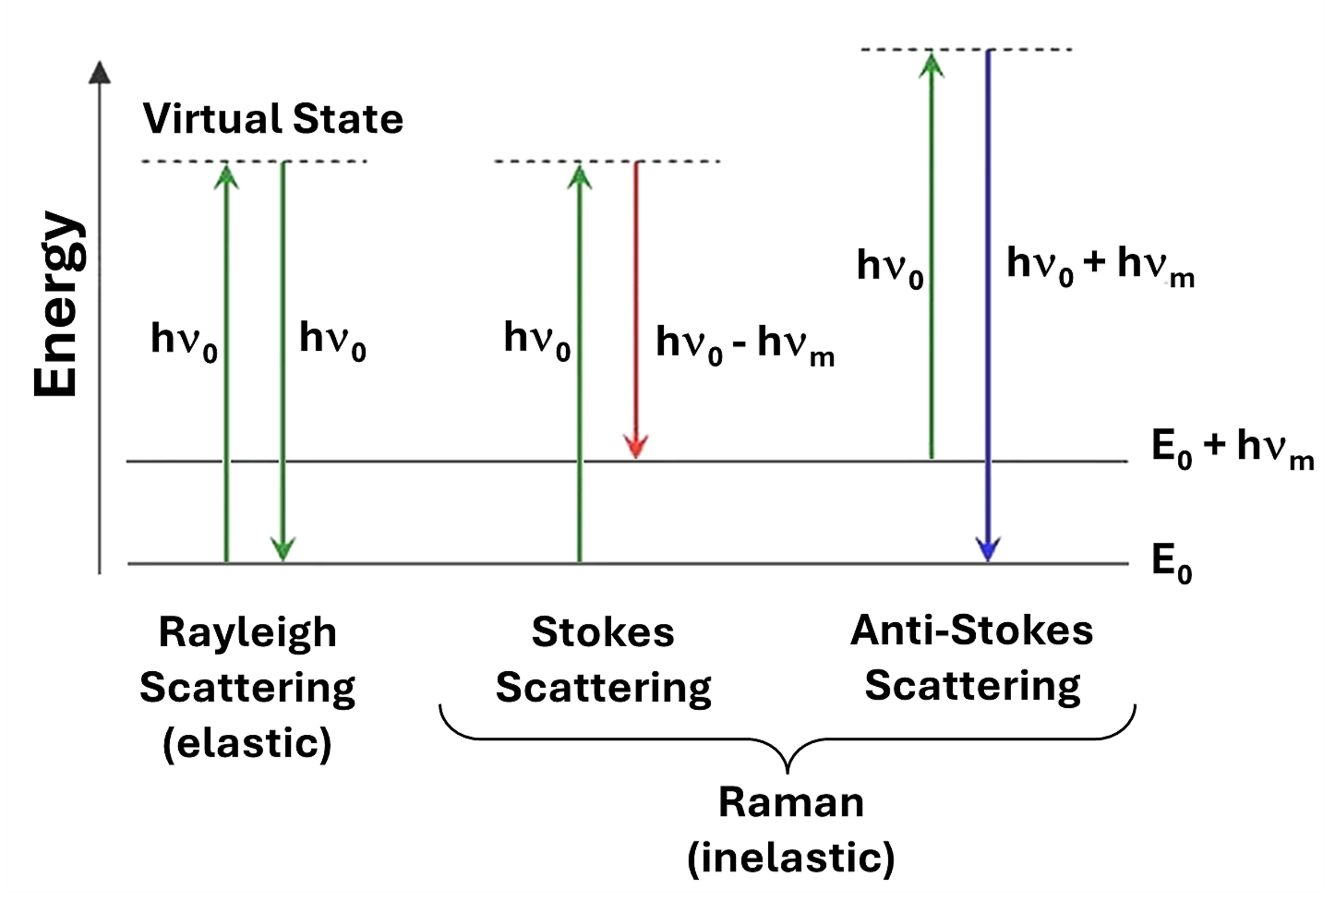
Figure 4. Jablonski diagram representing quantum energy transitions for Rayleigh and Raman scattering. Image Credit: Metrohm AG
When this occurs, there are three different potential outcomes. First, the molecule can relax back down to the ground state and emit a photon of equal energy to that of the incident photon; this is an elastic process and is again called Rayleigh scattering.
Second, the molecule can relax to a real state and emit a photon with less energy than the incident photon; this is known as Stokes shifted Raman scattering. The third potential outcome is that the molecule, which is already in an excited vibrational state, is excited to a higher virtual state, and it then relaxes back down to the ground state, emitting a photon with more energy than the incident photon. This is known as Anti-Stokes Raman scattering.
As most molecules will be found in the ground state at room temperature, there is a much lower probability that a photon will be Anti-Stokes scattered. Therefore, most Raman measurements are carried out considering only the Stokes shifted light.
Further investigation of the quantum interpretation of the Raman effect shows that the power of the scattered light, Ps, is equal to the product of the intensity of the incident photons, Io, and a value called the Raman cross-section, σR. It can be shown that,
 Equation (9)
where, λ equals the wavelength of the incident photon. Therefore,
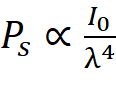 Equation (10)
Equation 10 illustrates that a linear relationship exists between the intensity of the incident light and the power of the scattered light. It also indicates that there is a relationship between the power of the scattered light and the inverse of the wavelength to the fourth power. Therefore, it is generally desirable to use a high-power excitation source and a short excitation wavelength based on these relationships.
Basic Function of Spectrometers
The primary function of a spectrometer is to collect light, separate it into its spectral components, digitize the signal as a function of wavelength, read it out, and display it on a computer. In the initial stage of this process, light is directed through a fiber optic cable into the spectrometer via an entrance slit, which is a narrow aperture.
As the light enters the spectrometer, it is vignetted by the slit. In most spectrometers, a concave mirror then collimates the divergent light and directs it onto a grating. After this, the grating disperses its spectral components at slightly different angles.
A second concave mirror focuses the light and images it onto a detector. Alternatively, a concave holographic grating can be used to perform all three functions simultaneously. This approach offers various advantages and disadvantages, which are outlined in the article, “An Introduction to a Spectrometer: Diffraction Grating”.
Once the light is imaged onto the detector, the photons are converted into electrons. These electrons are then digitized and read out to a computer via a USB or a serial port.
According to the number of pixels in the detector and the linear dispersion of the diffraction grating, the software interpolates the signal to produce a calibration that allows the data to be plotted as a function of wavelength over a given spectral range. This data can then be used and manipulated for a wide range of spectroscopic applications.

This information has been sourced, reviewed and adapted from materials provided by Metrohm AG.
For more information on this source, please visit Metrohm AG.