In order to aid their survival, microorganisms form biofilms on surfaces. Gingivitis and other periodontal infections can be caused by bacterial accumulation and biofilm formation in subgingival regions. Oral disease mechanisms can be understood better by studying microbial composition and biofilm architecture.
Researchers at Procter & Gamble and the Fraunhofer Institute for Interfacial Engineering and Biotechnology used the Renishaw inViaTM Raman microscope, and employed confocal Raman microscopy and multivariate analysis to predict and split the two-subgingival bacteria species in a biofilm model.
Spectra were collected, by researchers, from two early colonizing species of bacteria, namely Actinomyces denticolens and Streptococci oralis. 300 spectra were collected from a mono-species biofilm for each bacterial strain, which showed differences between the species in terms of peak intensities. A principal component analysis (PCA) was then employed in order to separate the two species into two distinct clusters.
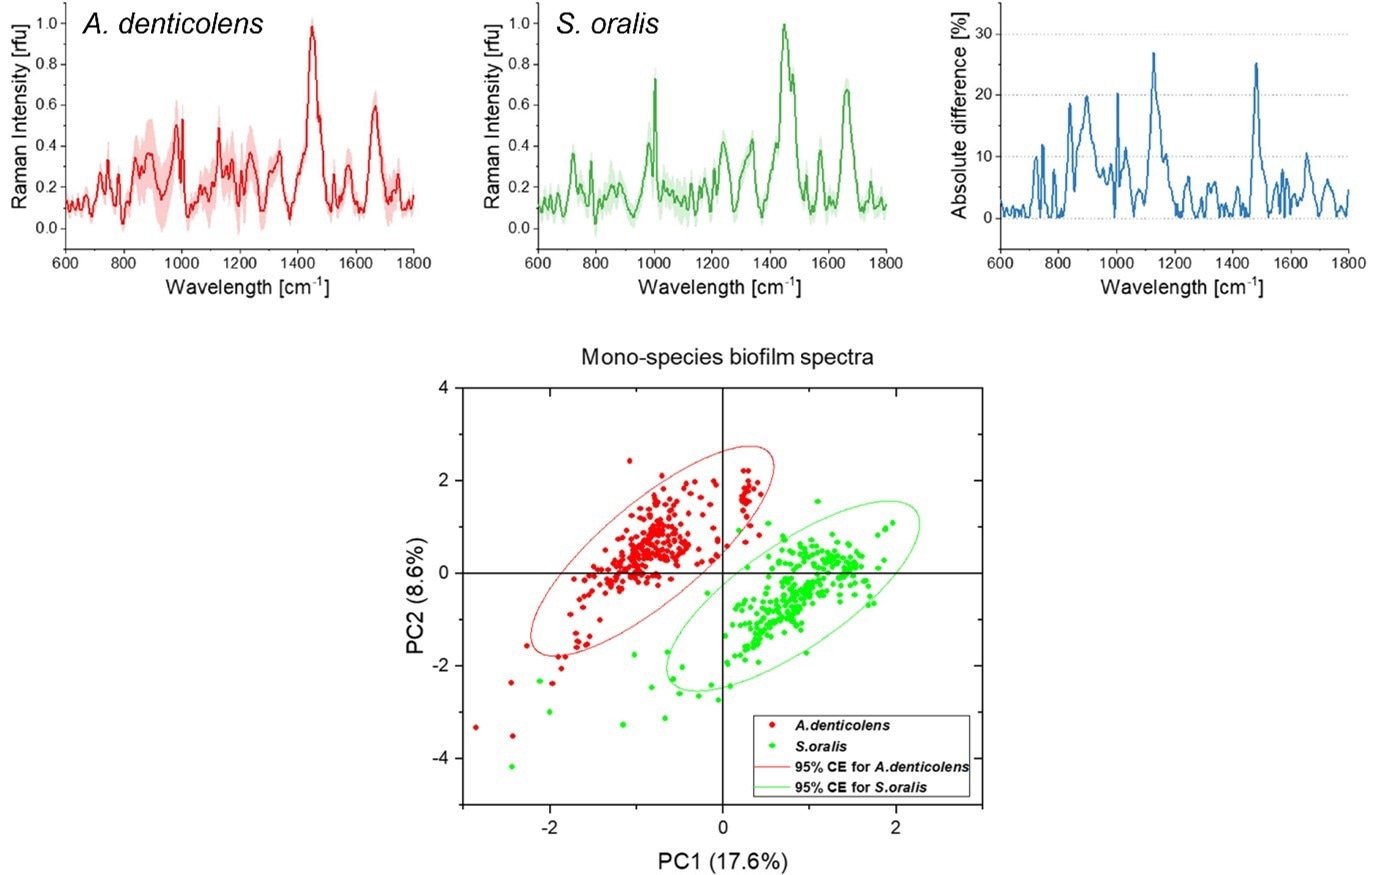
Average Raman spectra for A. denticolens and S. oralis mono-species biofilms. Spectral differences are represented in the absolute difference spectrum. The PCA score plot shows separation of the two bacterial species. Image Credit: Renishaw plc – Spectroscopy
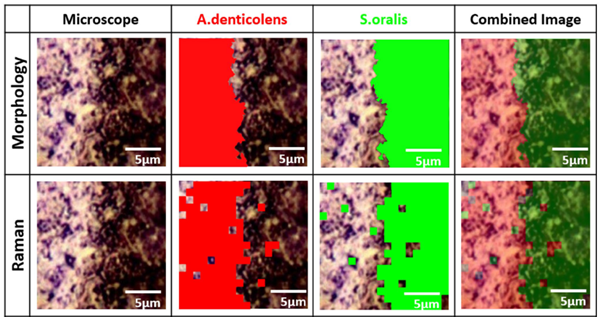
Analysis of A. denticolens and S. oralis distribution. Morphology analysis and Raman analysis were directly compared using the same sample region. Image Credit: Renishaw plc – Spectroscopy
The researchers next collected Raman maps from a sample containing
A. denticolens and S. oralis, once they had clearly separated the two bacterial species using PCA. On a slide, the two species of bacteria were grown adjacent to each other, and confocal Raman spectroscopy was used to map the interface region between them. The bacteria were identified and separated using cluster analysis, which then gave rise to a well-defined edge at the interface between the two species.
The researchers also performed a morphological analysis on the same sample regions for validation of Raman mapping. The bacteria were then separated based on their shape (rod-shaped vs round) by this technique. The same clearly-defined boundary between the two bacterial species was revealed by morphology analysis species, validating the Raman analysis.
Confocal Raman spectroscopy was then used by the researchers to analyze 15 random regions of an artificially grown bacterial biofilm. Cluster analysis was then used to separate A. denticolens and S. oralis in each region and then used to visualize the distribution of each species. The separation of the two bacterial species was validated by comparing the morphological analysis data with the Raman data.
The next step was to overlay the images from the two analyses: areas that could not be classified by morphological, or Raman analysis were labeled in blue.
The major clusters were correctly identified across all sample regions despite some discrepancies at the edges of the bacterial clusters. It was therefore confirmed that Raman spectroscopy could determine bacterial coverage in a dual-species biofilm.
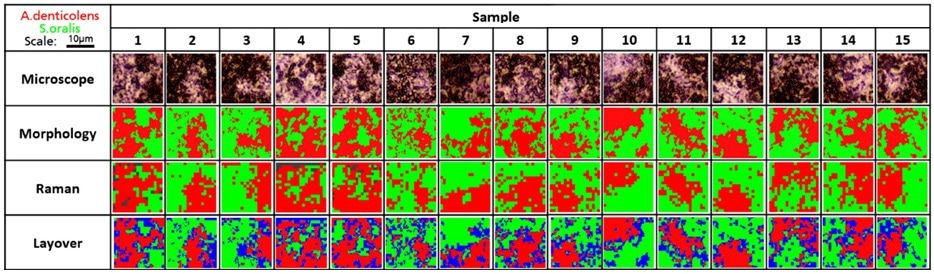
Analysis of A. denticolens and S. oralis distribution in dual-species biofilms. Morphology analysis and Raman analysis were directly compared. Layover images show areas where species classification differed between morphology and Raman analysis (blue). Image Credit: Renishaw plc – Spectroscopy
Conclusion
In conclusion, a non-destructive, affordable method for studying biofilms is presented by confocal Raman spectroscopy. Information about biofilm composition and architecture is provided by the chemical fingerprint generated with Raman. Spectra can be effectively separated based on small differences thanks to subsequent multivariate analysis. This therefore shows how Raman spectroscopy could further ameliorate our understanding of oral disease progression.
Note
This piece is a summary based on the piece Mapping of a Subgingival Dual-Species Biofilm Model Using Confocal Raman Microscopy, by Kriem Lukas Simon, Wright Kevin, Ccahuana-Vasquez Renzo Alberto, Rupp Steffen. This piece was originally published in Frontiers in Microbiology, 12, 2021; the original piece can be found by following this link: https://www.frontiersin.org/article/10.3389/fmicb.2021.729720
The content provided by this article is therefore a summary based on interpretations of the original article made by Renishaw employees. The content should therefore be interpreted as merely summaries and should not be read as a true representation of the author's original work. The licensor does not endorse Renishaw PLC in any way.
The original article is copyright © 2021 Kriem, Wright, Ccahuana-Vasquez and Rupp. This is an open-access article distributed under the terms of the Creative Commons Attribution License (CC BY).The use, distribution or reproduction in other forums is permitted, provided the original author(s) and the copyright owner(s) are credited and that the original publication in this journal is cited, in accordance with accepted academic practice. No use, distribution or reproduction is permitted, which does not comply with these terms.

This information has been sourced, reviewed and adapted from materials provided by Renishaw plc - Spectroscopy.
For more information on this source, please visit Renishaw plc - Spectroscopy.