As much of modern culture will attest to, there is perhaps very little in this world that captures the imagination in the way prehistoric life does. As anyone who has holidayed at Lyme Regis - a part of the Jurassic Coast UNESCO World Heritage site – will testify, finding fossils isn’t just something to pass the time; it’s thrilling and captivating, unlike anything else. Simply put, fossil finding is a link to a different world – a world that existed exactly where we are today, but of such a nature as to be almost incomprehensible.
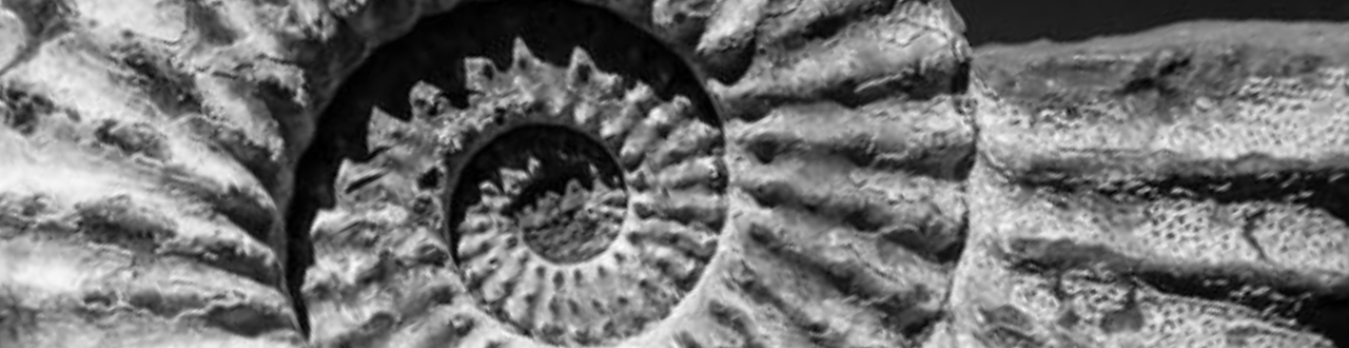
Image Credit: Renishaw plc - Spectroscopy
Raman imaging has, of course, been an established technique when it comes to determining the composition of minerals and inorganics within geological sections, showing the specificity to differentiate between material polytypes.
Raman imaging has improved rapidly over the years, becoming faster, and enabling improved context and representation of larger samples. Complex surface topographies can be accurately analyzed thanks to more recent additions of focus tracking capabilities (like Renishaw's LiveTrack™). Today, it is possible to analyze mineralogy and paleontology samples without having to section and polish them, which helps to reveal more detail about their native material properties.
Analyzing Ammonites
StreamLineTM Raman imaging with LiveTrack was used to analyze an ammonite fossil from Lyme Regis (Black Ven). A group of extinct molluscs, ammonites appear to have a form similar to shelled nautiloids, but in reality are more closely related to coleoids like octopuses and squid. Their nickname of ‘snake stones’ has derived from their characteristic shape. They are instantly recognizable within the vast array of rocks and pebbles, to the well-trained eye of a fossil hunter.
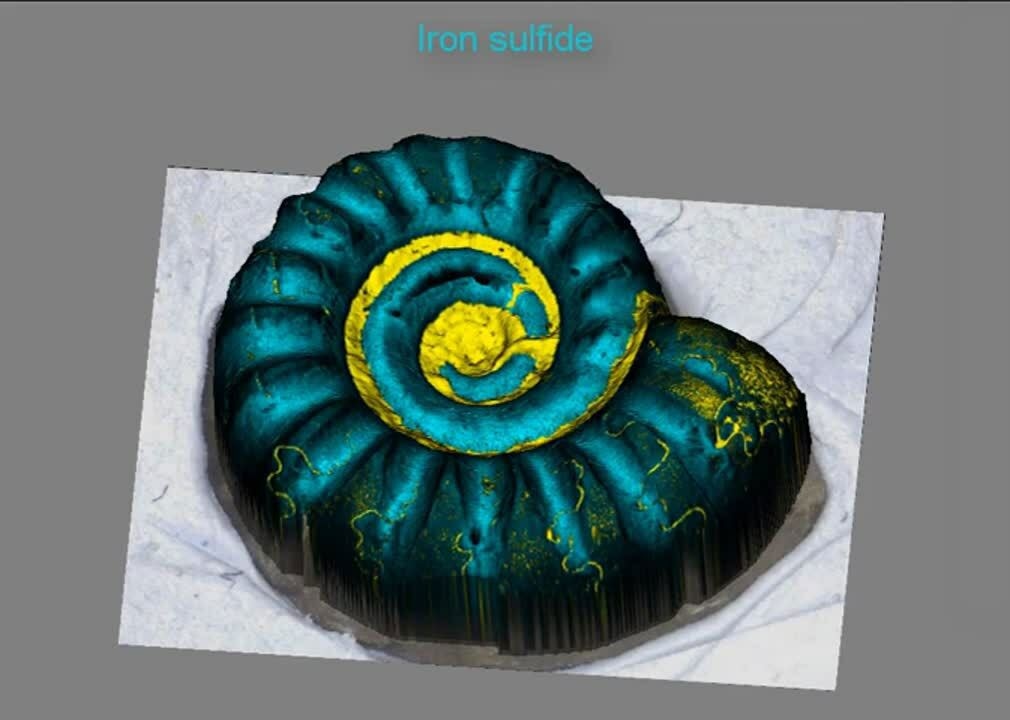
Over 1 million spectra were collected from the sample. StreamLine Raman data was used to identify the different materials, and the chemical images were generated in conjunction with WiRE software masking. These images depict both surrounding material and fossils, comprised of calcium carbonate and iron sulfide. Subtle changes in crystallinity and stress are also revealed, as well as detailed images of the different materials present.
These changes can be seen against the context of the 3D topographical image, where the topographical features (septa) correlate with the crystallinity and stress of iron sulfide. The peaks of the septa correlate with low iron sulfide crystallinity, which varies in position by 3.5 cm-1 (341 cm‑1 Raman band). The edges of the septa peaks (the regions of maximum septa curvature) correlate with compressive iron sulfide stress and vary in Raman band position from 339.11 cm-1 to 343.10 cm-1.
Typically, ammonites have suture patterns on their shells. These patterns are generally one of three main types, which correlate to the time period in which the ammonite lived. It is possible to show that these patterns produce increased optical fluorescence, which correlates to the presence of calcium carbonate. This then facilitates an enhanced contrast relative to the white light image.
The detailed chemical and property information shows the value of Raman data in understanding real world samples without sample preparation. Viewing this against the context of surface topography, which is enabled by Renishaw's LiveTrack technology, gives an incredible recreation of the material. So, the next time you are at the beach, consider the fossils beneath your feet – and maybe even think about the detailed studies which Renishaw’s Raman equipment can help you perform!
Acknowledgments
Produced from materials originally authored by Tim Smith, Applications Manager from Renishaw.

This information has been sourced, reviewed and adapted from materials provided by Renishaw plc - Spectroscopy.
For more information on this source, please visit Renishaw plc - Spectroscopy.