Transparent materials influence the phase evolution of transmitted radiation, however, chromatic dispersion is an issue. Ossiander, M et al.'s article published in Nature Communications experimentally displays the use of ultrathin nanostructured coatings that address this dispersion.
Image Credit: GiroScience/Shutterstock.com
Femtosecond light pulses have become the major tools in medicine, microscopy, technology, and physical chemistry as they are the core of the uppermost achievable time resolutions and electrical field intensities to date. However, a major challenge in their application is dispersion control–as all transparent materials are generally dispersive in the visible, ultraviolet, and near-infrared regions, a wavelength below 1.3 μm.
Dielectric metasurfaces have been used recently in an angular-dispersive Fourier-transform setup to provide fine-grained regulation of the time-domain properties of ultrashort laser pulses.
The study details the use of ultrathin nanocoatings that trigger anomalous group delay dispersion directly on transmission.
Figure 1a illustrates the approach. The nanocoatings can be applied easily to traditional optics and compensate for their group delay dispersion. They can also be introduced into existing laser setups to compress ultrashort laser pulses. The high-aspect-ratio nanopillar coating presented in the article puts together anomalous dispersion, high transmission, and broadband operation.
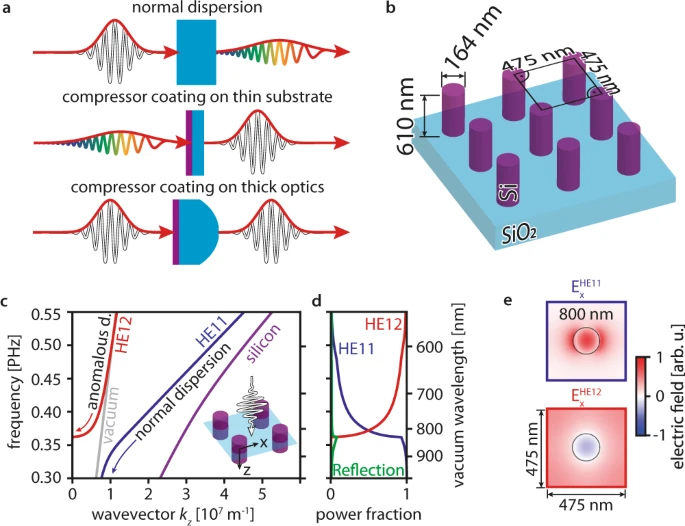
Figure 1. Nanocoating compressor working principle and design. (a) Chromatic dispersion effect on ultrashort laser pulses in transparent materials and possible coating applications. Short pulses are marked in white, pulses stretched by material dispersion in colors; normally dispersive materials (light blue) elongate short pulses. The coating (purple) can either be applied to a thin substrate to shorten elongated pulses or to thick optics to compensate for its group delay dispersion. (b) Design optimized for operation at 800 nm wavelength. (c) Dispersion of the predominant modes calculated for a two-dimensional cross-section (illustrated in the inset) perpendicular to the light propagation direction. The modes are labeled with the names of hybrid fiber modes with the same symmetry (HE11-like: blue line, HE12-like: red line). The vacuum (gray line) and silicon dispersions (purple line) are also plotted. One should note that the HE12-like mode’s propagation constant is real above the vacuum line because light leaking out of a single nanopillar is not lost from the array. The mode’s wavevector along the propagation direction kz vanishes (kz = 0) at a frequency of 0.36 PHz (825 nm). As this cutoff is approached, the group velocity decreases (slow light), creating a region with anomalous group velocity dispersion (see red arrow marked anomalous d.)(d) Power coupling fraction from free space to the HE11-like and HE12-like modes. The transition from light propagating in the HE12-like to the HE11-like mode at 0.36 PHz (825 nm) increases the working bandwidth. Power reflected by the compressor is plotted in green. (e) Transverse electric field distributions of the modes at 800 nm wavelength. Whereas the HE11-like mode has no inflection points, the HE12-like mode has one inflection point. Image Credit: Ossiander, et al., 2021
Frequency-dependent group delay is used to quantify the impact of transmissive optics on the ultrashort laser pulses’ time-domain profile.
Results
The approach detailed for generating a transmissive compressor coating employs uniform circular amorphous silicon nanopillars, and its working principle was approached from the perspective of an array of waveguides.
Investigation of the dispersion of a two-dimensional compressor cross-section was carried out. As the compressor is huge compared to its periodicity, light leaking out from a single nanopillar is not lost.
For the ultimate design, the researchers discovered promising design parameters by analyzing a huge parameter space with rigorous coupled-wave analysis. The parameters (height, nanopillar radius, and unit cell size) were employed as a starting point for fine-tuning the design. The resultant compressor geometry exhibited strong anomalous GDD centered at 800 nm wavelength (see Figure 2a–c). The GDD values obtained were compared to numerous commercially available chirped mirrors.
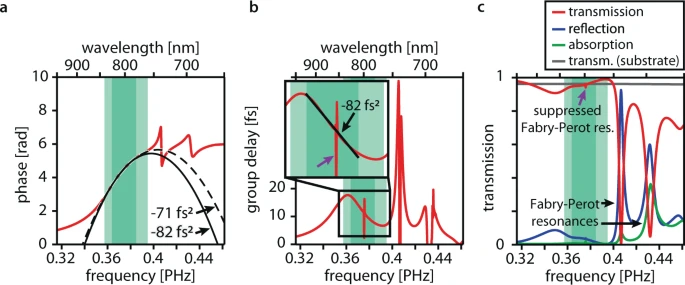
Figure 2. Finite-difference time-domain (FDTD) modeling results for the compressor coating. (a) Transmission phase profile (red line) predicted by FDTD simulations for the compressor design is displayed in Figure 1b. The dashed black line is a parabolic fit to the phase profile within the full working range (light green area) and the solid black line is a parabolic fit to the phase profile within the linear working range (dark green area). The fits are labeled with the curvatures of the parabolae, which is the group delay dispersion. The downward curvature of the parabolae indicates anomalous dispersion. (b) Simulated transmission group delay profile (red line), i.e., the derivative of the transmission phase profile. The inset shows the magnified working ranges. The black line represents a linear fit to the linear working range (dark green area) and is labeled by its group delay dispersion. The downward slope indicates anomalous dispersion. In the full working range (light green region), the group delay deviates by <2 fs from a linear profile. A narrowband (<1 nm) residual signature of the suppressed Fabry-Perot resonance in the working range is marked with a purple arrow in b and c. (c) Simulated transmission (red line), reflection (blue line), and linear absorption characteristics (green line) of a compressor-coated silicon dioxide substrate surface. Two-photon absorption in the compressor coating remains below 1% for incident intensities beyond 50 GW cm−2. The transmission of the uncoated surface is plotted as a reference (gray line). The working ranges (green areas) are marked as a guide to the eye. Image Credit: Ossiander, et al., 2021
The nanopillar diameter alteration causes the broadband Mie-type transverse magnetic dipole resonance to be spectrally shifted to accomplish anomalous dispersion at the required central wavelength. The magnitude of the introduced anomalous dispersion can be controlled by altering the nanopillar height.
The introduced design showcases an undesirable narrowband Fabry-Perot resonance in the spectral working range (see Figure 2c). Figure 3a depicts a sample imaged with scanning electron microscopy.
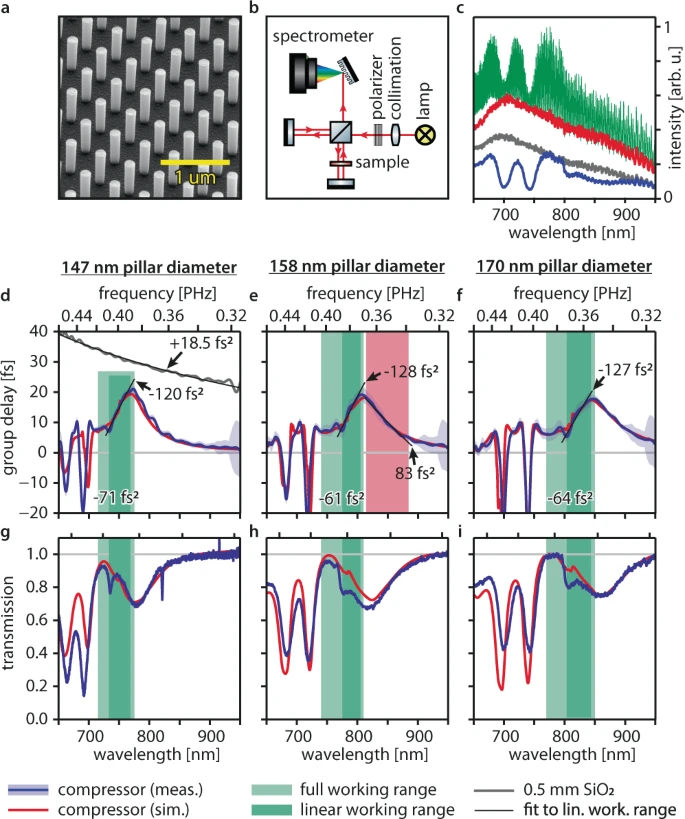
Figure 3. White-light interferometry of compressors designed for different operating wavelengths. Samples are labeled by the nanopillar diameter. (a) Scanning electron microscope picture of the compressor with 158 nm nanopillar diameter. (b) White-light interferometer setup. Thermal radiation from a tungsten lamp (red lines) is collimated, polarized, and then split in a Michelson interferometer. Light in one interferometer arm passes the sample twice, light in the other arm is delayed. The variable delay between the two arms causes spectral intensity oscillations associated with the compressor group delay dispersion that are recorded by a grating spectrometer. (c) Example of white-light interferometer raw data for the sample with 170 nm nanopillar diameter. Interference spectrum (green); spectrum transmitted by the compressor when the reference arm is blocked (blue) and when the compressor sample is replaced by a fused silica substrate and the reference arm is blocked (gray); the spectrum of the lamp, when the sample arm is blocked (red). (d–f) Compressor group delay profile measured by white-light interferometry (blue lines). FDTD simulations (red lines) account for 4 nm nanopillar diameter fabrication tolerance. The black lines are linear fits to the measured group delay profiles in the linear working ranges (dark green areas) and are labeled with their group delay dispersion (slope). The average group delay dispersions in the full working ranges (light green areas) are also indicated. The red area in e marks the spectral region in which the compressor coating imprints positive group delay dispersion. The measured group delay profile of the fused silica substrate (gray line) and a fit to it (black line) are shown for reference. Both were shifted vertically to fit the plotting region. The blue-shaded areas represent the measurement uncertainty: to retrieve an upper bound for the systematic error, we compare a reference measurement on the fused silica substrate with its literature group delay profile. We then use the maximum deviation of the two in a 50 nm bandwidth around each wavelength point as uncertainty and add the standard deviation. (g–i) Measured (blue lines) and simulated (red lines) compressor transmission characteristics relative to the fused silica substrate transmission. Image Credit: Ossiander, et al., 2021
Both Table 1 and Figure 3 detail the experimental group delay characteristics of compressors for three various nanopillar diameters, evaluated with white-light interferometry.
Table 1. Experimental compressor characterization. Source: Ossiander, et al., 2021
| |
| Nanopillar diameter [nm] |
147 ± 7 |
158 ± 7 |
170 ± 6 |
| Full working range [nm] |
705–775 |
740–810 |
770–850 |
| Full working range average GDD [fs2] |
−71 ± 1 |
−61 ± 2 |
−64 ± 2 |
| Linear working range [nm] |
735–770 |
775–805 |
800–840 |
| Linear working range average GDD [fs2] |
−120 ± 2 |
−128 ± 6 |
−127 ± 4 |
| Full working range average transmission |
81% |
79% |
80% |
A residual signature of the suppressed Fabry-Perot resonance was observed and is deduced that close to unity transmission can be achieved employing enhanced fabrication. The group delay of the recognized compressor coatings decreases at wavelengths above the working range.
The viability of the concept in a real application was demonstrated by introducing a compressor in the course of a mode-locked titanium-sapphire oscillator. A second-harmonic frequency-resolved-optical-gating (SH-FROG, see Figure 4f) was employed to affirm the resulting changes in the femtosecond laser pulses directly in the time domain.
Registering the delay-dependent second-harmonic spectrum provided a spectrogram enabling reconstruction of the intensity and phase profiles of the laser pulses.
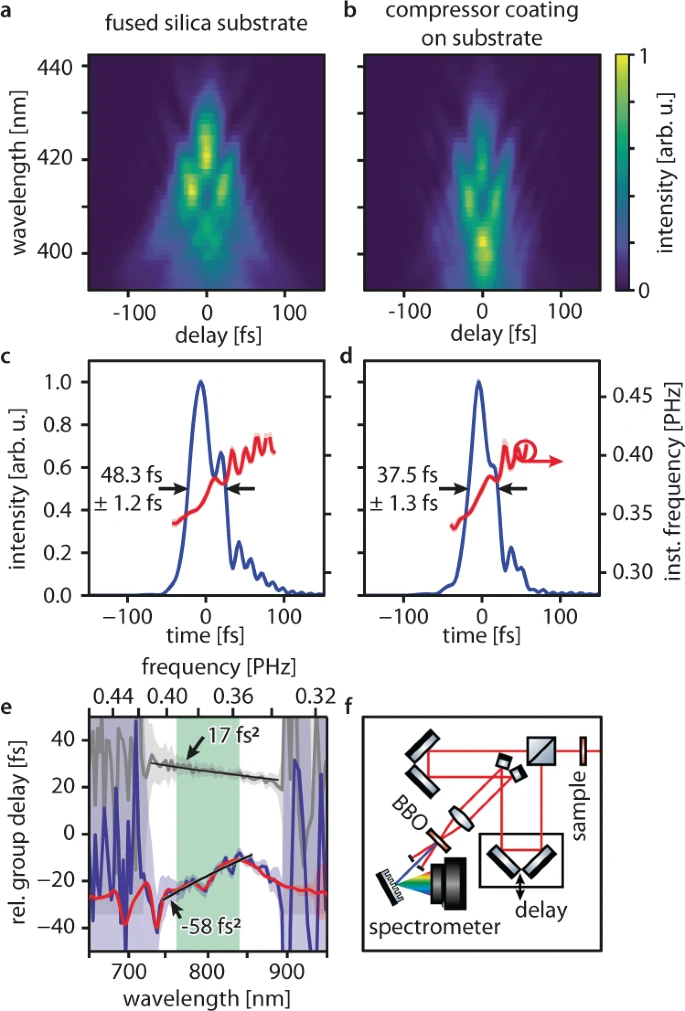
Figure 4. Compression of an ultrashort laser pulse. (a–b) Experimental second-harmonic frequency-resolved optical-gating (SH-FROG) spectrograms recorded after the incoming laser pulses are transmitted a through the fused silica substrate only and b through the compressor-coated substrate (nanopillar diameter 162 nm). (c) Time-domain intensity (blue line) and instantaneous frequency (red line) profiles of the laser pulses transmitted through the fused silica substrate retrieved using an iterative ptychographic reconstruction algorithm (see methods). The arrows indicate the pulse full-width at-half maximum duration. Standard deviations (blue and red shaded areas) were determined using the bootstrap method (see methods). (d) Time-domain intensity (blue line) and instantaneous frequency (red line) profiles of the laser pulses transmitted through the compressor-coated substrate. The measured full-width at-half maximum durations show the pulse shortening by 11 fs. (e) group delay profile retrieved from the SH-FROG measurements (SH-FROG measurement: blue line, white-light interferometer measurement of the same sample: red line) and least-squares fit (black line) to the data in the full working range (light green area). The group delay profile retrieved for the fused silica substrate (SH-FROG measurement: gray line) is displayed as a reference. (f) SH-FROG setup. The incoming laser pulses (red lines) are modified by the sample, split and delayed by the arms of an interferometer, and subsequently focused and overlapped noncollinearly in a beta-Barium-Borate (BBO) crystal. Second-harmonic radiation (blue line) generated by combining one photon from each arm is detected in a grating spectrometer for different delay times and reveals the temporal structure of the laser pulses. Image Credit: Ossiander, et al., 2021
Spectrograms for the laser pulses affected by the fused silica substrate, the input laser pulses, and the laser pulses after traversing the compressor and substrate were measured. Tables 2 and 3 summarize the spectral-domain results.
Table 2. Femtosecond pulse compression: laser pulse GDD in the full working range (760–840 nm). Source: Ossiander, et al., 2021
| Incoming pulse |
Substrate |
Compressor and substrate |
| (+191 ± 5) fs2 |
(+210 ± 4) fs2 |
(+154 ± 4) fs2 |
Table 3. Femtosecond pulse compression: optics GDD in the full working range (760–840 nm). Source: Ossiander, et al., 2021
| Substrate |
Compressor |
| (+17 ± 6) fs2 |
(−58 ± 6) fs2 |
The approach detailed can be used on traditional optics and does not need angular, spatial, or polarization pre-conditioning of the incoming light. The approach is flexible as group delay characteristics are evaluated by geometric properties, instead of material dispersion.
The technique can be expanded in the future for engineering complex pulse shapes for regulating chemical reactions and quantum systems or optimizing nonlinear mechanisms such as high-harmonic generation.
Methods
The researchers started by parametrizing the dispersion relation. Fabrication was carried out by depositing a 610 nm-thick amorphous silicon layer onto a 500 µm-thick fused silica substrate with a plasma-enhanced chemical vapor deposition.
An additional layer of the conductive polymer was added to evade charging effects at the time of electron beam lithography (EBL). The nanopillar structures were etched with anisotropic inductively coupled plasma-reactive ion etching. The indicated compressor coatings cover an area of 3.1 mm2.
A self-built white-light interferometer was employed to determine the group delay profiles of the developed compressors.
Measurements were carried out on the uncompressed output of a Femtosource Rainbow femtosecond oscillator with the help of a self-built noncollinear SH-FROG. A self-written retrieval algorithm was employed depending on the iterative ptychographic engine to recover the pulse characteristics from the experimental spectrograms.
To enhance the accuracy of the retrieval, the analyzed power spectrum of the fundamental laser pulses was used as an additional constraint. This approach confers reliable spectral information.
Journal Reference:
Ossiander, M., Huang, Y.-W., Chen, W. T., Wang, Z., Yin, X., Ibrahim, Y. A., Schultze, M., Capasso, F. (2021) Slow light nanocoatings for ultrashort pulse compression. Nature Communications, 12(6518). Available online: https://www.nature.com/articles/s41467-021-26920-6.
References and Further Reading
- Zipfel, W. R., et al. (2003) Nonlinear magic: multiphoton microscopy in the biosciences. Nature Biotechnology, 21, pp. 1369–1377. doi.org/10.1038/nbt899.
- Soong, H K & Malta, J B (2009) Femtosecond lasers in ophthalmology. American Journal of Ophthalmology, 147, p. 11. doi.org/10.17925/USOR.2013.06.01.38.
- Gattass, R R & Mazur, E (2008) Femtosecond laser micromachining in transparent materials. Nature Photonics, 2, pp. 219–225. doi.org/10.1038/nphoton.2008.47.
- Zewail, A. H., (2000) Femtochemistry: atomic-scale dynamics of the chemical bond. The Journal of Physical Chemistry A, 104, pp. 5660–5694. doi.org/10.1021/jp001460h.
- Fork, R. L., et al. (1984) Negative dispersion using pairs of prisms. Optics Letters, 9, p. 150. doi.org/10.1364/OL.9.000150.
- Strickland, D & Mourou, G (1985) Compression of amplified chirped optical pulses. Optics Communications, 56, pp. 219–221. doi.org/10.1016/0030-4018(85)90120-8.
- Meshulach, D & Silberberg, Y (1999) Coherent quantum control of multiphoton transitions by shaped ultrashort optical pulses. Physical Review A, 60, pp. 1287–1292. doi.org/10.1038/24329.
- Mayer, E. J., et al. (1997) Ultrabroadband chirped mirrors for femtosecond lasers. Optics Letters, 22, p. 528. doi.org/10.1364/OL.22.000528.
- Kärtner, F. X., et al. (2001) Ultrabroadband double-chirped mirror pairs for generation of octave spectra. Journal of the Optical Society of America B, 18, p. 882. doi.org/10.1364/JOSAB.18.000882.
- Pervak, V., et al. (2009) Double-angle multilayer mirrors with smooth dispersion characteristics. Optics Express, 17, p. 7943. doi.org/10.1364/OE.17.007943.
- Knight, J. C., et al. (2000) Anomalous dispersion in photonic crystal fiber. IEEE Photonics Technology Letters, 12, pp. 807–809. doi.org/10.1109/68.853507.
- Kamali, S. M., et al. (2018) A review of dielectric optical metasurfaces for wavefront control. Nanophotonics, 7, p. 1041–1068. doi.org/10.1515/nanoph-2017-0129.
- Khorasaninejad, M & Capasso, F (2017) Metalenses: versatile multifunctional photonic components. Science, 358, p. eaam8100. doi.org/10.1126/science.aam8100.
- Staude, I & Schilling, J (2017) Metamaterial-inspired silicon nanophotonics. Nature Photonics, 11, pp. 274–284. doi.org/10.1038/nphoton.2017.39.
- Shaltout, A. M., et al. (2019) Spatiotemporal light control with active metasurfaces. Science, 364, p. eaat3100. doi.org/10.1126/science.aat3100.
- Divitt, S., et al. (2019) Ultrafast optical pulse shaping using dielectric metasurfaces. Science, 364, pp. 890–894. doi.org/10.1126/science.aav9632.
- Rahimi, E & Şendur, K (2016) Femtosecond pulse shaping by ultrathin plasmonic metasurfaces. Journal of the Optical Society of America B, 33, p. A1 doi.org/10.1364/JOSAB.33.0000A1.
- Decker, M., et al. (2015) High-efficiency dielectric Huygens’ surfaces. Advanced Optical Materials, 3, pp. 813–820. doi.org/10.1002/adom.201400584.
- Abujetas, D. R., et al. (2017) High-contrast Fano resonances in single semiconductor nanorods. ACS Photonics, 4, pp. 1814–1821. doi.org/10.1021/acsphotonics.7b00395.
- Bogdanov, A. A., et al. (2019) Bound states in the continuum and Fano resonances in the strong mode coupling regime. Advanced Photonics, 1, p. 1. doi.org/10.1117/1.AP.1.1.016001.
- Fountaine, K. T., et al. (2014) Resonant absorption in semiconductor nanowires and nanowire arrays: relating leaky waveguide modes to Bloch photonic crystal modes. Journal of Applied Physics, 116, p. 153106. doi.org/10.1063/1.4898758.
- Ko, Y H & Magnusson, R (2018) Wideband dielectric metamaterial reflectors: Mie scattering or leaky Bloch mode resonance? Optica, 5, p. 289. doi.org/10.1364/OPTICA.5.000289.
- Abujetas, D. R., et al. (2015) Unraveling the Janus role of Mie resonances and leaky/guided modes in semiconductor nanowire absorption for enhanced light harvesting. ACS Photonics, 2, pp. 921–929. doi.org/10.1021/acsphotonics.5b00112.
- Tong, L., et al. (2004) Single-mode guiding properties of subwavelength-diameter silica and silicon wire waveguides. Optics Express, 12, p. 1025. doi.org/10.1364/OPEX.12.001025.
- Huang, X., et al. (2011) Dirac cones induced by accidental degeneracy in photonic crystals and zero-refractive-index materials. Nature Materials, 10, pp. 582–586. doi.org/10.1038/nmat3030.
- Baba, T., et al. (2008) Slow light in photonic crystals. Nature Photonics, 2, pp. 465–473. doi.org/10.1038/nphoton.2008.146.
- Raza, S (2020) Slow light using magnetic and electric Mie resonances. Optics Letters, 45, p. 1260. doi.org/10.1364/OL.386781.
- Liu, V & Fan, S (2012) S4: a free electromagnetic solver for layered periodic structures. Computer Physics Communications, 183, pp. 2233–2244. doi.org/10.1016/j.cpc.2012.04.026
- Pervak, V., et al. (2009) Chirped-pulse amplification of laser pulses with dispersive mirrors. Optics Express, 17, pp. 19204–19212. doi.org/10.1364/OE.17.019204.
- Lalanne, P & Hugonin, J-P (1998) High-order effective-medium theory of subwavelength gratings in classical mounting: application to volume holograms. Journal of the Optical Society of America A, 15, p. 1843. doi.org/10.1364/JOSAA.15.001843.
- Limonov, M F (2017) Fano resonances in photonics. Nature Photonics, 11, p. 12. doi.org/10.1038/nphoton.2017.142.
- Cordaro, A., et al. (2019) Antireflection high-index metasurfaces combining Mie and Fabry-Pérot resonances. ACS Photonics, 6, pp. 453–459. doi.org/10.1021/acsphotonics.8b01406.
- Hlubina, P., et al. (2006) Dispersive white-light spectral interferometry with absolute phase retrieval to measure thin film. Optics Express, 14, p. 7678. doi.org/10.1364/OE.14.007678.
- Malitson, I. H., (1965) Interspecimen comparison of the refractive index of fused silica. Journal of the Optical Society of America, 55, pp. 1205. doi.org/10.1364/JOSA.55.001205.
- DeLong, K. W., et al. (1994) Frequency-resolved optical gating with the use of second-harmonic generation. Journal of the Optical Society of America B, 11, p. 2206. doi.org/10.1364/JOSAB.11.002206.
- DeLong, K. W., et al. (1994) Pulse retrieval in frequency-resolved optical gating based on the method of generalized projections. Optics Letters. 19, p. 2152 doi.org/10.1364/OL.19.002152.
- Sidorenko, P., et al. (2016) Ptychographic reconstruction algorithm for frequency-resolved optical gating: super-resolution and supreme robustness. Optica, 3, p. 1320. doi.org/10.1364/OPTICA.3.001320.
- Wang, Z., et al. (2003) Determining error bars in measurements of ultrashort laser pulses. Journal of the Optical Society of America B, 20, p. 2400. doi.org/10.1364/JOSAB.20.002400.
- Scott, R. P., et al. (2007) High-fidelity line-by-line optical waveform generation and complete characterization using FROG. Optics Express, 15, p. 9977 doi.org/10.1364/OE.15.009977.
- Jafari, R., et al. (2019) 100% reliable algorithm for second-harmonic-generation frequency-resolved optical gating. Optics Express, 27, p. 2112. doi.org/10.1364/OE.27.002112.
- Bristow, A. D., et al. (2007) Two-photon absorption and Kerr coefficients of silicon for 850–2200 nm. Applied Physics Letters, 90, p. 191104. doi.org/10.1063/1.2737359.