Photoluminescence lifetime imaging of upconverting nanoparticles is greatly featured in recent progress in optical thermometry. However, the current optical instruments are void of wide-field photoluminescence lifetime imaging. Looking at Liu, X et al's paper published in Nature Communications, this article describes video-rate upconversion temperature sensing in wide-field utilizing single-shot photoluminescence lifetime imaging thermometry (SPLIT).
Image Credit: GiroScience/Shutterstock.com
The crucial parameter linked to numerous chemical, physical, and biological processes is temperature. For scientific research and industrial applications, accurate and real-time temperature sensing at microscopic scales is significant.
Photoluminescence lifetime imaging (PLI) became a promising approach to temperature sensing in the last few decades as it can be excited and detected optically. The resultant non-contact PLI has a high spatial resolution and advantage that overcomes the intrinsic limitation in spatial resolution of imaging thermography.
PLI also brings greater flexibility in sample selection along with numerous other advantages and thus PLI is a prevalent choice for optical thermometry. PLI’s success in temperature is based on two vital constituents—temperature indicators and optical imaging instruments.
Numerous labeling agents were discovered recently for PLI-based temperature sensing of which lanthanide-doped upconverting nanoparticles (UCNPs) are ideal candidates.
The merits of UCNPs make them frontrunners in temperature indicators for PLI.
PLI-based temperature mapping uses another indispensable constituent called advanced optical imaging. The majority of the PLI techniques employ point-scanning time-correlated single-photon counting (TCSPC) to pinpoint photoluminescence on the time scale of microseconds to milliseconds, similar to the ones produced by UCNPs.
However, the existing PLI techniques are inadequate in 2D temperature sensing of mobile samples having a micrometer-level spatial resolution.
This article intends to address the limitations by reporting an optical temperature mapping modality, called single-shot photoluminescence lifetime imaging thermometry (SPLIT).
SPLIT registers wide-field luminescence decay of Yb3+, Er3+, co-doped NaGdF4 UCNPs in real-time, and allows longitudinal 2D temperature monitoring underneath a thin scattering medium and dynamic temperature analysis of a mobile biological sample at single-cell resolution.
Results
Figure 1 illustrates the SPLIT system. A continuous-wave laser is the light source and the laser beam flows through a 4f system having two 50 mm focal length lenses. The optical chopper is located behind the back focal plane of the lens. This illumination scheme creates wide-field illumination to UCNPs at the object plane.
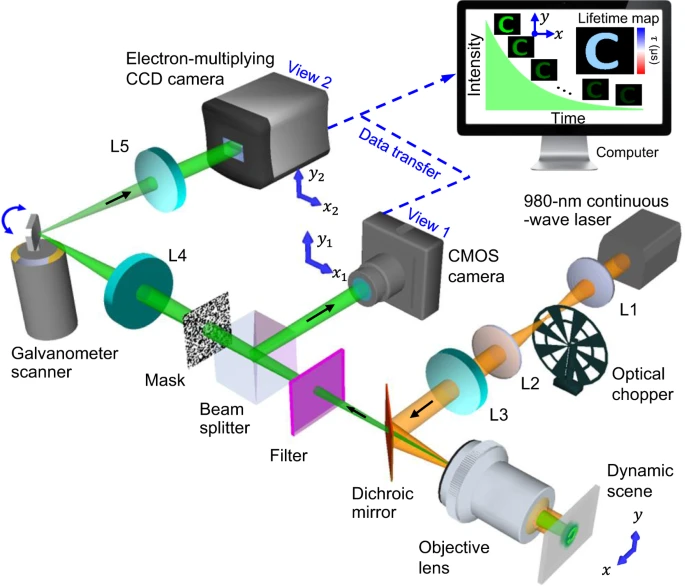
Figure 1. Schematic of the SPLIT system. The illustration shows data acquisition and image reconstruction of luminescence intensity decay in a letter “C”. L1–L5, lens. Image Credit: Liu, et al., 2021.
The UCNPs excited in the near-infrared emits light in the visible spectral range. The emitted light is gathered by the same objective lens, transmitted to a dichroic mirror, and filtered by a band-pass filter. The beam splitter splits the light into two components. The spatially encoded scene is pictured by a mechanical streak camera. The SPLIT system’s hardware is synchronized for apprehending both views that are calibrated before data acquisition.
The retrieved datacube has a sequence depth of 12-100 frames and the reconstructed datacube is later converted to a photoluminescence lifetime map. The SPLIT system, depending on the intrinsic frame rate of the EMCCD camera, produces lifetime-determined temperature maps at a video rate of 20 Hz. To demonstrate SPLIT’s abilities, a series of core/shell UCNP samples were prepared (see Figure 2).
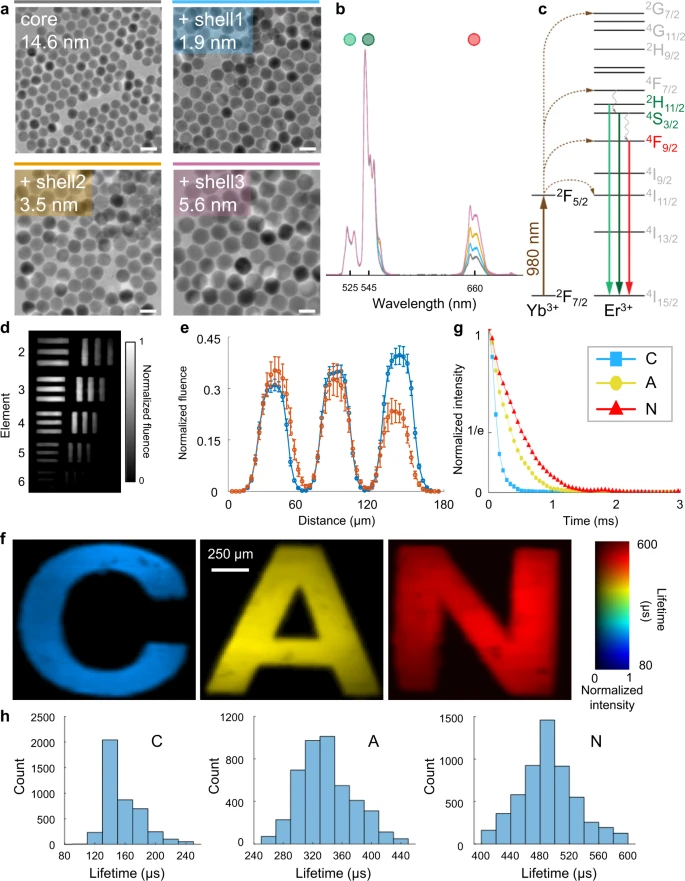
Figure 2. Quantification of the performance of the SPLIT system. (a) Images of core/shell UCNPs acquired with a transmission electron microscope. Scale bar: 25 nm. (b) Normalized upconversion spectra of UCNPs are shown in (a). (c) Simplified energy level diagram of Yb3+-Er3+ energy transfer upconversion excitation and emission. (d) Temporally projected image of photoluminescence intensity decay of the 5.6 nm-thick-shell UCNPs covered by a negative resolution target. (e) Comparison of averaged light fluence distribution along the horizontal bars (blue) and vertical bars (orange) of Element 5 in Group 4 on the resolution target. Error bar: standard deviation. (f) Lifetime images of UCNPs with shell thicknesses of 1.9, 3.5, and 5.6 nm covered by transparencies of letters “C”, “A”, and “N” in green emission. (g) Time-lapse averaged emission intensities of the samples. (h) Histograms of photoluminescence lifetimes in the letters shown in (f). Image Credit: Liu, et al., 2021
SPLIT’s spatial resolution was characterized and found to be 20 µm, and the minimum power density was observed as 0.06 W mm−2. The ability to differentiate various lifetimes was quantified and the results were verified employing a standard TCSPC method. It was noted that the dual-view PnP-ADMM algorithm utilized by SPLIT is more robust in preserving spatial features.
A 5.6-nm-thick-shell UCNPs was used as the temperature indicator for SPLIT and the temperature of the whole sample was evaluated. The reconstructed lifetime images in the temperature range of 20 °C–46 °C are illustrated in Figure 3a–b.
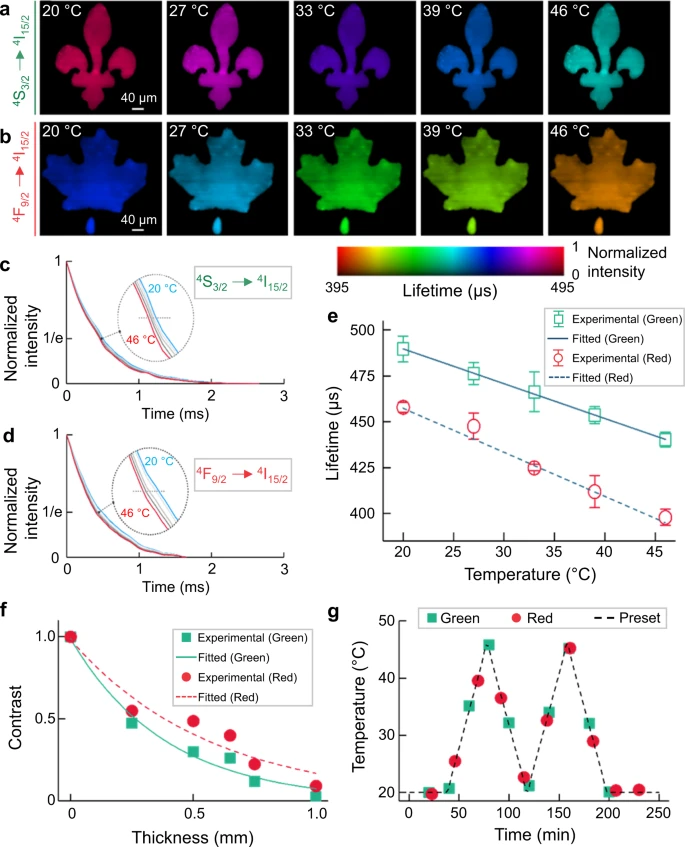
Figure 3. Single-shot temperature mapping using SPLIT. (a, b) Lifetime images of green (a) and red (b) upconversion emission bands under different temperatures. (c, d) Normalized photoluminescence decay curves of green (c) and red (d) emission bands at different temperatures, averaged over the entire field of view. e Relationship between temperature and mean lifetimes of green and red emissions with linear fitting. Error bar: standard deviation from three independent measurements. f Normalized contrast versus chicken tissue thickness for green and red emission bands with single-component exponential fitting. g Longitudinal temperature monitoring through 0.5 mm-thick fresh chicken tissue. Image Credit: Liu, et al., 2021.
SPLIT’s feasibility in a biological environment was analyzed and the results obtained were in agreement. This indicates that SPLIT can map 2D temperatures with great precision beneath biological tissue. When a fresh beef phantom was used, the results affirmed the independence of the measured photoluminescence lifetime of UCNPs.
Dynamic single-cell temperature mapping was examined using a single-layer onion epidermis sample marked by the 5.6 nm-thick-shell UCNPs. It was observed that the temperatures were stable, indicating SPLIT’s resilience to spatial intensity variation. Figure 4 shows SPLITs dynamic single-cell temperature mapping.
![Dynamic single-cell temperature mapping using SPLIT. (a) Representative time-integrated images of a moving onion epidermis cell sample labeled by UCNPs. (b) Lifetime images corresponding to (a). (c) Photoluminescence decay profiles at four selected areas [marked by the solid boxes in the first panel of (a)] with varied intensities. (d) Time histories of averaged fluence and corresponding temperature in the four selected regions during the sample’s translational motion.](https://www.azooptics.com/images/Article_Images/ImageForArticle_2055_1637239054207237.png)
Figure 4. Dynamic single-cell temperature mapping using SPLIT. (a) Representative time-integrated images of a moving onion epidermis cell sample labeled by UCNPs. (b) Lifetime images corresponding to (a). (c) Photoluminescence decay profiles at four selected areas [marked by the solid boxes in the first panel of (a)] with varied intensities. (d) Time histories of averaged fluence and corresponding temperature in the four selected regions during the sample’s translational motion. Image Credit: Liu, et al., 2021.
Discussion
SPLIT was developed for wide-field dynamic temperature sensing in real-time and it registers the photoluminescence emission over a 2D FOV in two views. The enhanced parallelism in SPLIT’s data acquisition enhances the entire light throughput and it addresses the lasting issue in scanning-based techniques.
SPLIT also enhances the measurement accuracy and, when compared with thermal imaging cameras, SPLIT provides better temperature mapping results with greater image contrast and better resilience to background interference.
The PnP-ADMM algorithm facilitates high imaging quality in SPLIT. It also provides a multifaceted PLI temperature-sensing platform. SPLIT can be used in materials characterization, biomedicine, and studies of temperature-regulated cellular signaling.
Methodology
The optical chopper outputs a transistor-transistor logic (TTL) signal synchronal with the created optical pulses. The GS deflects temporal information to various spatial positions and by rotating during the data acquisition. The angular difference is modified to the lateral shift in space on the EMCCD camera resulting in temporal shearing. SPLITs imaging speed ranged from 4-33 kfps.
Journal Reference:
Liu, X., Skripka, A., Lai, Y., Jiang, C., Liu, J., Vetrone, F., Liang, J. (2021) Fast wide-field upconversion luminescence lifetime thermometry enabled by single-shot compressed ultrahigh-speed imaging. Nature Communications, 12(6401). doi.org/10.1038/s41467-021-26701-1.
References and Further Reading
- Inada, N., et al. (2019) Temperature imaging using a cationic linear fluorescent polymeric thermometer and fluorescence lifetime imaging microscopy. Nature Protocols, 14, pp. 1293–1321. doi.org/10.1038/s41596-019-0145-7.
- Wood, M & Ozanyan, K (2015) Simultaneous Temperature, Concentration, and Pressure Imaging of Water Vapor in a Turbine Engine. IEEE Sensors Journal, 15, pp. 545–551. doi.org/10.1109/JSEN.2014.2349796.
- Obermayer, D & Kappe, C (2010) On the importance of simultaneous infrared/fiber-optic temperature monitoring in the microwave-assisted synthesis of ionic liquids. Organic & Biomolecular Chemistry, 8, pp. 114–121. doi.org/10.1039/B918407D.
- Zhang, Z., et al. (2013) Near‐infrared light‐mediated nanoplatforms for cancer thermo‐chemotherapy and optical imaging. Advanced Materials, 25, pp. 3869–3880 doi.org/10.1002/adma.201301890.
- Chen, Z., et al. (2016) Phosphorescent polymeric thermometers for in vitro and in vivo temperature sensing with minimized background interference. Advanced Functional Materials, 26, pp. 4386–4396. doi.org/10.1002/adfm.201600706.
- Jaque, D & Vetrone, F (2012) Luminescence nanothermometry. Nanoscale, 4, pp. 4301–4326. doi.org/10.1039/C2NR30764B.
- Datta, R., et al. (2020) Fluorescence lifetime imaging microscopy: fundamentals and advances in instrumentation, analysis, and applications. Journal of Biomedical Optics. 25, p. 071203.
- Kurokawa, H., et al. (2015) High resolution imaging of intracellular oxygen concentration by phosphorescence lifetime. Scientific Reports, 5, pp. 1–13. doi.org/10.1038/srep10657.
- Childs, P., et al. (2000) Review of temperature measurement. Review of Scientific Instruments, 71, pp. 2959–2978. doi.org/10.1063/1.1305516.
- Gao, L., et al. (2013) Single-cell photoacoustic thermometry. Journal of Biomedical Optics, 18, p. 026003. doi.org/10.1117%2F1.JBO.18.2.026003.
- Snyder, W., et al. (1998) Classification-based emissivity for land surface temperature measurement from space. International Journal of Remote Sensing, 19, pp. 2753–2774. doi.org/10.1080/014311698214497.
- Suhling, K., et al. (2015) Fluorescence lifetime imaging (FLIM): basic concepts and some recent developments. Medical Photonics, 27, pp. 3–40. doi.org/10.1016/j.medpho.2014.12.001.
- Chelushkin, P & Tunik, S (2019) Phosphorescence lifetime imaging (PLIM): state of the art and perspectives. Springer Series in Chemical Physics. doi.org/10.1007/978-3-030-05974-3_6.
- Labrador-Páez, L., et al. (2018) Reliability of rare-earth-doped infrared luminescent nanothermometers. Nanoscale, 10, pp. 22319–22328. doi.org/10.1039/C8NR07566B.
- Pickel, A., et al. (2018) Apparent self-heating of individual upconverting nanoparticle thermometers. Nature Communications, 9, pp. 1–12. doi.org/10.1038/s41467-018-07361-0.
- Shen, Y., et al. (2020) In vivo spectral distortions of infrared luminescent nanothermometers compromise their reliability. ACS Nano, 14, pp. 4122–4133. doi.org/10.1021/acsnano.9b08824.
- Becker, W (2012) Fluorescence lifetime imaging–techniques and applications. Journal of Microscopy, 247, pp. 119–136. doi.org/10.1111/j.1365-2818.2012.03618.x.
- Bolek, P., et al. (2021) Ga-modified YAG: Pr3+ dual-mode tunable luminescence thermometers. Chemical Engineering Journal, 421, p. 129764. doi.org/10.1016/j.cej.2021.129764.
- Gao, H., et al. (2020) A simple yet effective AIE-based fluorescent nano-thermometer for temperature mapping in living cells using fluorescence lifetime imaging microscopy. Nanoscale Horizons, 5, pp. 488–494. doi.org/10.1039/C9NH00693A.
- Maciejewska, K (2021) NIR Luminescence lifetime nanothermometry based on phonon assisted Yb3+-Nd3+ energy transfer. Nanoscale Advances, 3, pp. 4918–4925. doi.org/10.1039/D1NA00285F.
- Zhang, H., et al. (2018) Dual-emissive phosphorescent polymer probe for accurate temperature sensing in living cells and zebrafish using ratiometric and phosphorescence lifetime imaging microscopy. ACS Applied Materials Interfaces, 10, pp. 17542–17550. doi.org/10.1021/acsami.8b01565.
- Tan, M., et al. (2020) Accurate in vivo nanothermometry through NIR‐II lanthanide luminescence lifetime. Small, 16, p. 2004118. doi.org/10.1002/smll.202004118.
- Allison, S. W., et al. (2003) Nanoscale thermometry via the fluorescence of YAG: Ce phosphor particles: measurements from 7 to 77 °C. Nanotechnology, 14, p. 859. doi.org/10.1088/0957-4484/14/8/304.
- Benninger, R., et al. (2006) Quantitative 3D mapping of fluidic temperatures within microchannel networks using fluorescence lifetime imaging. Analytical Chemistry, 78, pp. 2272–2278. doi.org/10.1021/ac051990f.
- Graham, E. M., et al. (2010) Quantitative mapping of aqueous microfluidic temperature with sub-degree resolution using fluorescence lifetime imaging microscopy. Lab on a Chip, 10, pp. 1267–1273. doi.org/10.1039/B924151E.
- Schlegel, G., et al. (2002) Fluorescence decay time of single semiconductor nanocrystals. Physical Review Letters, 88, p. 137401. doi.org/10.1103/physrevlett.88.137401.
- Auzel, F., et al. (2004) Upconversion and anti-stokes processes with f and d ions in solids. Chemical Reviews, 104, pp. 139–174. doi.org/10.1021/cr020357g.
- Skripka, A., et al. (2020) Spectral characterization of LiYbF4 upconverting nanoparticles. Nanoscale, 12, pp. 17545–17554. doi.org/10.1039/D0NR04357E.
- Jacques, S., et al. (2013) Optical properties of biological tissues: a review. Physics in Medicine & Biology, 58, p. R37. doi.org/10.1088/0031-9155/58/11/R37.
- Vetrone, F., et al. (2010) Temperature sensing using fluorescent nanothermometers. ACS Nano, 4, pp. 3254–3258. doi.org/10.1021/nn100244a.
- Brites, D. S. C., et al. (2012) Thermometry at the nanoscale. Nanoscale, 4, pp. 4799–4829. doi.org/10.1039/9781782622031.
- Rostami, I., et al. (2019) Breakthroughs in medicine and bioimaging with up-conversion nanoparticles. International Journal of Nanomedicine, 14, p. 7759 doi.org/10.2147%2FIJN.S221433.
- Zhou, J., et al. (2020) Advances and challenges for fluorescence nanothermometry. Nature Methods, 17, pp. 967–980. doi.org/10.1038/s41592-020-0957-y.
- Qin, H., et al. (2018) Tuning the upconversion photoluminescence lifetimes of NaYF4: Yb3+, Er3+ through lanthanide Gd3+ doping. Scientific Reports, 8, p. 12683. doi.org/10.1038/s41598-018-30983-9.
- Howard, S., et al. (2013) Frequency-multiplexed in vivo multiphoton phosphorescence lifetime microscopy. Nature Photonics, 7, pp. 33–37. doi.org/10.2147%2FIJN.S221433.
- Suhling, K., et al. (2016) Wide-field TCSPC-based fluorescence lifetime imaging (FLIM) microscopy. Proceedings of SPIE, 9858, p. 98580J. doi.org/10.1117/12.2227198.
- Hirvonen, L., et al. (2017) Photon counting phosphorescence lifetime imaging with TimepixCam. Review of Scientific Instruments, 88, p. 013104. doi.org/10.1063/1.4973717.
- Sen, R., et al. (2020) New luminescence lifetime macro-imager based on a Tpx3Cam optical camera. Biomedical Optics Express, 11, pp. 77–88. doi.org/10.1364/BOE.11.000077.
- Franke, R & Holst, G (2015) Frequency-domain fluorescence lifetime imaging system (pco. flim) based on a in-pixel dual tap control CMOS image sensor. Proceedings of SPIE, 9328, p. 93281K. doi.org/10.1117/12.2087589.
- Xiong, B & Fang, Q (2020) Luminescence lifetime imaging using a cellphone camera with an electronic rolling shutter. Optics Letters, 45, pp. 81–84. doi.org/10.1364/OL.45.000081.
- Liang, J., et al. (2020) Punching holes in light: recent progress in single-shot coded-aperture optical imaging. Reports on Progress in Physics, 83, p. 116101. doi.org/10.1088/1361-6633/abaf43.
- Liang, J., et al. (2017) Single-shot real-time video recording of a photonic Mach cone induced by a scattered light pulse. Science Advances, p. e1601814. doi.org/10.1126/sciadv.1601814.
- Liu, Y., et al. (2018) Rank minimization for snapshot compressive imaging. IEEE Transactions on Pattern Analysis and Machine Intelligence, 41, pp. 2990–3006.
- Yuan, X., et al. (2020) Plug-and-play algorithms for large-scale snapshot compressive imaging. In: Proceedings of the IEEE/CVF Conference on Computer Vision and Pattern Recognition (CVPR), pp. 1447–1457.
- Chan, S., et al. (2016) Plug-and-play ADMM for image restoration: Fixed-point convergence and applications. IEEE Transactions on Computational Imaging, 3, pp. 84–98.
- Yuan, X., et al. (2015) Compressive hyperspectral imaging with side information. IEEE Journal of Selected Topics in Signal Processing, 9, pp. 964–976. doi.org/10.1109/JSTSP.2015.2411575.
- Liang, J., et al. (2018) Single-shot real-time femtosecond imaging of temporal focusing. Light: Science & Applications, 7, p. 42. doi.org/10.1038/s41377-018-0044-7.
- Wang, P., et al. (2020) Single-shot ultrafast imaging attaining 70 trillion frames per second. Nature Communications, 11, p. 2091. doi.org/10.1038/s41467-020-15745-4.
- Liang, J., et al. (2020) Single-shot stereo-polarimetric compressed ultrafast photography for light-speed observation of high-dimensional optical transients with picosecond resolution. Nature Communications, 11, p. 5252. doi.org/10.1038/s41467-020-15745-4.
- May, P & Berry, M (2019) Tutorial on the acquisition, analysis, and interpretation of upconversion luminescence data. Methods and Applications in Fluorescence, 7, p. 023001. doi.org/10.1038/s41467-021-26701-1.
- Zhang, H., et al. (2018) Dual-emissive phosphorescent polymer probe for accurate temperature sensing in living cells and zebrafish using ratiometric and phosphorescence lifetime imaging microscopy. ACS Applied Materials Interfaces, 10, pp. 17542–17550. doi.org/10.1021/acsami.8b01565.
- Dos Santos, P., et al. (1998) Optical temperature sensing using upconversion fluorescence emission in Er3+/Yb3+-codoped chalcogenide glass. Applied Physics Letters, 73, pp. 578–580. doi.org/10.1063/1.121861.
- Miller, M & Wright, J (1979) Multiphonon and energy transfer relaxation in charge compensated crystals. The Journal of Chemical Physics, 71, pp. 324–338 doi.org/10.1063/1.438074.
- Liu, X., et al. (2019) Single-shot real-time sub-nanosecond electron imaging aided by compressed sensing: analytical modeling and simulation. Micron, 117, pp. 47–54 doi.org/10.1016/j.micron.2018.11.003.
- Wang, R., et al. (2019) Thermomechanical fatigue experiment and failure analysis on a nickel-based superalloy turbine blade. Engineering Failure Analysis, 102, pp. 35–45 doi.org/10.1016/j.engfailanal.2019.04.023.
- Jung, H., et al. (2018) Organic molecule-based photothermal agents: an expanding photothermal therapy universe. Chemical Society Reviews, 47, pp. 2280–2297. doi.org/10.1039/C7CS00522A.
- Shen, Y., et al. (2020) Ag2S nanoheaters with multiparameter sensing for reliable thermal feedback during in vivo tumor therapy. Advanced Functional Materials. doi.org/10.1002/adfm.202002730.
- Wang, C., et al. (2011) Determining intracellular temperature at single-cell level by a novel thermocouple method. Cell Research, pp. 21, pp. 1517–1519. doi.org/10.1038/cr.2011.117.
- Liu, X., et al. (2019) Single-shot compressed optical-streaking ultra-high-speed photography, 44, pp. 1387–1390. doi.org/10.1364/OL.44.001387