The application of light-based technologies in the clinic has been increasing over the past decades. Biophotonics tools have been accounting for a larger proportion of next-generation diagnostic and therapeutic modalities, provided that they offer information of tissue functionality and composition with minimal invasiveness. This article looks at Pacheco, A et al.'s paper published in Journal of Biomedical Optics.
One of the major challenges in advancing biophotonics-based medical devices is transforming signals into useful information that can assist clinicians in the treatment and diagnosis of diseases. This study offers an understanding of a potential application of existing light-based technology for localized air volume assessment in lung tissue.
The respiratory system includes conducting and respiratory airways (see Figure 1). The conducting airways lack alveoli and take no part in gas exchange. Their main function is to conduct, clean, heat up, and humidify the air to 37 °C and 100% relative humidity (RH) as it reaches the alveolar sacks.
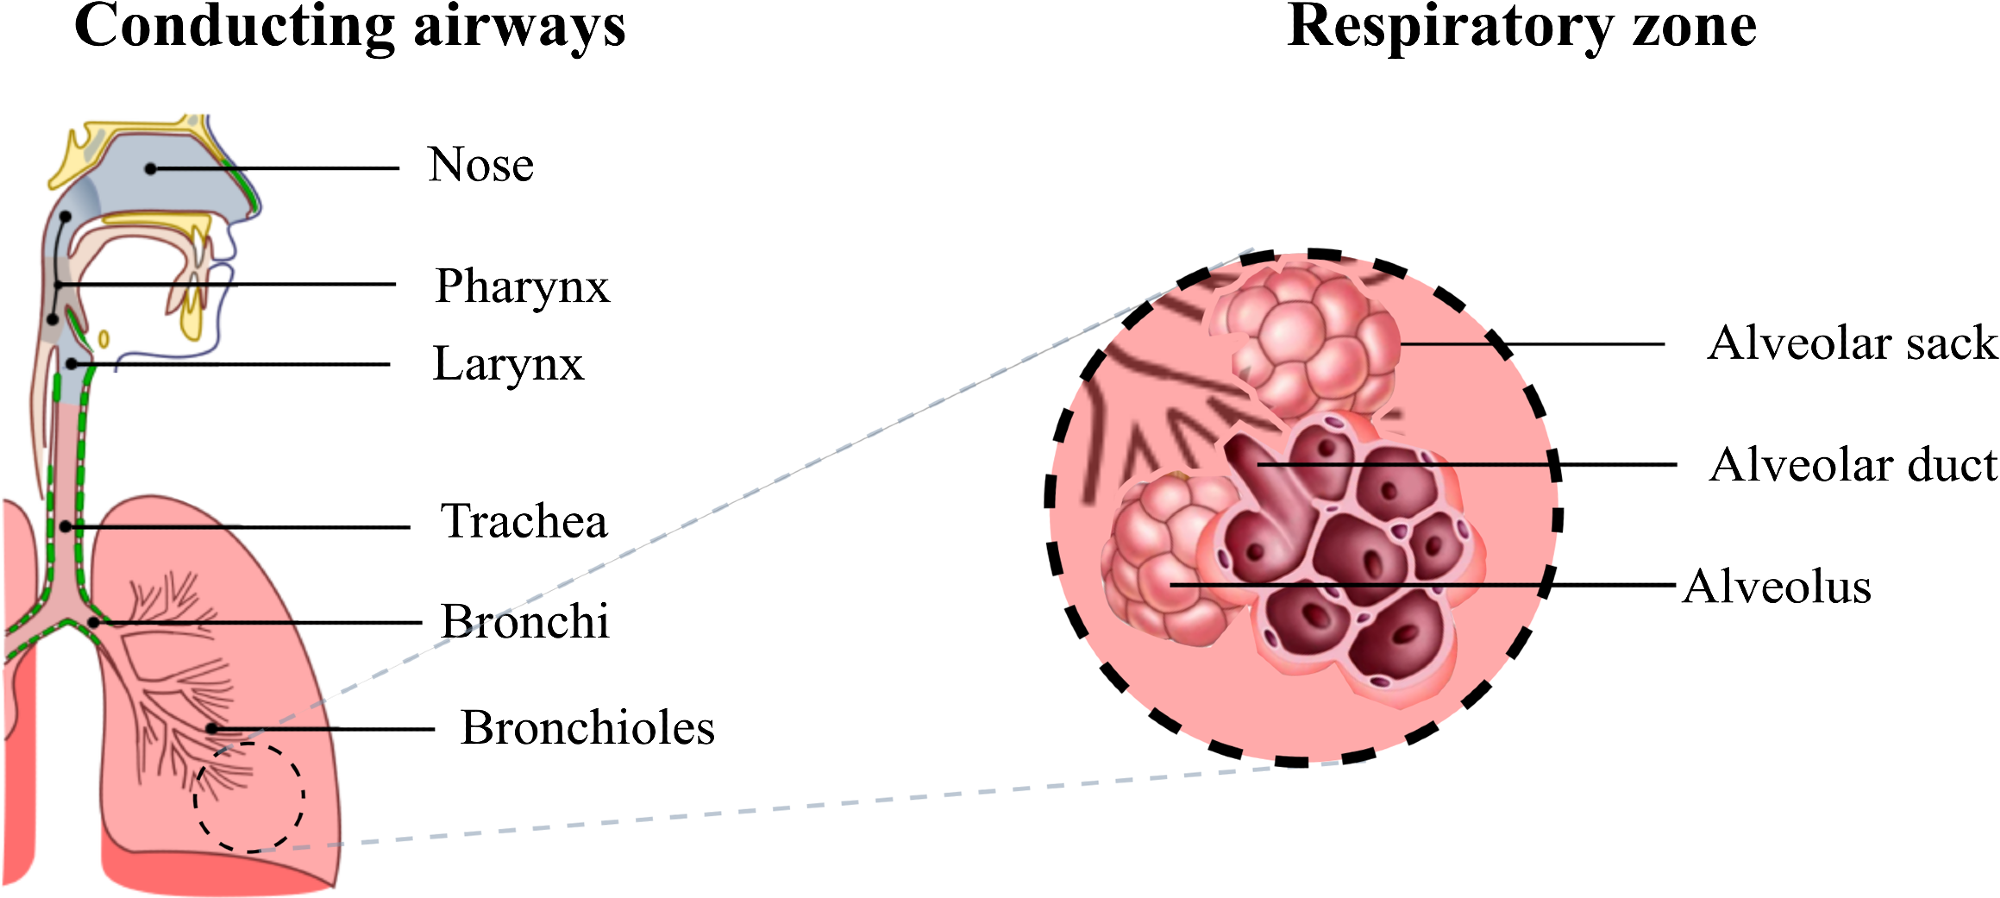
Figure 1. Diagram of the respiratory airways. The conducting airways warm up and moisten the inhaled air, the gas exchange occurs in the respiratory zone where the alveoli are located. Image Credit: Pacheco, et al., 2021
The pulmonary gas volume constantly changes during respiration. To evaluate and diagnose restrictive and obstructive pathologies, the measurement of respiratory volumes is of clinical significance.
Gas in scattering media absorption spectroscopy (GASMAS) is a gas spectroscopy technique that involves using tunable diode laser spectroscopy to quantify the concentration of gases enclosed in a non-invasive way by diffuse media. The clinical applications of GASMAS include the following: monitoring of oxygen (O2) and water vapor (H2O) in the lungs of neonates, assessing infection in paranasal sinuses, early diagnosis of osteonecrosis, and diagnosis of otitis.
This study proves the viability of measuring changes in gas volume using the GASMAS technology.
Methodology
The phantoms developed previously to study the clinical application of GASMAS in neonatal respiratory healthcare had a hollow cavity with the outer geometry of the lung without the inner structure that resembles the alveolar anatomy. The phantom developed as part of this study recreated inflated alveoli surrounded by lung tissue.
The lung tissue’s optical properties at 760 nm were assigned by filling liquid phantom in the capillaries. The capillary tubes used to simulate lung absorption and scattering were filled through capillary action.
In certain cases, air bubbles inhibited the rising of the liquid in the tube, which was prevented by gently tapping on the outer side of the tube. Then, the top end of the tubes was sealed using starch-based modeling clay to avoid leakage while performing measurements.
Subsequently, the capillaries filled with air and the liquid phantom were randomly placed into the holder by hand to assemble the capillary arrays for absorption measurements. The probed air volume was altered by changing the ratio of capillaries filled with air in the array.
Figure 2 illustrates the diagram of all the components that were part of the lung model.
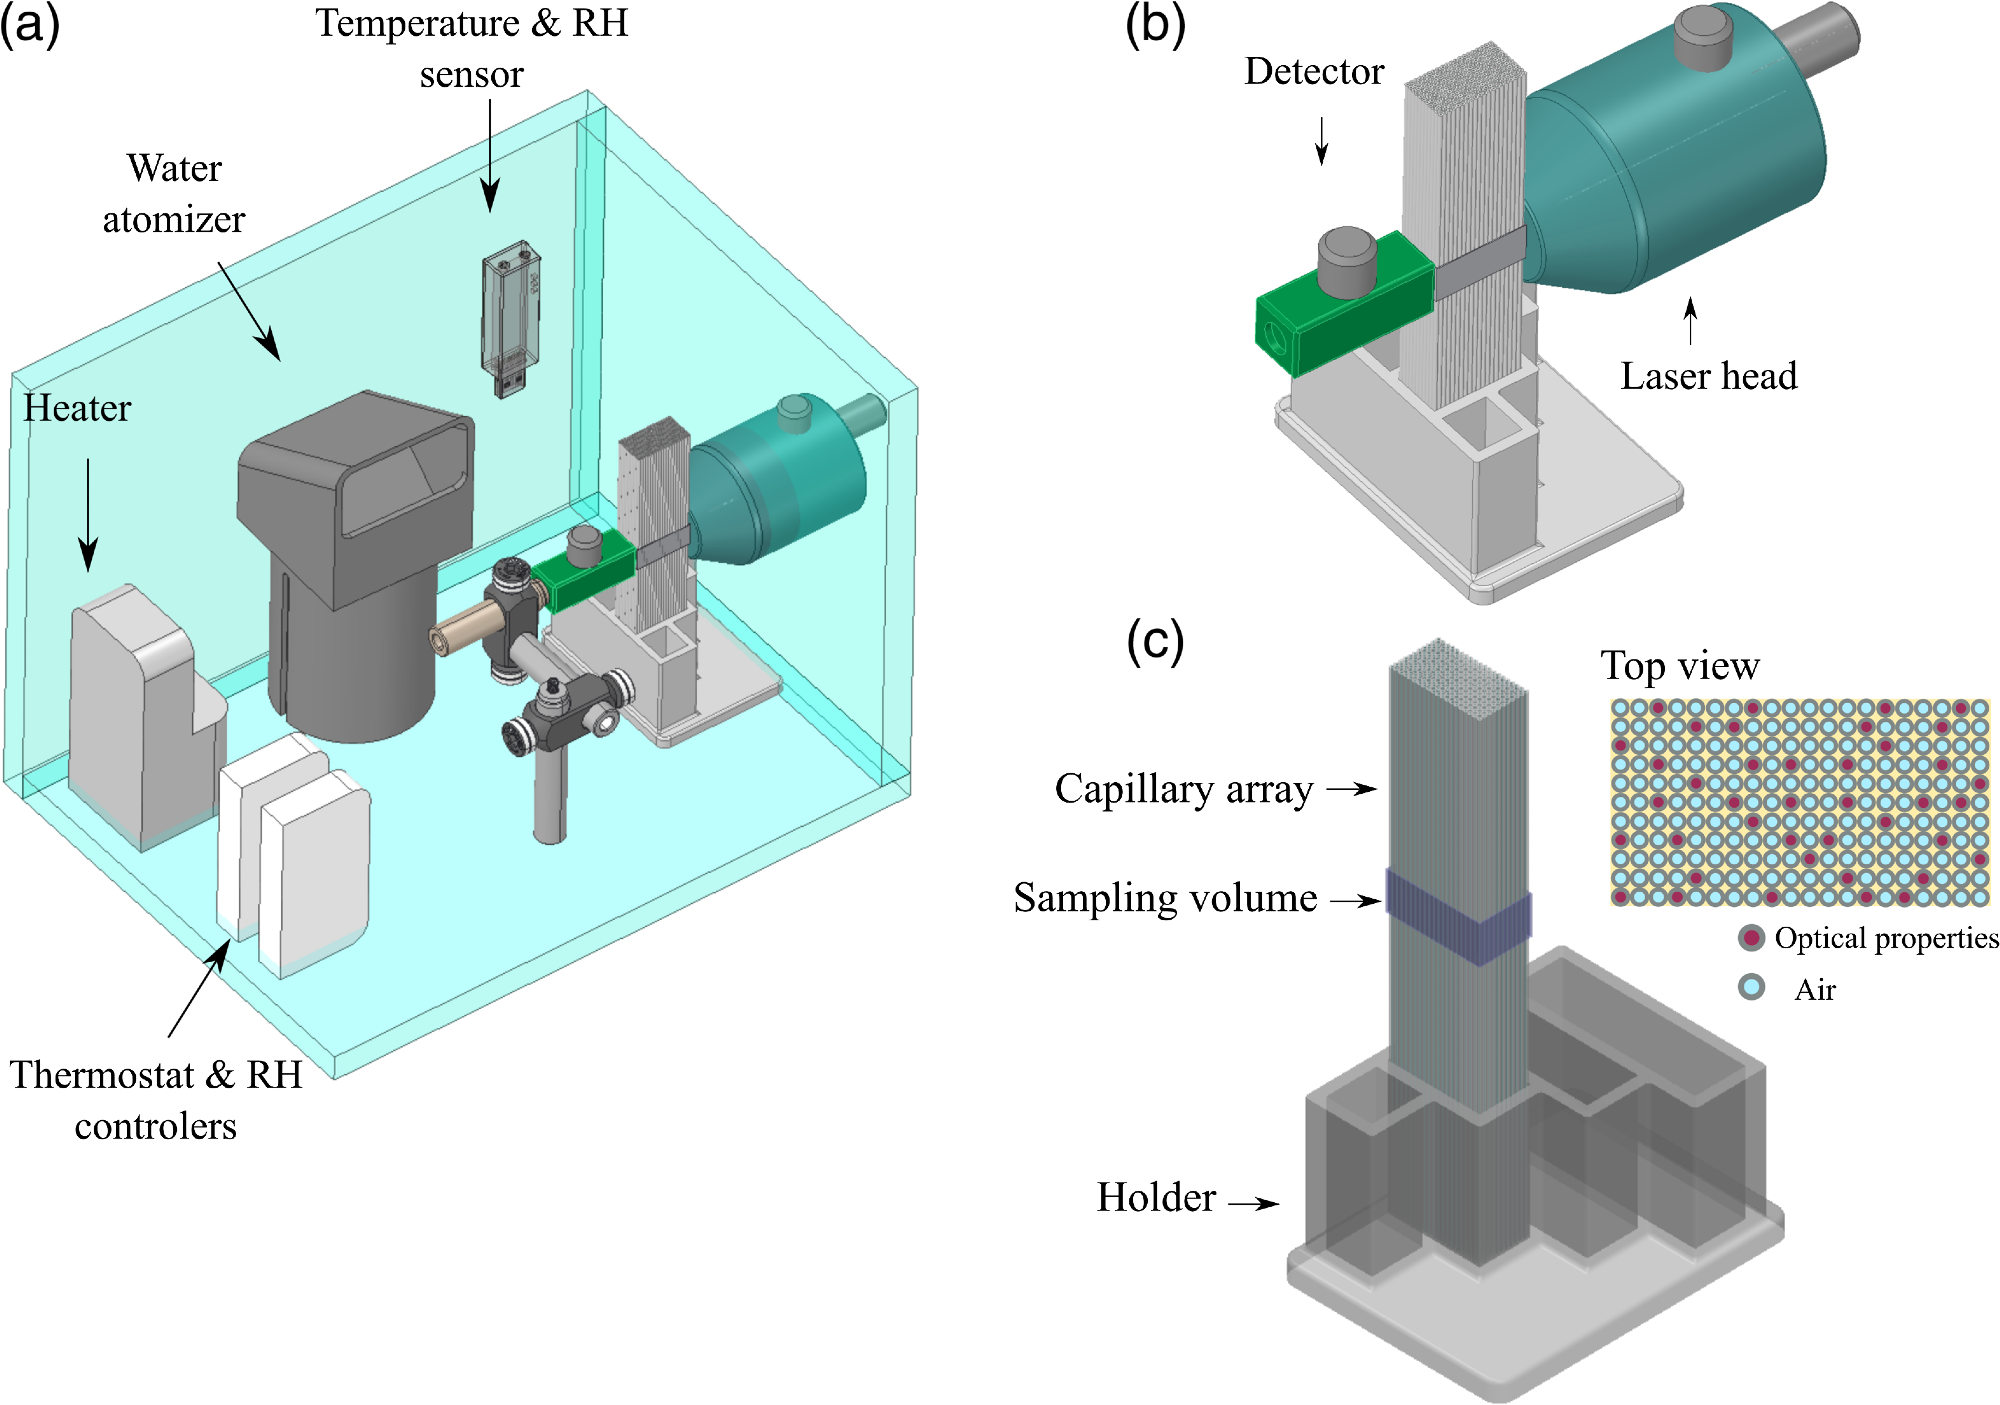
Figure 2. (a) Diagram of the experimental setup designed to study the variations in GASMAS signal for different gas volumes in the lung tissue phantom. (b) Zoom in of source and detector placement in transmittance geometry. (c) The capillary array placed in the 3D printed holder, the sampling volume was defined by the size of light source and detector and the length of the capillary array. Image Credit: Pacheco, et al., 2021
The capillary array was positioned between the detector and source in transmission geometry. A black film was used to mask the long walls of the capillary array, and the contact surfaces between the system source and detector and the capillaries were daubed using ultrasound gel. This was done to inhibit light absorption by the gas outside the capillary tubes.
One wall of the capillary array was irradiated with the help of 760-nm and 820-nm lasers. Each laser scanned across the absorption lines of H2O (820 nm) and O2 (760 nm). The detector positioned on the opposite side of the capillary array collected the scattered light. Wave modulation spectroscopy (WMS) was used to increase the detection sensitivity of O2 and H2O.
At the same time, the wavelength of the lasers was scanned across the gas absorption line, thus producing high harmonics of the absorption signal and inhibiting the background noise. The typical output of this instrument was the amplitude signal acquired by WMS, which was employed to detect the proportional drop in light intensity for each wavelength.
The air volume between the capillaries was calculated by subtracting the total volume of 229 capillaries from a cube with the dimensions of the analyzed volume.
The radius of the capillaries employed in this study agreed well with the physiological radius of an alveolar unit. Regardless of the cylindrical geometry, the air volumes were comparable with the volume of the pulmonary tissue, and the lung model enabled recreating progressive volume changes during respiration in a pulmonary section.
In Test set 1, all the capillaries were empty to start with, and the absorption signal was measured 10 times. The air content between the detector and the source was decreased by replacing (and allocating randomly by hand) 20 empty capillaries with liquid phantom-filled capillaries, and the respective data acquisition followed.
This was repeated 10 times until 200 capillaries were filled with lung tissue phantom and the remaining 29 were filled with air, as illustrated in Table 1. The inverse process was performed in Test set 2.
Table 1. Air volumes in the capillary lung model conformed by 229 capillaries in total and constant air space of 6.89 × 10⁻⁷ m3. Source: Pacheco, et al., 2021
| Test set 1: Air volume progressively reduced |
Test set 2: Air volume progressively increased |
Capillaries filled with
lung liquid phantom |
Volume of air
tested (×10−6 m3) |
Capillaries filled
with air |
Volume of air
tested (×10−6 m3) |
| 0 |
1.14 |
0 |
0.69 |
| 20 |
1.10 |
20 |
0.73 |
| 40 |
1.06 |
40 |
0.77 |
| 60 |
1.02 |
60 |
0.81 |
| 80 |
0.99 |
80 |
0.85 |
| 100 |
0.94 |
100 |
0.89 |
| 120 |
0.90 |
120 |
0.93 |
| 140 |
0.86 |
140 |
0.97 |
| 160 |
0.83 |
160 |
1.00 |
| 180 |
0.77 |
180 |
1.04 |
| 200 |
0.75 |
200 |
1.08 |
Results and Discussion
In GASMAS measurements, the path length corresponds to the effective path traveled by light inside the gas cavities, where the absorption outshines scattering. The surrounding bulk material (the liquid phantom here) reduces the amount of light reaching the detector.
Due to the augmentation of capillaries filled with liquid phantom within the measurement sets, there was an increase in the light diffusion inside the phantom and the number of gas cavities reduced simultaneously.
In highly diffuse materials, such as biological tissue, the absorption path length is not known. The gas concentration of H2O in this study was known, which allowed the gas absorption path length to be retrieved. This path length was assumed to be the same for molecular O2. The absorption signals obtained for Test set 1 are illustrated in Figure 3(a), where the dashed line denotes the capillary array in which 100 units were filled with optical phantom and 129 with air.
The observed level of absorption mimicked a condition in which the air volume was larger compared to the maximum capacity of the sampling volume. Therefore, the measurements from that configuration were left out from data analysis, as illustrated in Figure 3(b). Figure 3(c) shows a plot of the absorption signals from the second test set.
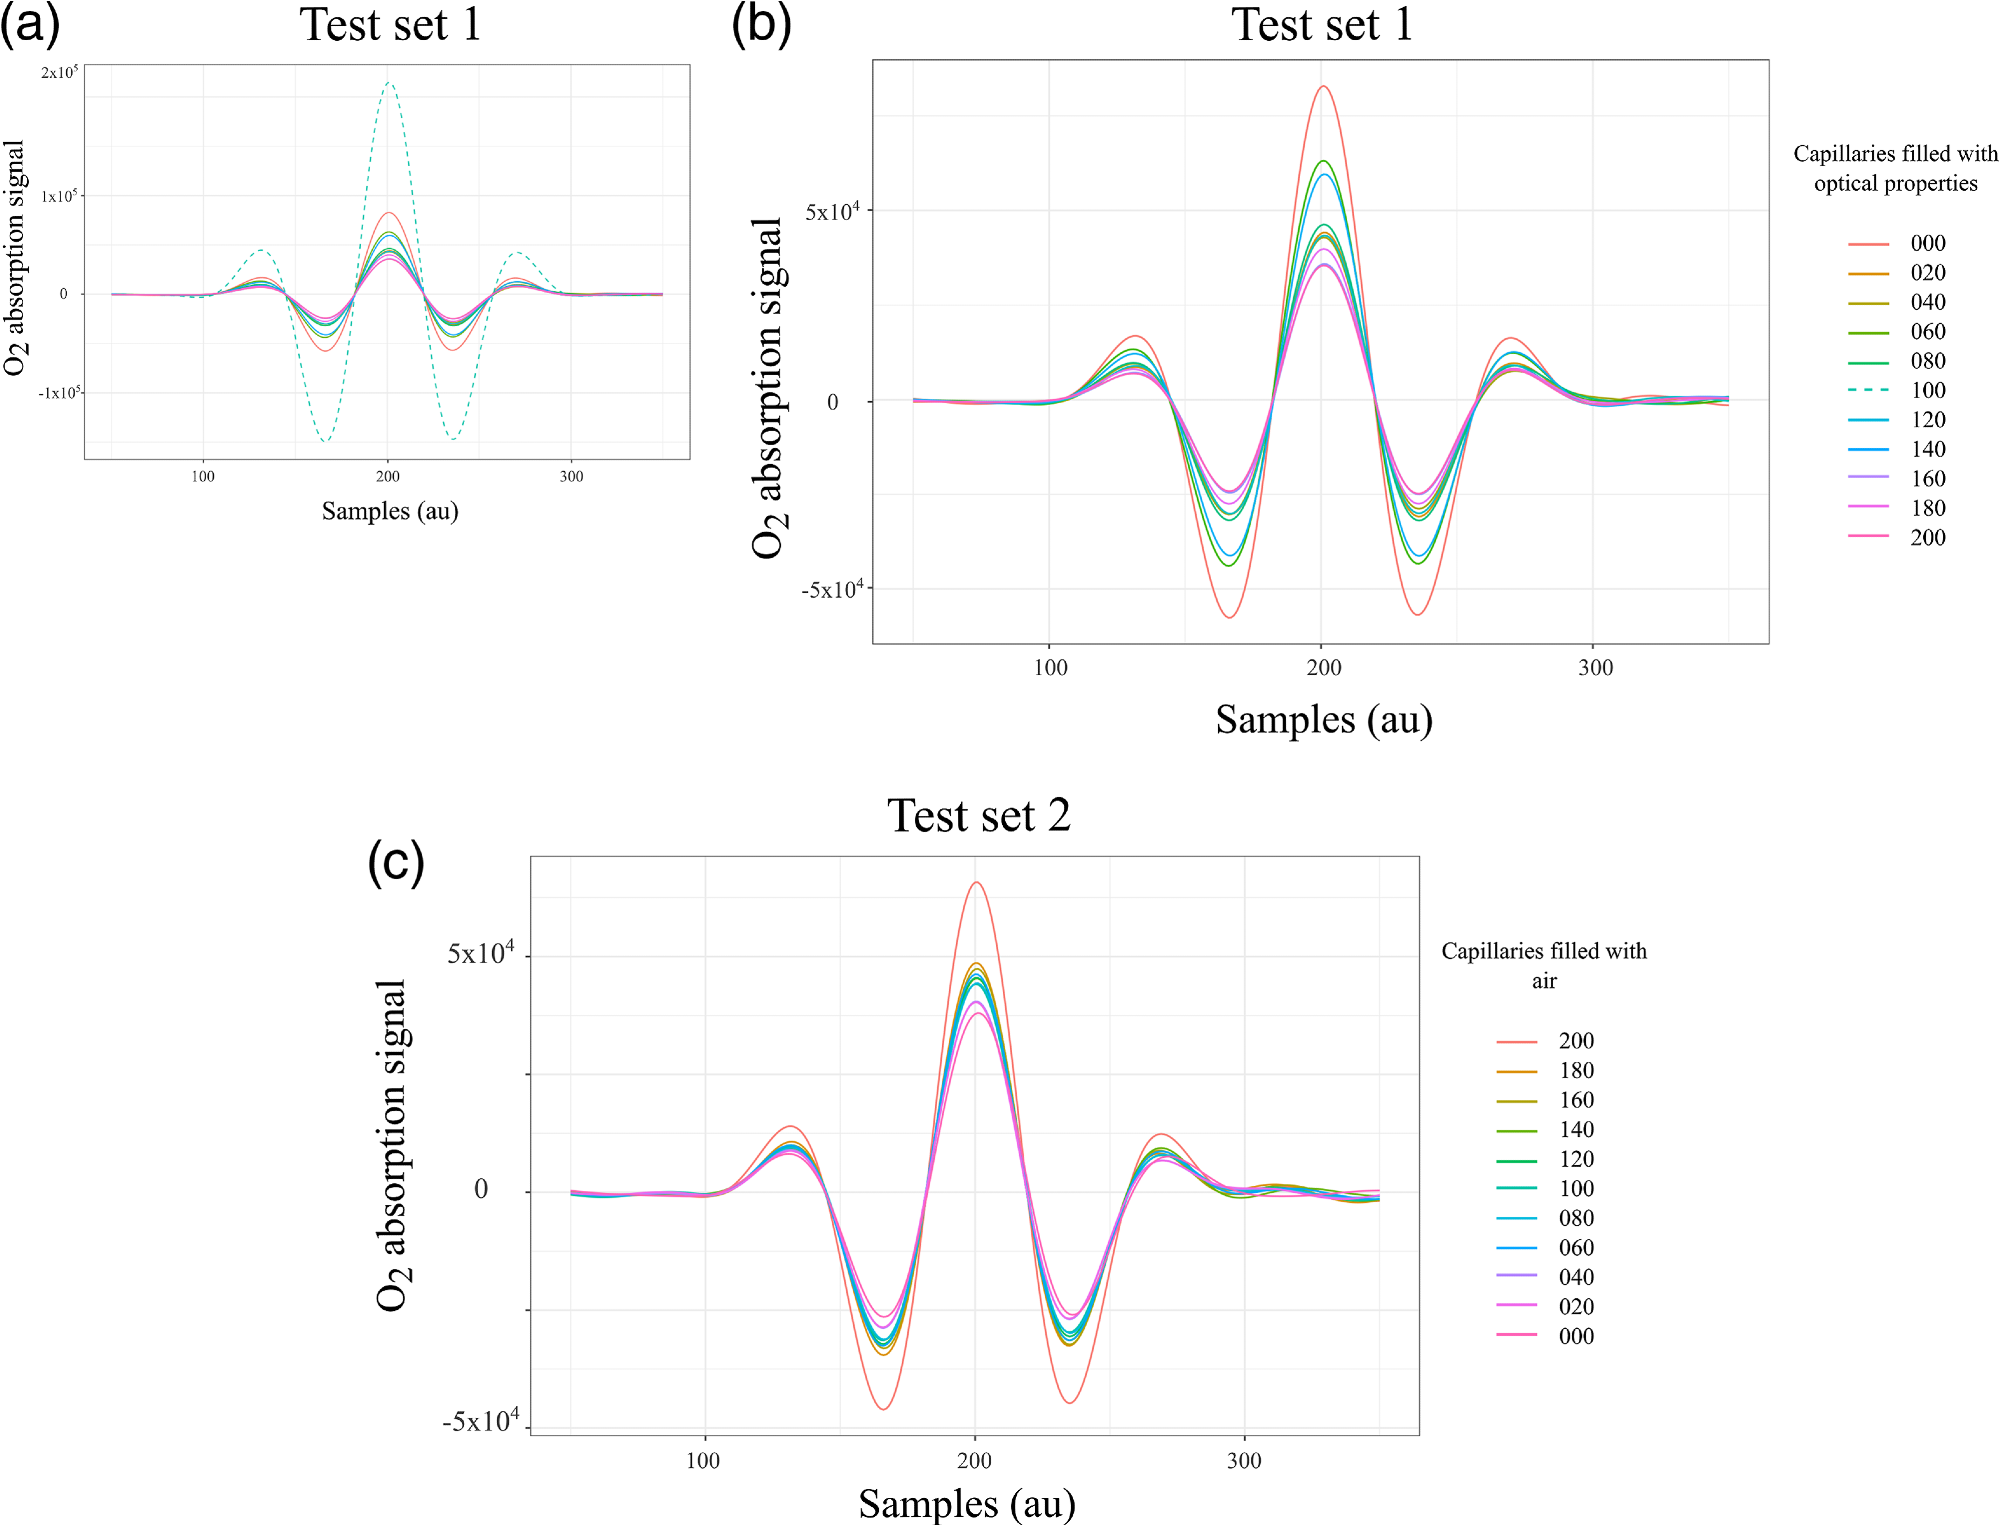
Figure 3. WMS amplitude signals that correspond to the absorption of molecular oxygen tested in the lung model in transmittance geometry. (a) Complete test set 1, the acquisition started with all capillaries filled with air followed by a progressive reduction of air volume. The dashed line exhibits higher absorption compared with the absorption of the maximum sampling volume, therefore these data were removed in (b) for the analysis. (c) Signals from test set 2, the acquisition started with all capillaries filled with optical properties followed by a progressive increase of air volume. Image Credit: Pacheco, et al., 2021
Figure 4(a) shows the peak values of the absorption signals for both test sets plotted as a function of the number of optical phantom-filled capillaries. Figure 4(b) illustrates a plot of the light transmission for the configurations, including a number of liquid phantom-filled capillaries.
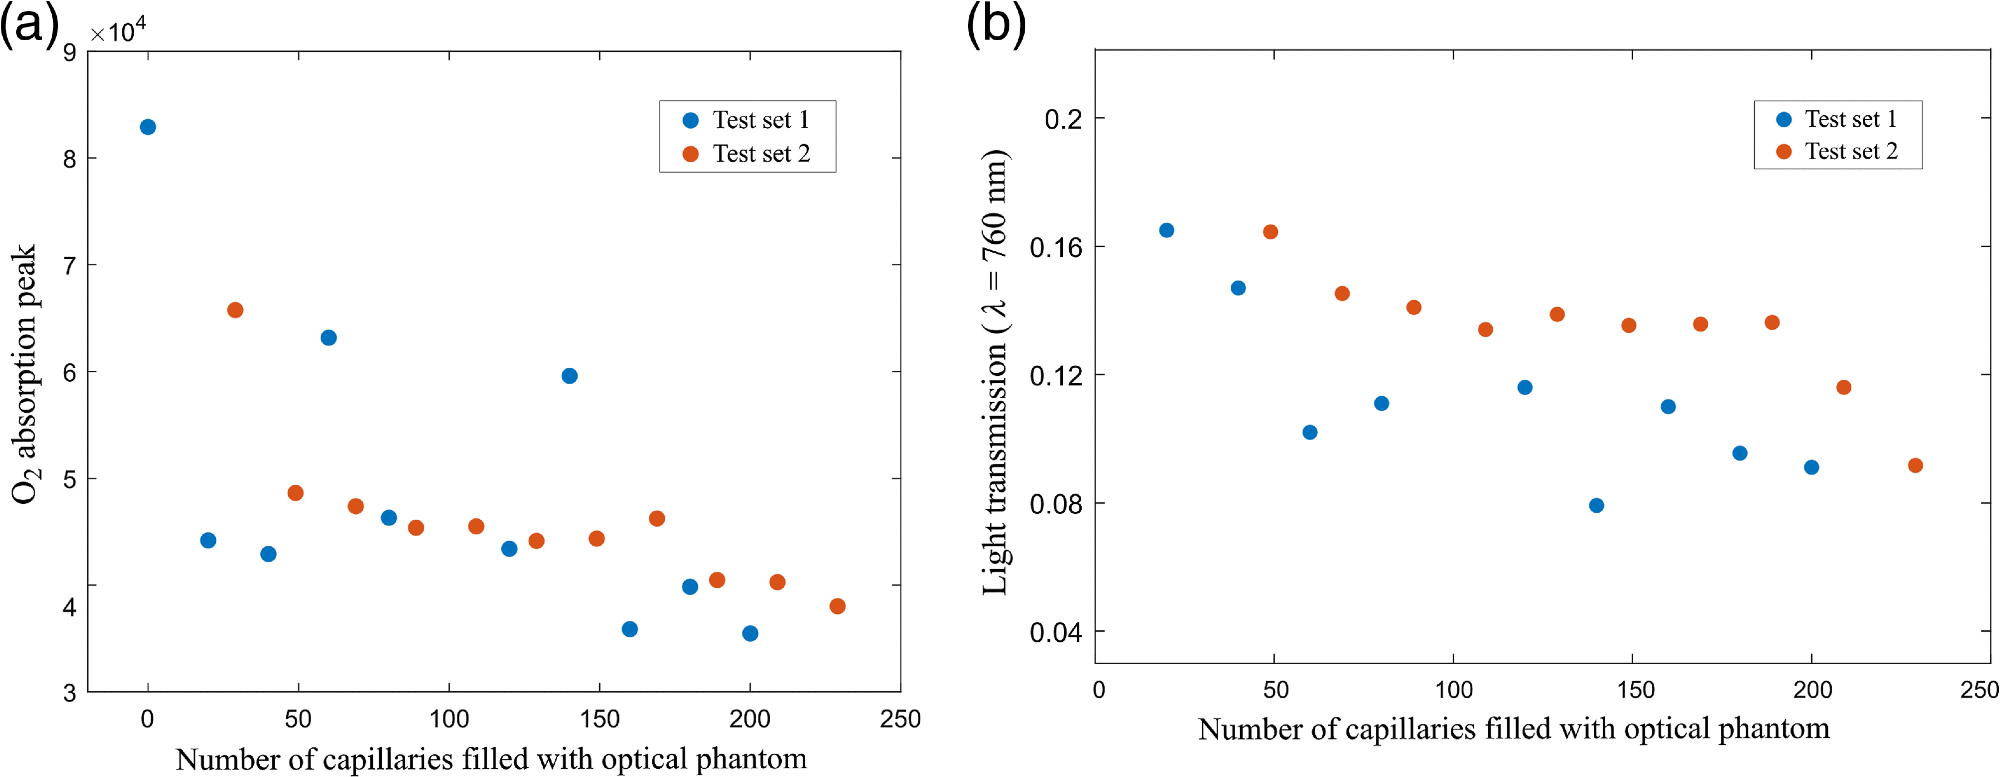
Figure 4. (a) Peak values of the WMS absorption signals of molecular oxygen as a function of the number of capillaries filled with liquid phantom; and (b) light transmission values for the capillary arrays with optical phantom. Image Credit: Pacheco, et al., 2021
Conclusion
This study modeled a phantom with the structure of tissue and the optical properties from the respiratory zone with the help of a simplified capillary array immerse in a controlled environment chamber, where temperature and RH were maintained in the range of the human body.
The viability of sensing changes in volume with GASMAS technique has been proven, pointing toward a new potential application of GASMAS technology in respiratory treatment and diagnostics. This is a major contribution because earlier studies on the clinical translation of GASMAS into respiratory healthcare discussed about sensing the absorption imprint of O2 and H2O to measure gas concentrations.
Journal Reference:
Pacheco, A., Grygoryev, K., Messina, W., Andersson-Engels, S. (2021) Lung tissue phantom mimicking pulmonary optical properties, relative humidity, and temperature: a tool to analyze the changes in oxygen gas absorption for different inflated volumes. Journal of Biomedical Optics, 27(7), p. 074707. Available at: https://doi.org/10.1117/1.JBO.27.7.074707.
References and Further Reading
- Marcu, L., et al., (2017). Biophotonics: the big picture. Journal of Biomedical Optics, 23(2), p. 021103. doi.org/10.1117/1.JBO.23.2.021103.
- Dery, R (1971) Humidity in anaesthesiology IV: determination of the alveolar humidity and temperature in the dog. Canadian Anaesthetists’ Society Journal, 18(2), pp. 145–151. doi.org/10.1007/BF03025443.
- Schwartzstein, R M & Parker, M J (2006) Respiratory Physiology: A Clinical Approach. Lippincott Williams & Wilkins: Philadelphia.
- Lutfi, M F (2017) The physiological basis and clinical significance of lung volume measurements. Multidisciplinary Respiratory Medicine, 12(1), p. 3. doi.org/10.1186/s40248-017-0084-5.
- Svanberg, S (2013) Gas in scattering media absorption spectroscopy: from basic studies to biomedical applications. Laser & Photonics Review, 7(5), pp. 779–796. doi.org/10.1002/lpor.201200073.
- Lewander, M., et al. (2009) Clinical system for non-invasive in situ monitoring of gases in the human paranasal sinuses. Optics Express, 17(13), pp. 10849–10863. doi.org/10.1364/OE.17.010849.
- Hu, L., et al. (2019) Towards an optical diagnostic system for otitis media using a combination of otoscopy and spectroscopy. Journal of Biophotonics, 12(6), p. e201800305. doi.org/10.1002/jbio.201800305.
- Chen, D., et al. (2019) Laser-based gas absorption spectroscopy in decaying hip bone: water vapor as a predictor of osteonecrosis. Journal of Biomedical Optics, 24(6), p. 065001. doi.org/10.1117/1.JBO.24.6.065001.
- Lewander, M., et al. (2011) Non-intrusive gas monitoring in neonatal lungs using diode laser spectroscopy: feasibility study. Journal of Biomedical Optics, 16(12), p. 127002. doi.org/10.1117/1.3663211.
- Lundin, P., et al. (2012) Non-invasive gas monitoring in newborn infants using diode laser absorption spectroscopy: a case study. Proceedings of the SPIE, 8229, p. 822903. doi.org/10.1117/12.907464 PSISDG 0277-786X.
- Lundin, P., et al. (2013) Noninvasive monitoring of gas in the lungs and intestines of newborn infants using diode lasers: feasibility study. Journal of Biomedical Optics, 18(12), p. 127005. doi.org/10.1117/1.JBO.18.12.127005 JBOPFO 1083-3668.
- Svanberg, E. K., et al. (2016) Diode laser spectroscopy for noninvasive monitoring of oxygen in the lungs of newborn infants. Pediatric Research, 79(4), pp. 621–628. doi.org/10.1038/pr.2015.267 PEREBL 0031-3998.
- Henderson, T A & Morries, L (2015) Near-infrared photonic energy penetration: can infrared phototherapy effectively reach the human brain? Neuropsychiatric Disease and Treatment, 2191(2015). doi.org/10.2147/NDT.S78182.
- Terboven, T., et al. (2019) Chest wall thickness and depth to vital structures in paediatric patients: implications for prehospital needle decompression of tension pneumothorax. Scandinavian Journal of Trauma, Resuscitation and Emergency Medicine, 27(1), 45. doi.org/10.1186/s13049-019-0623-5.
- Gordon, E., et al. (2017) The HITRAN2016 molecular spectroscopic database. Journal of Quantitative Spectroscopy and Radiative Transfer, 203, 3–69. doi.org/10.1016/j.jqsrt.2017.06.038.
- Jacques, S L (2013) Optical properties of biological tissues: a review. Physics in Medicine & Biology, 58(11), pp. R37–R61. doi.org/10.1088/0031-9155/58/11/R37.
- Mei, L., et al. (2014) Pathlength determination for gas in scattering media absorption spectroscopy. Sensors, 14(3), pp. 3871–3890. doi.org/10.3390/s140303871.
- Buck, A. L., et al. (1981) New equations for computing vapor pressure and enhancement factor. Journal of Applied Meteorology and Climatology, 20, pp. 1527–1532. doi.org/10.1175/1520-0450(1981)020<1527:NEFCVP>2.0.CO;2.
- Mallet, A., et al. (2021) Relating near-infrared light path-length modifications to the water content of scattering media in near-infrared spectroscopy: toward a new Bouguer–Beer–Lambert law. Analytical Chemistry, 93(17), pp. 6817–6823. doi.org/10.1021/acs.analchem.1c00811.
- Ranu, H., et al. (2011) Pulmonary function tests. Ulster Medical Journal, 80(2), pp. 84–90.
- Larsson, J., et al. (2018) Development of a 3-dimensional tissue lung phantom of a preterm infant for optical measurements of oxygen-laser-detector position considerations. Journal of Biophotonics, 11(3), p. e201700097. doi.org/10.1002/jbio.201700097.
- Pacheco, A., et al. (2020) Anthropomorphic optical phantom of the neonatal thorax: a key tool for pulmonary studies in preterm infants. Journal of Biomedical Optics, 25(11), p. 115001. doi.org/10.1117/1.JBO.25.11.115001 JBOPFO 1083-3668.
- Aernouts, B., et al., Dependent scattering in Intralipid® phantoms in the 600–1850 nm range. Optics Express, 22(5), p. 6086. doi.org/10.1364/OE.22.006086.
- Gunther, J., et al. (2020) Combination of diffuse reflectance and transmittance spectroscopy to obtain optical properties of liquid phantoms. Optical Engineering, 59(2), p. 024109. doi.org/10.1117/1.OE.59.2.024109.
- Gora, M. J., et al. (2017) Endoscopic optical coherence tomography: technologies and clinical applications [Invited]. Biomedical Optics Express, 8(5), p. 2405. doi.org/10.1364/BOE.8.002405 BOEICL 2156-7085.