An OD specification is a measure of the amount of light being blocked at a specified wavelength.
It is the log of the transmittance, or:
OD = 2−log (%T)
OD values are additive (see Figure 1). Employing a dichroic filter with an OD of 2.5 blocking at 405 nm along with an emission filter with an OD of 5 to 6 blocking at 405 nm will work together to provide an OD value of 8 blocking at 405 nm as demonstrated in Figure 1 below.
It should be explained that OD values around 6 or higher are very challenging to quantify on the average spectrometer. The authentic blocking can be much greater than the values measured, as outlined in the right panel below.
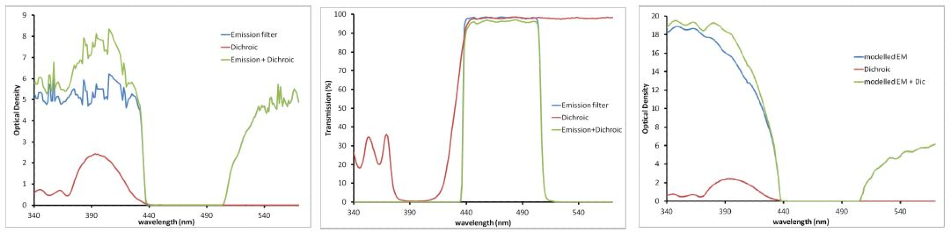
Figure 1. Emission and Dichroic filters displayed in Transmission (left) and OD (right two panels). These measurements are related by a log transformation. As %T values get very low, OD values get high. OD is an additive property (green curve on the right). The right panel shows the modeled performance of the emission filter, illustrating the much higher OD that is likely present, especially at lower wavelengths.
In this article, an example of how to establish the level of blocking required in a standard flow cytometer system will be outlined.
Flow cytometers are configured for the identification of particles and cells in the range of 1 to 15 µm. They normally employ fluorescence and laser light scatter to achieve this. In a single file, the samples travel through the detection system, as detailed in Figure 2.
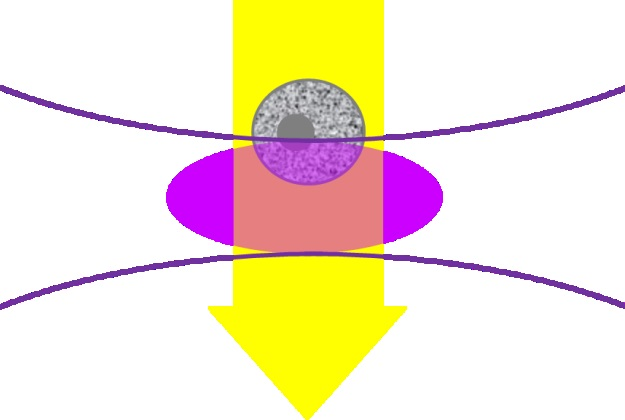
Figure 2. Illustration of the focused laser beam (lavender oval) interacting with the sample in the flow cytometer. The grey cell is moving down through the laser focus.
The 405 nm laser is a frequently used flow cytometry laser. With a linear flow rate of 1 m/s (often observed in systems for cell counting), any point in the particle or cell will come into contact with the illuminated volume (the lavender section shown above) for around 10 ms.
Utilizing 100 mW of power it is simple to determine how many photons in a sample are interacting with a fluorophore by following the equation below.
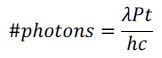
Where time (t) is in seconds, power (P) is in Watts, and wavelength (λ) is in meters. The speed of light (c) is 3x10⁸ m/s, and Planck’s constant (h) is 6.626x10⁻³⁴ Js.
For this article, it is presumed that all the photons are in contact with the fluorophore over the entire course of the investigation. A more detailed approach would be to incorporate the photon density in the remit of the sample’s focal volume.
During the 10 µs transit time, there are ~2*1011 photons in the beam focus. Some fragments of light will travel through the sample, some will be absorbed, some will be inelastically scattered (Raman scattering), and some will be elastically scattered (Mie and Rayleigh scattering away from organelles).
The absorbed light can be misplaced due to heat or photochemistry or can manifest as fluorescence, which is normally identified at a right angle to both the direction of the sample particles’ journey and the laser beam. In this example, it can be in or out of the plane of the paper.
The most challenging scenario would be attempting to identify a single photon of fluorescence while aiming to block the laser beam at the same time.
In this example, 2*1011 photons would need to be blocked at 405 nm while detecting the fluorescence signal simultaneously. The initial assumption would be that the emission filter requires OD 11 blocking.
This assumption is not necessarily the case. As outlined earlier, the OD values are additive, so there will be sufficient blocking if the blocking values of the emission and dichroic filters combine to make an OD value of 11, but there are other factors to consider.
The amount of scattered light is normally smaller in comparison to that of a raw laser beam, so in practice, less blocking can be utilized. For example, if 1% of the light is scattered, the blocking requirement is OD9 for the identification of one fluorescence photon in the presence of this scattered signal.
It is most likely not practical to outline the detection of a single photon in most cases. A single fluorophore can absorb light (or be excited) 1,000 times in the transit time of 10 µs when using a standard fluorescence lifetime of 10 ns for a fluorescent probe.
The quantum yield (Φ) of the fluorophore outlines the number of absorbed photons that can be re-emitted as fluorescence photons and are identifiable by the system. It varies from more than 0.9 for FITC (one of the highest) to 0.2 for tryptophan.
One fluorophore employing a middle value of 0.5 will emit 500 photons, meaning that the blocking requirement is OD7. The chance is that every protein, particle, or cell will have some fluorophores attached, so the amount of emitted photons will be even greater, further decreasing the blocking requirement.
If other light in the system is not managed well, the blocking OD should be increased. For example, if the enclosure is not light-tight, the optical system will have reflections present that are not controlled. Anti-reflection coatings can assist with this, along with absorbing materials and baffles.
OD is often over-specified, resulting in more cost and complexity in coatings. The signal is optimized, and filter cost is reduced if time is taken to account for all the photons within a system.
*A more thorough approach would include the photon density within the focal volume of the sample.

This information has been sourced, reviewed and adapted from materials provided by Omega Optical, Inc.
For more information on this source, please visit Omega Optical, Inc.