cryoRaman delivers Raman spectroscopic imaging with unmatched spatial resolution at very low temperatures. It was developed for researchers studying materials whose novel properties often first emerge when cooled to near absolute zero.
Users can easily access and perform investigations down to 1.8 Kelvin in strong magnetic fields while benefitting from the full performance and versatility of the WITec alpha300 Raman microscope series.
Equipped with state-of-the-art cryostat and nanopositioner technologies, a broad range of accessories can also be integrated to optimize the instrument for each researcher's unique experimental challenges.
Key Features
- 1.8 Kelvin to 300 Kelvin operating temperatures
- Low-vibration closed-cycle cryostats
- Solenoid magnets with a strength of up to 12 Tesla or vector magnets
- Excitation wavelengths from VIS to NIR with optimized spectrometers
- Full polarization control in excitation and detection
- Unique cryogenic-compatible Raman-specific objectives
- Exceptionally precise low-temperature nanopositioner
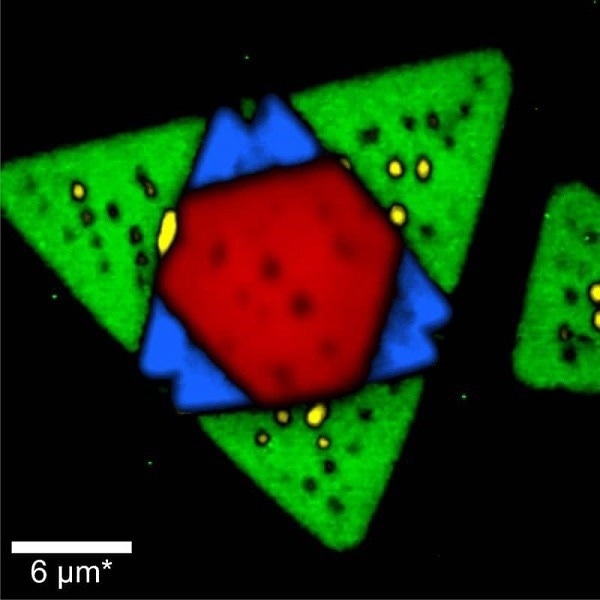
Raman image of tungsten diselenide (WSe2) recorded at 120 K. Areas with one (green), two (blue), and three (red) layers were clearly identified from their Raman spectra. Image Credit: WITec GmbH
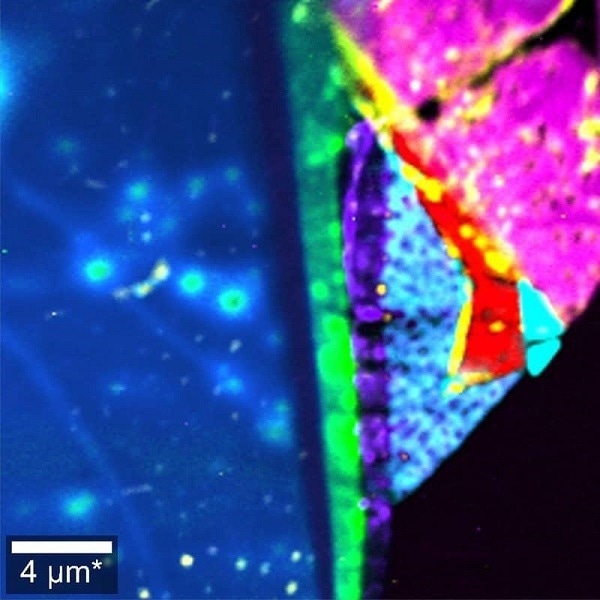
Raman image of a MoS2/WSe2 heterostructure recorded at 2 K. The colors represent different layer numbers, compositions, and orientations. Image Credit: WITec GmbH
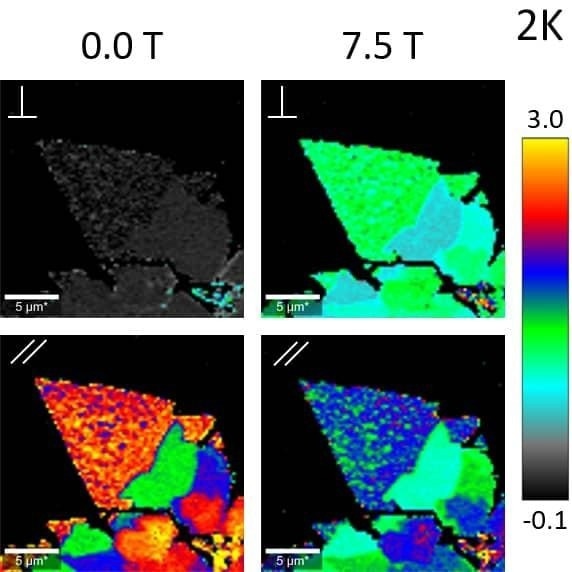
Polarization- and magnetic field-dependent Raman images of single- and multi-layer MoS2 at 2 K.
The A’1 /E’ intensity ratio is color coded. The polarizer and analyzer were oriented perpendicular or parallel to each other as indicated. Image Credit: WITec GmbH
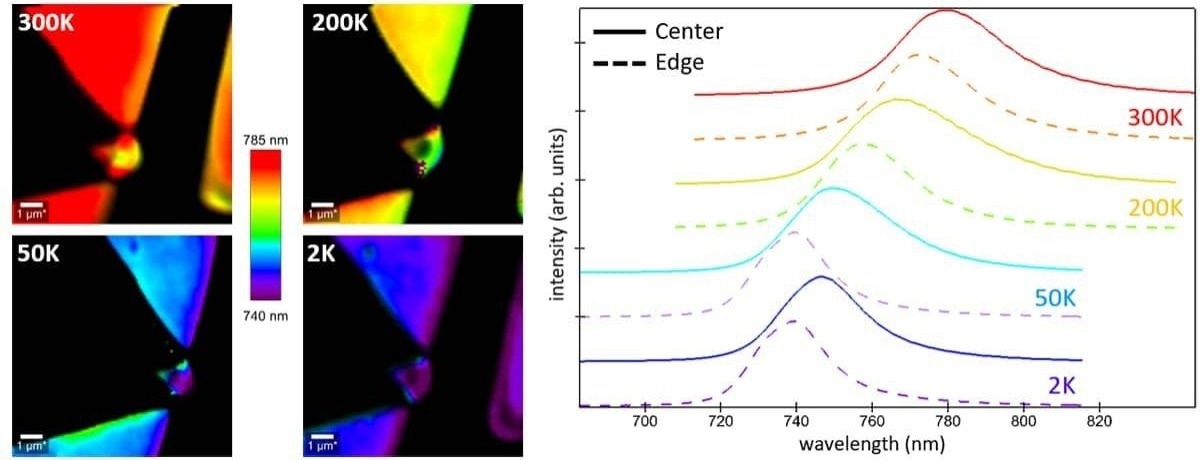
Temperature-dependent shift of photoluminescence (PL) spectra for WSe2. The PL images at different temperatures (300 K, 200 K, 50 K, and 2 K) are color coded according to the PL peak position. The normalized PL spectra for each temperature are color-coded accordingly, with solid and dashed lines representing spectra from the center and the outer edges of the single layer, respectively.
Image Credit: WITec GmbH