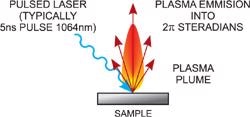
A short laser pulse is focused on to the surface of a sample to create the plasma. A laser with a good Gaussian profile allows focusing to a near diffraction-limited spot. The tighter the focus, the less laser energy is required to produce the laser-induced breakdown. Typically energies of only tens of millijoules are required.
The plasma is emitted into >2Π steradians, so a fast f/1 lens will collect more light. Sometimes a blocking filter is used to remove any scatter from the incident laser - however, since the incident laser light and the signal are well resolved temporally, a filter is rarely required. An Intensified CCD (ICCD) detector attached to a spectrograph analyzes the collected plasma light.
LIBS Plasma plume
For LIBS, Mechelle spectrographs are typically used.For analysis of a wide range of samples, a system based on an echelle spectrograph offers a combination of high resolution and wide wavelength coverage.It is also possible to relay the laser light to the sample and collect the signal by fiber optics.
The gating requirements of LIBS are not very demanding. Gate times and delays of several microseconds are typical, so a slow gate ICCD is suitable. The system can usually be operated in internal trigger mode, with the controller board triggering the laser and the delay generator. The intensity of the plasma emission is usually high enough to allow good spectra to be recorded in single scan mode.A typical experimental configuration is shown below.
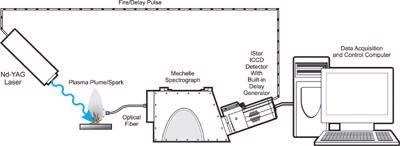
Typical LIBS Configuration
LIBS Techniques
LIBS spectroscopy can be produced from a variety of lasers but typically excimers or pulsed Nd:Yag lasers are used.The high intensity laser pulse interacting with the sample produces a plasma plume that evolves with time from the point of impact of the incident laser pulse. The laser pulse usually lasts for 5 to 20ns. The emission from the plasma plume is collected and analyzed by the detection system.
Typically the emission is collected at some distance from the sample to reduce the significance of self-absorption effects or surface effects. The plasma created breaks down all the sample's chemical bonds and ionizes many of the constituent elements. The spectral emission occurs as a result of the subsequent relaxation of the constituent excited species.
The spectrum that is observed in the first 100ns is dominated by continuous, intense, white-light radiation; consequently no discrete lines can be observed. The plasma plume expands with time and the excited species relax further. After around 1µs from the incident laser pulse, discrete spectral lines originating from various ionic species start to become visible.
The spectra below indicate how the spectral lines evolve over time. The exact timing and the spectral lines vary with the type of sample, the distance from the center of the plasma and the wavelength of the incident laser light, but typically the evolution of the plasma and the changes in its content occur on a microsecond timescale.
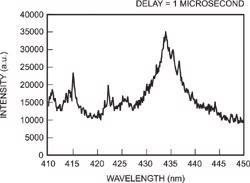
A typical spectrum seen from a solution of potassium pertechnetate dissolved in 0.1 mol l-1nitric acid
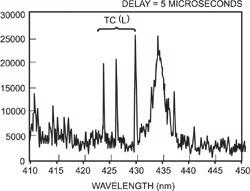
At 5µs atomic emission lines start to become visible through the broadened ionic lines
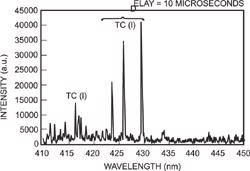
At 10µs the atomic spectral lines dominate and clear identification of the atomic species is possible
Applications of LIBS
LIBS is a useful method for determining the elemental composition of various solids, liquids and gases. In the LIBS technique, a high power laser pulse is focused on to a sample to create a plasma or laser spark. Emission from the atoms and ions in the plasma is collected by a lens or fiber optics and analyzed by a spectrograph and gated detector.
The atomic spectral lines can be used to determine the elemental composition or the elemental concentrations in the sample. The analysis is similar to that performed by an ICP (Inductively Coupled Plasma) analyzer. The great appeal of LIBS is that little or no sample preparation is required to obtain useful results and the technique is readily portable to the field.
Advantages of LIBS
The advantages of LIBS include:
- Versatile sampling of solids, gases or liquids.
- Little or no sample preparation is necessary. The result is increased throughput, greater convenience and fewer opportunities for contamination to occur.
- LIBS typically samples very small amounts of material (~0.1µg to 1mg) and is therefore practically non-destructive.
- Permits analysis of extremely hard materials that are difficult to digest or dissolve, e.g. ceramics and superconductors.
- Local analysis in microregions offers a spatial resolving power of ~1-100µm.
- Possibility of simultaneous multi-elemental analysis.
- Potential for direct detection in aerosols (a solid or liquid particle in a gaseous medium).
- Simple and rapid analysis (ablation and excitation processes are carried out in a single step).
Disadvantages of LIBS
The disadvantages of LIBS include:
- Increased cost and system complexity.
- Difficulty in obtaining suitable standards (semi-quantitative).
- Large interference effects (including matrix interference and, in the case of LIBS in aerosols, the potential interference of particle size).
- Detection limits are generally not as good as established solution techniques.
- Poor precision - typically 5-10%, depending on the sample homogeneity, sample matrix, and excitation properties of the laser.
- Possibility of ocular damage by the high-energy laser pulses.
Andor Solutions for LIBS - Andor Recommended LIBS Cameras
The Andor range of iStar cameras are ideally suited for LIBS, with features like fast or slow gating, wide spectral range, minimum insertion delay and compact detector head.
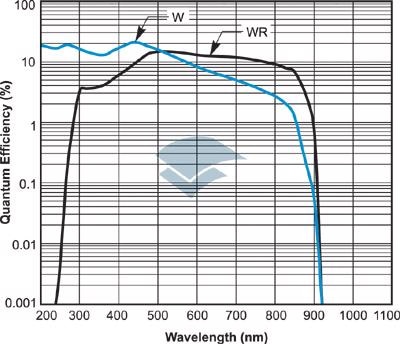
QE curves relevant to LIBS
Andor advantages such as compact detector head, lowest propagation delay, internal delay generator and 25ps step resolution making the iStar the ideal choice for LIBS.
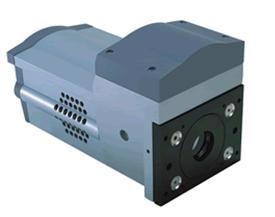
iStar from Andor
iStar ICCD Camera - Leading Intensified CCD Camera
Fast Gated ICCDs
Andor has been in the business of developing world-class, rapid gated Intensified CCD (ICCD) cameras for over 16 years. The standard of fast, ns time-resolved imaging and spectroscopy is redefined by the advent of Andor’s iStar ICCD camera series.
The iStar ICCD camera series benefits from sCMOS and CCD sensor and gated image intensifier technologies, thereby delivering ultra-high sensitivity down to a single photon and fast acquisitions rates. Outstanding detection performances are possible due to thermoelectric cooling down to -40°C, high quantum-efficiency image intensifiers, better intensifier EBI noise reduction, and 500kHz photocathode gating rates.
The iStar ICCD camera series enables ultra-accurate synchronization of complicated experiments by achieving unprecedented timing accuracy down to few tens of picoseconds, thanks to nanosecond-scale optical gating, low insertion delay gating electronics, and low jitter. Extensive range of triggering options and input/output interface is also available.

This information has been sourced, reviewed and adapted from materials provided by Andor Technology Ltd.
For more information on this source, please visit Andor Technology Ltd.