Spectrometers are optical instruments designed to split light into separate wavelengths or colors. White light is fed into a spectrometer, separated into red, green, yellow, and blue light as it exits the spectrometer.
A range of optical components is utilized inside the spectrometer to separate the wavelengths. Component selection is primarily dependent on required resolving power (R1), and while a glass prism is occasionally utilized in low-resolution (R<1000) instruments, diffraction grating remains the most common optical component in modern spectrometers.2
Diffraction gratings can be used in either transmission or reflection, and these tend to offer resolving powers in the range of 1,000 to 100,000. Using diffraction gratings at higher resolutions, however, entails the use of progressively larger gratings. Optics that feature large diameters and long focal lengths (large f- numbers3) are required to minimize aberrations when illuminating large diffraction gratings.
Imaging considerations mean that a large entrance focal length in combination with a narrow slit is also necessary if high resolution is to be achieved. Because of this, diffraction grating instruments with R>50,000 tend to be expensive (>$50,000) as well as large (>1 meter in length).
High-resolution spectrometers benefit from the use of Fabry-Perot (F-P) etalons, offering users a compact, cost-effective means of separating closely spaced wavelengths. Figure 1 illustrates the core principle of the F-P interferometer.4
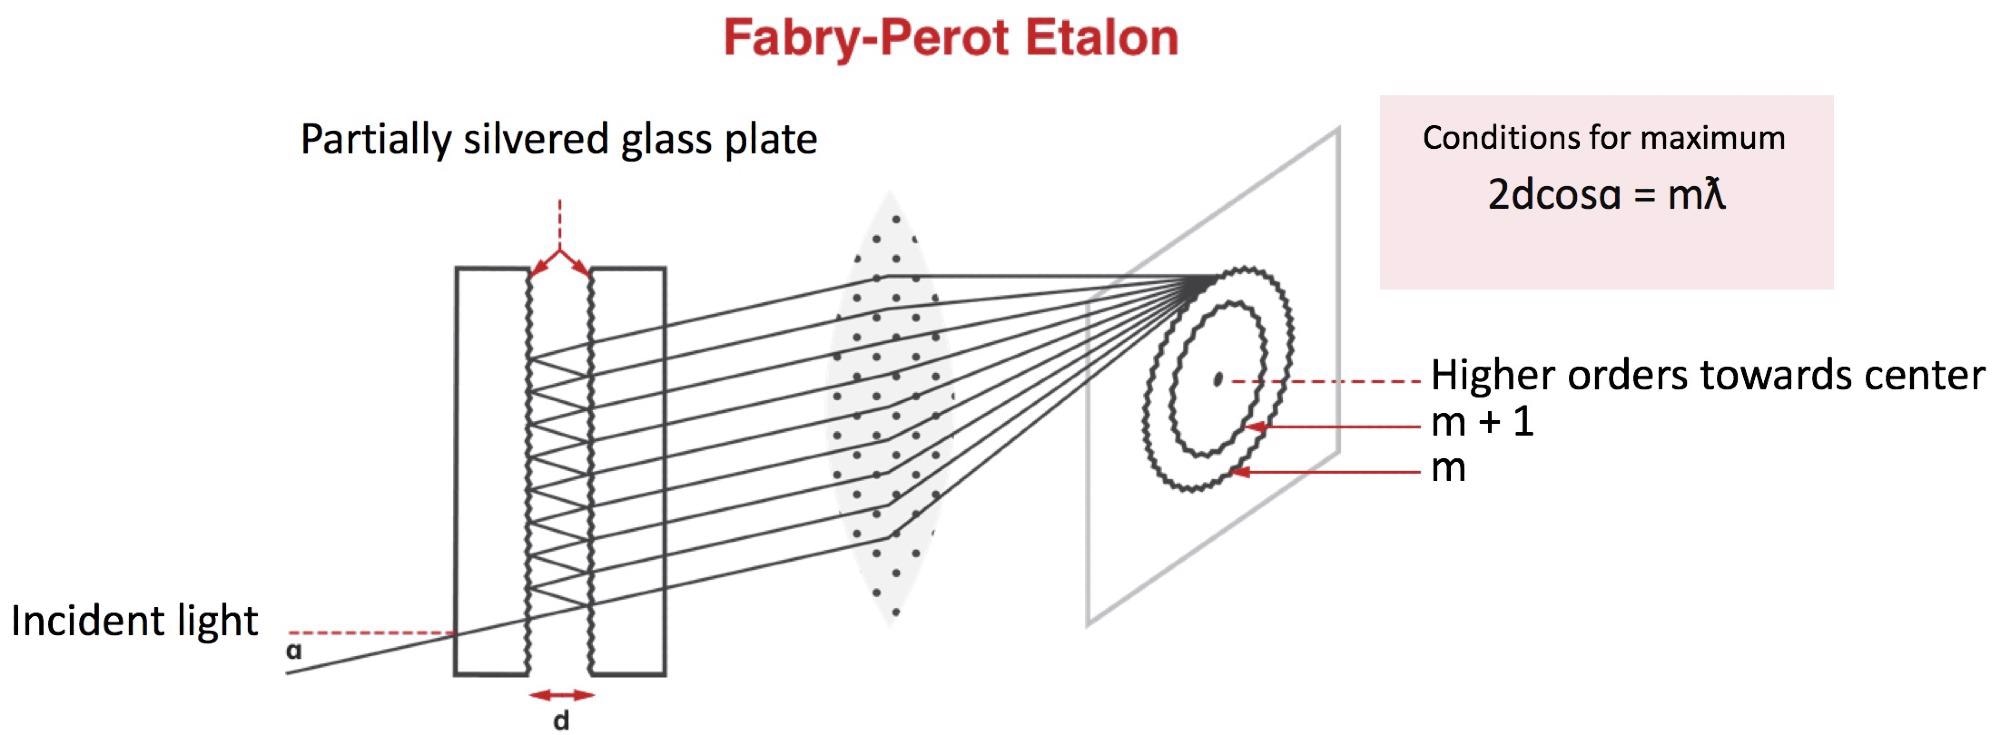
Figure 1. Principle of operation of an F-P interferometer, with the condition for the transmission maximum of the interference pattern5. Image Credit: LightMachinery
The maximum transmission of a particular wavelength (λ) requires the round-trip between the etalon plates to be an exact integral number (m) of wavelengths. Should the etalon’s illumination source provide a range of incident angles, the lens's focus will see circular fringes start to form.
Plate separation (d) of 0.25 mm will result in a round trip being equal to 1000 λ at 500 nm. It is highly feasible to achieve R ~50,000 when using a high-quality etalon, a 0.25 mm plate separation, and adequately reflective coatings.
F-P etalons with circular fringes offer considerably higher resolution, but these do suffer from two significant disadvantages.
Because only a small portion of the incident wavelength is transmitted via the etalon; most of this incident light is reflected back and therefore not accounted for by the measurement system. In most instances, >95% of light incident on the F-P etalon is lost.
An F-P etalon is also highly prone to overlapping orders. The example shown above sees light with a wavelength of 500 nm being transmitted through the 0.25 mm etalon, because precisely 1000 wavelengths will fit into a single round-trip. Unfortunately, because light with a wavelength of 500.5 nm is also transmitted via the etalon, there are instead 999 wavelengths in a round-trip. The measurement system is unable to differentiate between these two wavelengths. This phenomenon is known as “overlapping orders” (order #999 and #1000, in this example).
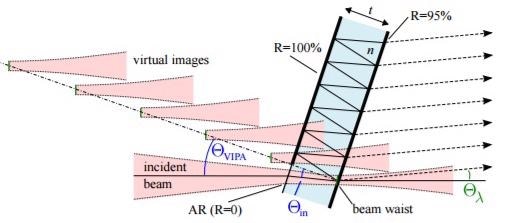
Figure 2. Principle of operation of a VIPA, which consists of two parallel reflecting surfaces (one ~100% reflective, one ~95% reflective). A cylindrical lens is used to focus the light into the VIPA through an antireflection coated slot in the R = 100% coating7. Image Credit: LightMachinery
A particular type of etalon known as a VIPA (Virtually Imaged Phased-Array, shown in Figure 2) is utilized alongside a grat to address this issueing. This approach overcomes the two disadvantages of the Fabry-Perot etalon discussed, while ensuring that high resolution is maintained.
The HyperFine Series of spectrometers has been developed using LightMachinery’s VIPA6 technology. These instruments ensure that, as light is focused into the tilted VIPA and that it can only exit in the forward direction via a 95% R surface. It should be noted that using a 100% R surface would not permit any light to be reflected backward at all.
In principle, this instrument’s VIPA allows the full range of incident light coupled into the VIPA to be imaged by the measurement system. This, of course, results in a considerable advantage over conventional F-P etalons that would generally reflect and lose more than 95% of the incident light.
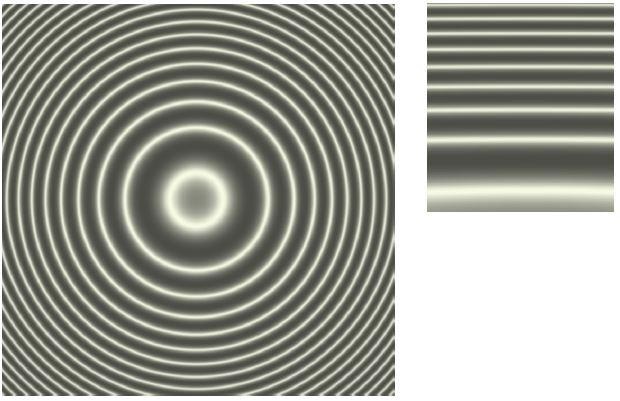
Figure 3. Typical light patterns for FP-etalons and VIPAs illuminated by a single wavelength of light. On the left is the pattern of light transmitted by an F-P etalon illuminated by the cone of light from a spherical lens. On the right is the light pattern transmitted by a VIPA illuminated by the same source and focused by a cylindrical lens. Image Credit: LightMachinery
Besides this key difference, VIPAs and F-P etalons operate in a comparable manner (Figure 3). The light pattern transmitted by a VIPA can be understood and compared to a thin “slice” of the light pattern transmitted by the F-P etalon. Therefore, a spectrometer based on a VIPA will still suffer from overlapping orders (Figure 4).
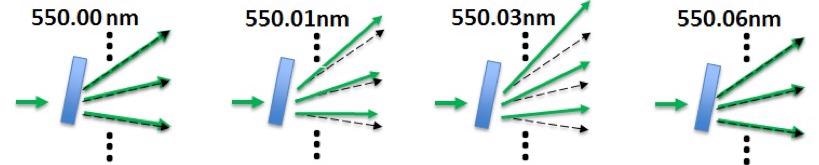
Figure 4. Three adjacent orders transmitted by a VIPA as the wavelength of the incident light is tuned in steps from 550.00 nm to 550.06 nm. Note that the VIPA cannot distinguish between light at 550.00 nm and 550.06 nm. The separation of these two wavelengths, 0.06 nm or 60 pm, is termed the Free Spectral Range (FSR) of the VIPA, and corresponds to a glass VIPA with a thickness of 1.68 mm6. Image Credit: LightMachinery
A VIPA illuminated via a cylindrical lens (Figure 2) can be used to disperse the various orders and wavelengths in the vertical direction, unlike the F-P etalon (Figure 3). The addition of a cross-dispersing element results in dispersion in the horizontal direction, therefore separating any overlapping orders. Resolution in the horizontal direction only needs to be adequate enough to separate adjacent orders, so the HyperFine spectrometer employs a reflective diffraction grating (Figure 5) to facilitate cross dispersion.
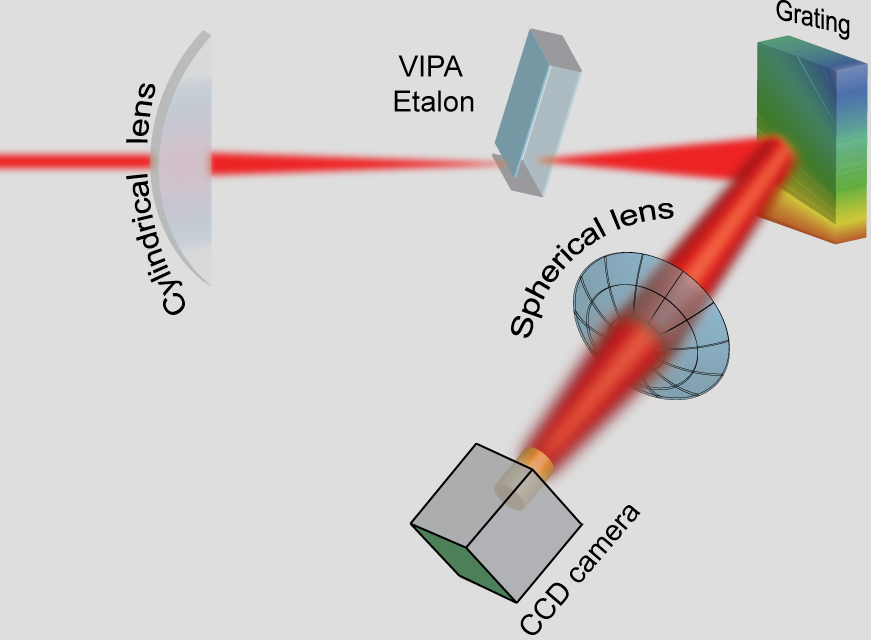
Figure 5. Schematic layout of the optical components in a HyperFine spectrometer9. The VIPA disperses the incident light in the vertical direction, providing a high resolution, but also overlapping orders. The grating separates the overlapping orders in the horizontal direction. Image Credit: LightMachinery
The VIPA and grating provide dispersion in the vertical and horizontal directions, respectively, meaning that it is possible to use a lens to focus the various wavelengths on a CMOS camera's surface. In this instance, the lens converts angles (in vertical and horizontal directions) into positions on the CMOS array, doing this at the lens's focus (Figure 6).
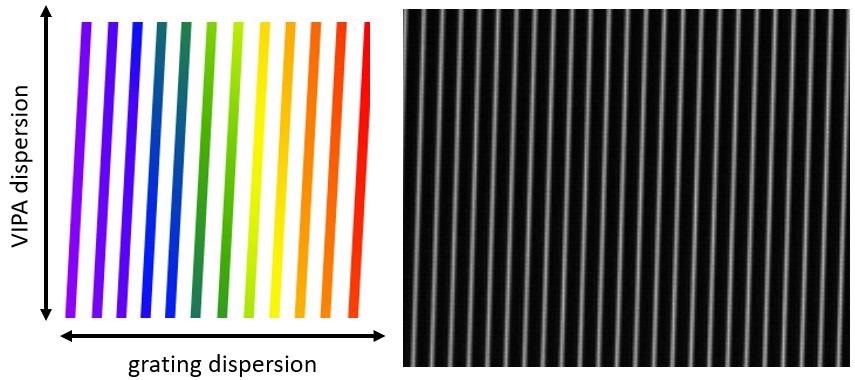
Figure 6. Schematic of the display expected at the CMOS camera when the crossed VIPA and grating are illuminated with broadband (“white”) light. In the vertical direction, the VIPA provides high resolution, but only for a range of one FSR. In the horizontal direction, the grating separates the overlapping orders to allow the entire high-resolution spectrum to be “unwrapped”. Thus, the vertical stripes are spaced by one FSR in the horizontal direction. In the chart, red represents longer wavelengths; blue shorter wavelengths. A typical screen shot from the camera is shown on the right. Only a small portion of the full CMOS sensor is shown, covering 23 FSRs of the VIPA horizontally, and 0.5 FSR vertically. Image Credit: LightMachinery
The HyperFine spectrometer from LightMachinery offers a distinct combination of high resolution (thanks to the VIPA) and an extended measurement range (thanks to the grating). The instrument employs current megapixel camera arrays and customized software to ensure unparalleled performance, despite its modest cost and compact size.
Recording and Calibrating Spectra Using the HyperFine Spectrometer
Every HyperFine spectrometer comes shipped with custom software. This user-friendly application allows the user comprehensive control over the way spectra are displayed, recorded, and calibrated. Users can also access raw output from the CMOS sensor, allowing them to develop their software applications for the analysis of particular spectral records. Examples of the raw sensor display for both a monochromatic light source and broadband light are displayed in Figure 7.
Figure 7 (upper) includes the same image as Figure 6, except this example has been slightly zoomed out. Here, “stripes” of light in the horizontal direction have been separated by one FSR of the VIPA. Meanwhile, Figure 7 (lower) displays three separate, intense light spots occurring in the vertical direction.
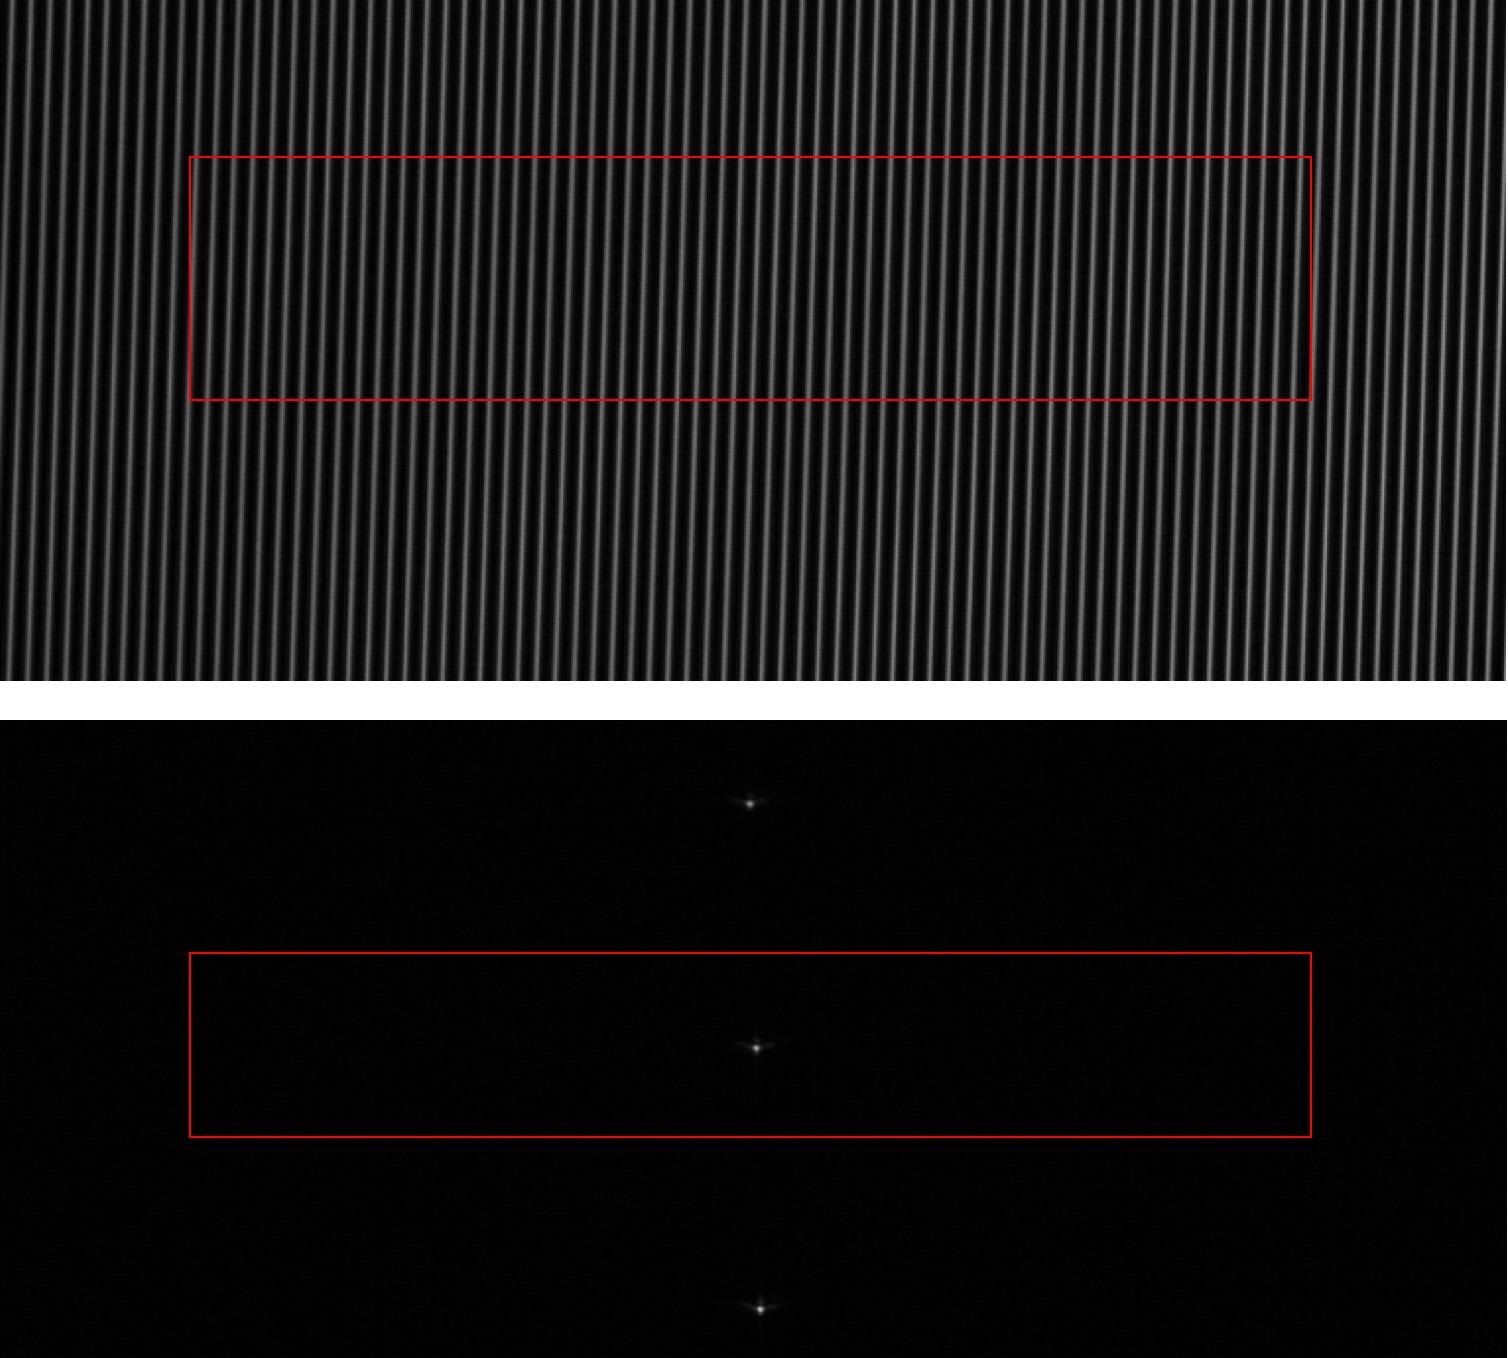
Figure 7. Typical CMOS sensor display when the HyperFine spectrometer is illuminated with broadband light (upper), and a narrow-line-width monochromatic laser (lower). The full spectrum can be extracted by “unwrapping” the information in the regions marked with a box. Image Credit: LightMachinery
Each of these spots represents a separate VIPA order, but each of them has been formed by the light of the same wavelength - the monochromatic laser’s wavelength. Therefore, redundant spectral information typically exists in the vertical direction, as spectral features repeat in each spectral order.
It is possible to extract the full spectra by “unwrapping” information contained in the sensor region highlighted in Figure 7 by boxes. The HyperFine software uses these images to calibrate the whole CMOS sensor in the horizontal and vertical directions. The software does this in the VIPA FSR units before establishing the range of “useful” pixels and determining the procedure to be utilized in this “unwrapping” process.
Should both the wavelength of the laser employed in recording Figure 7 (lower) and the exact FSR of the VIPA be known, then it is possible to calibrate the “unwrapped” spectrum in absolute wavelength.
However, in general, inputting a second known wavelength into the HyperFine spectrometer and using the positions of these two known wavelengths to calibrate the entire spectrum will result in higher accuracy. The HyperFine software accommodates either approach, ensuring it can generate a spectrum calibrated to better than 5 pm over the whole wavelength range.
Sunlight serves as an ideal light source when demonstrating the HyperFine spectrometer’s performance. Sunlight can be considered the original “white light” source; it is inexpensive while providing intense blackbody radiation ranging from the UV to the IR. Over 40,000 discrete absorption lines (Fraunhofer lines) are superimposed on the blackbody background, and a number of these lines feature line widths under 10 pm.
These Fraunhofer lines are found within the 270 nm to 1600 nm wavelength region, and the spectral positions of almost all these lines are already accurately known. Figure 8 displays two raw CMOS images that have been taken of dispersed sunlight using the HyperFine spectrometer.
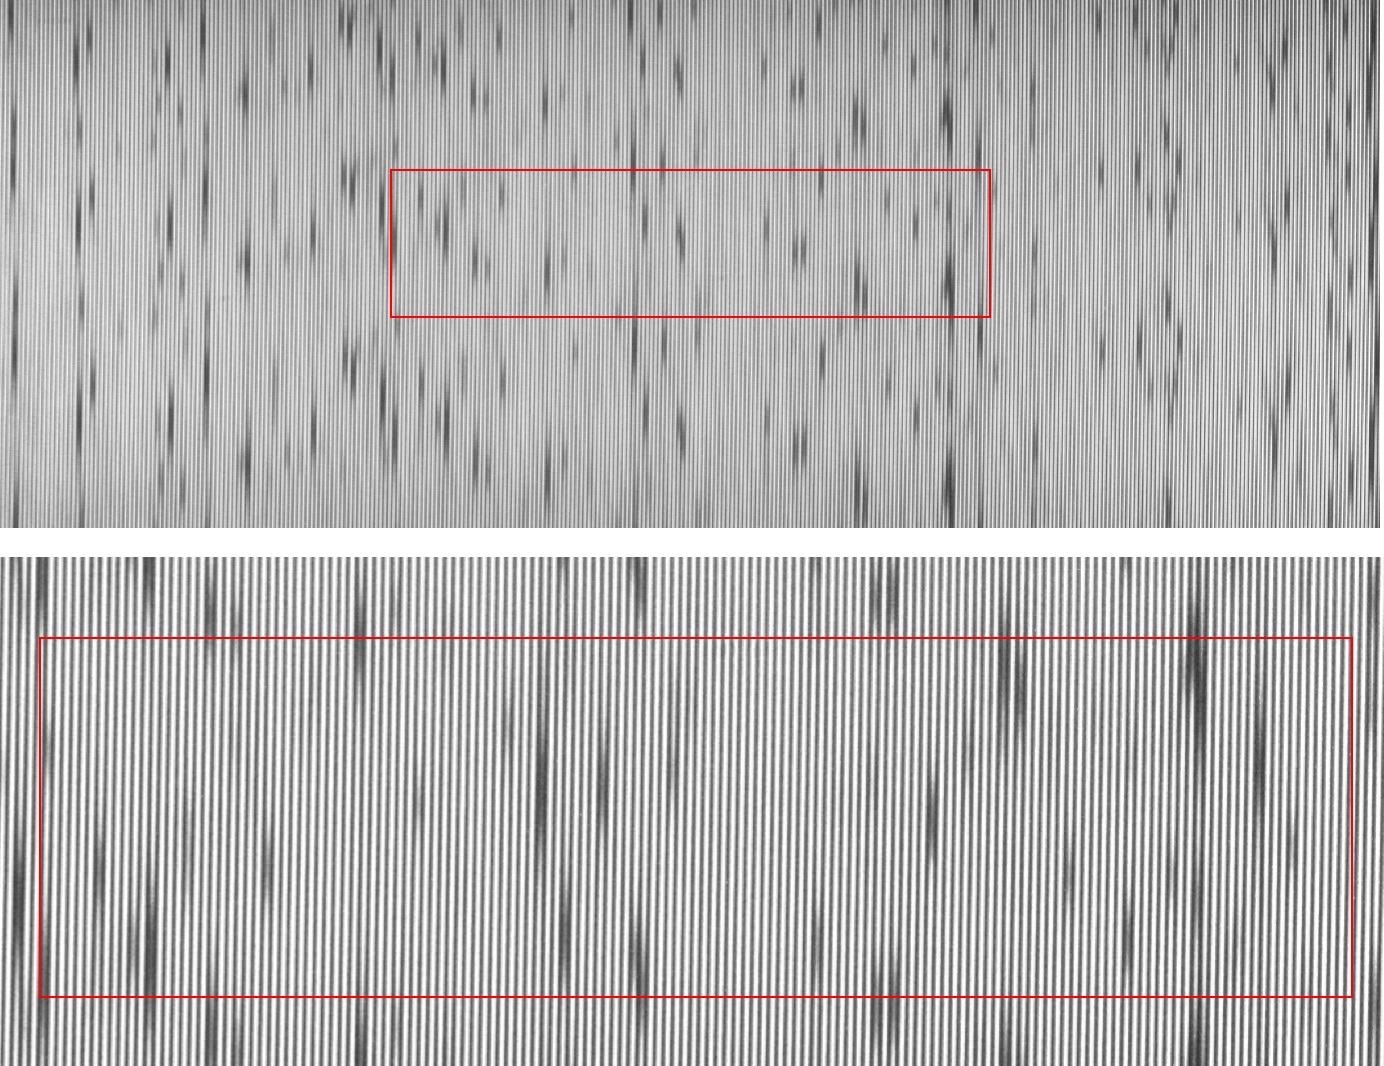
Figure 8. CMOS sensor images of sunlight taken with a HyperFine spectrometer. (The upper image covers the region from 527 to 547 nm, while the lower image covers a smaller spectral region from 532 541 nm). Multiple dark regions – each of which represents a Fraunhofer absorption line – interrupt the white light background of the sunlight. The red box in each image indicates one VIPA FSR in the vertical direction. The images were overexposed (i.e. highly saturated) for increased visibility. Image Credit: LightMachinery
The HyperFine software uses these images to unwrap the spectrum before calibrating the wavelength scale and producing output which the user can view (Figure 9).
Figures 8 and 9 demonstrate the HyperFine spectrometer’s performance when illuminated with broadband light containing numerous spectral features. Meanwhile, many applications such as Brillouin and Raman spectroscopy, measurement of diode laser modes, are used to investigate almost monochromatic light sources but still require very high resolution.
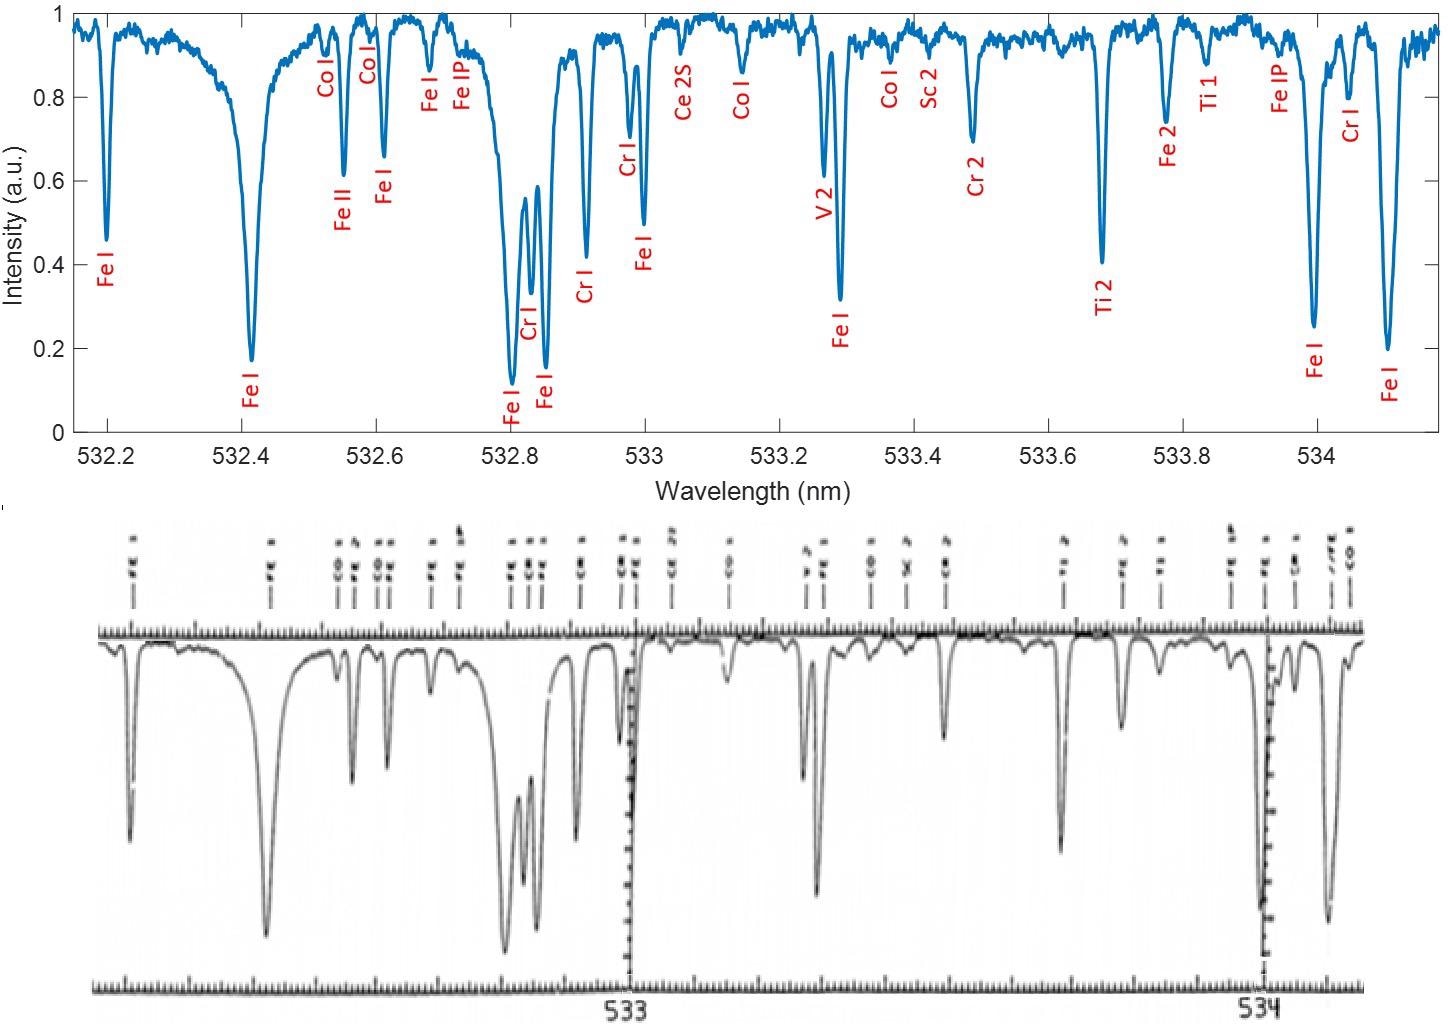
Figure 9. The upper trace shows the output from the HyperFine software once it has analyzed images such as those shown in Figure 8. The labels in red are the ionic species responsible for the individual absorption lines in the solar background, and the labels were added once the HyperFine spectrum was compared with a spectrum from the literature14. Image Credit: LightMachinery
The input to the HyperFine spectrometer was illuminated with a green He-Ne laser's output to demonstrate its performance with this type of light source effectively.
In this instance, the laser operates close to 544 nm while the narrow line-width of the gain medium is projected to support two or three longitudinal modes with a spacing of just 0.5 pm. This corresponds to a laser that is 30 cm long.
The extract spectrum is displayed in Figure 10. It should be noted that the spectral resolution demonstrated in Figure 10 equates to a resolving power of ~0.5 pm at a wavelength of 500 nm, or R=100,000,000. Spectrometers offering a high resolving power tend to be very large at >2 meters and highly expensive, often costing more than $100,000.
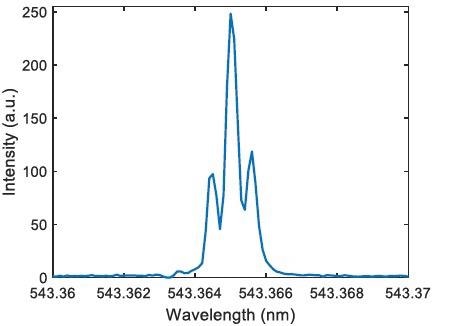
Figure 10. The extracted spectrum shows that the spectrometer can resolve longitudinal laser modes separated by only 0.5 pm (500 MHz or 0.17 cm-1). Image Credit: LightMachinery
References and Footnotes
1. If two wavelengths λ , and λ+Δλ , can just be separated (or resolved) by a spectrometer, the resolving power of the spectrometer, R is defined by:
R = λ /Δλ
Hence, a spectrometer operating at 500 nm with R = 10,000 can just separate two wavelengths that are spaced by 0.05 nm or 50 pm.
2. The link below provides a description of diffraction gratings: https://lightmachinery.com/optical-design-center/library/users-guides/grating-designer-users-guide/
A calculator for diffraction gratings can be found at: https://lightmachinery.com/optical-design- center/more-optical-design-tools/grating- spectrometer-designer/
3. The f-number of an optical system such as a lens is the ratio of the system's focal length to the diameter of the entrance pupil. It is a dimensionless number that is a quantitative measure of lens speed, and an important concept in photography and spectrometer design.
4. The link below provides an introduction to Fabry-Perot etalons: https://en.wikipedia.org/wiki/Fabry%E2%80%93P%C3%A9rot_interferometer
A calculator for F-P etalons can be found at the link below: https://lightmachinery.com/optical-design-center/etalon-designer/
5. Reprinted from: http://hyperphysics.phy- astr.gsu.edu/hbase/phyopt/fabry.html
6. A detailed description of VIPAs can be found at the link below: https://lightmachinery.com/optical-design- center/library/users-guides/vipa-designer-users- guide/
A VIPA calculator can be found at the following link: https://lightmachinery.com/optical-design- center/more-optical-design-tools/vipa-designer/
7. Reprinted from: Metz, Philipp, et al. Optics express 21.3 (2013): 3324-3335
8. Prisms, gratings, and etalons all separate the incident light into its components by ensuring that different wavelengths emerge at different angles – this variation in angle with wavelength is called dispersion.
9. Reprinted from: Van den Berg, Steven A., et al. Scientific reports 5 (2015): 14661.
10. The crossed-dispersion feature of the HF spectrometer is similar to that used in spectrometers based on echelle gratings. However, echelle-grating instruments with resolving powers comparable to the HF spectrometer are generally much larger and more expensive.
11. Each VIPA order is centered on a different “stripe”, as shown schematically below:
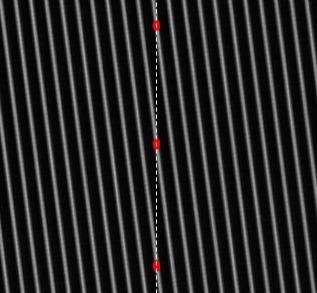
Image Credit: LightMachinery
12. An introduction to the Fraunhofer lines can be found in the Wikipedia article: https://en.wikipedia.org/wiki/Fraunhofer_lines
13. Line-widths of several of the stronger Fraunhofer lines are listed at: http://www.coseti.org/9006-025.htm
14. Beckers, Jacques M., Charles A. Bridges, and Lou B. Gilliam. A High Resolution Spectral Atlas of the Solar Irradiance from 380 to 700 Nanometers. Volume 2. Graphical Form. No. AFGL-TR-76-0126 (II). AIR FORCE GEOPHYSICS LAB HANSCOM AFB MA, 1976.
15. Additional documents available from LightMachinery describe high-resolution spectra of Hg calibration lamps, solar radiation, picosecond lasers, and Brillouin scattering.

This information has been sourced, reviewed and adapted from materials provided by LightMachinery.
For more information on this source, please visit LightMachinery.