LightMachinery has successfully developed a novel range of cross-dispersion spectrometers in recent years.
The LightMachinery family of spectrometers accommodates the spectral range from 270 nm to 1675 nm (1 nm = 10-9 meters, or 10 Angstroms), with some spectrometers offering users resolutions as high as 0.5 picometers (1 pm = 10-12 meters, 0.5 pm resolution is ~500 MHz at 500 nm) and ~300 nm wavelength coverage (Figure 1).
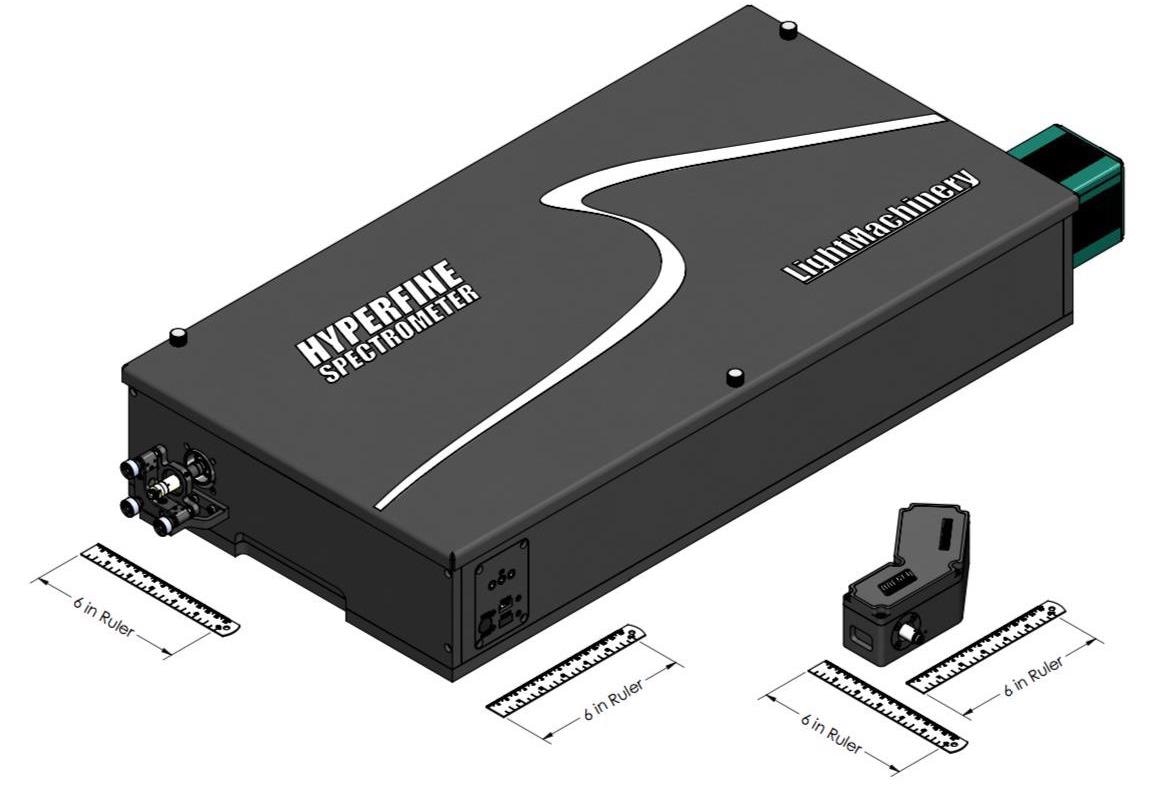
Figure 1. Two spectrometers, each with 6 in rulers for scale. The HN-9332 unit on the right has a resolution of ~30 pm, while the larger HF-8993-0.5 has a resolution of 0.5 pm. Image Credit: LightMachinery
LightMachinery’s crossed-dispersion spectrometers operate on a specific set of principles,1 using a Fabry-Perot type etalon to facilitate large dispersion and high resolution in the vertical direction. This dispersion is limited to a specific wavelength range corresponding to the etalon’s Free Spectral Range (FSR).
A diffraction grating is used in the horizontal direction to separate the overlapping orders of the etalon, therefore enabling “unwrapping” of entire high-resolution spectrum. The cross-dispersion scheme disperses incident light in two dimensions before this is captured using a 2D sensor, generally allowing over 10,000 spectral elements to be captured in one exposure.
If the spectrometer is illuminated by white light, the sensor sees the cross-dispersed spectrum as a series of near-vertical stripes (Figure 2).
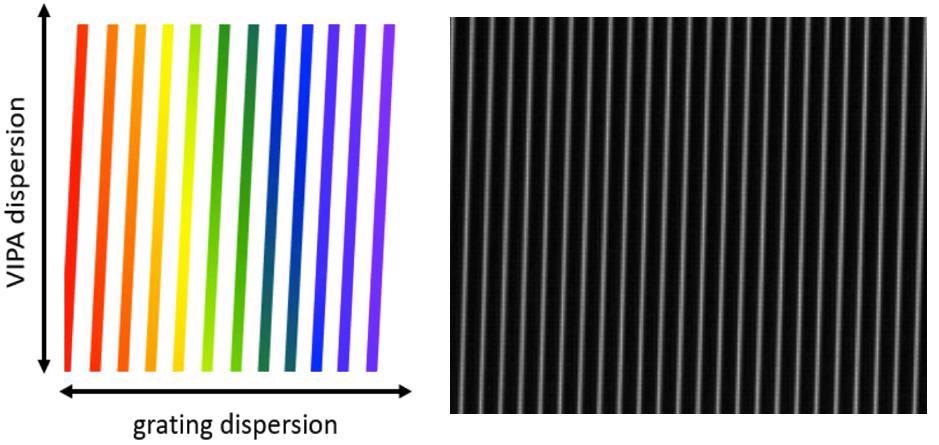
Figure 2. Left: Schematic of the display seen at the spectrometer sensor when the crossed etalon (or VIPA) and grating are illuminated with broadband (“white”) light. The vertical stripes are spaced by one etalon FSR in the horizontal direction. In the chart, red represents longer wavelengths; blue shorter wavelengths. A typical screen shot from the sensor is shown on the right. Only a small portion of the full sensor is shown, covering 23 FSRs of the etalon horizontally, and 0.5 FSR vertically. Image Credit: LightMachinery
The Sun itself is an especially useful and fascinating white light source. Direct sunlight is a highly intense white light source, while the existence of thousands of Fraunhofer absorption lines2,3,4 throughout the spectrum means that sunlight offers an ideal means of calibrating and assessing the performance of a spectrometer.
The Properties of Sunlight as a Light Source for Spectrometers
Several sources provide comprehensive, highly accurate solar spectra.2,3,4 Figure 3 shows the visible part of the Sun’s spectrum, displaying robust Fraunhofer lines in an expanded version close to 590 nm.
![The upper spectrum shows the strong Fraunhofer lines superimposed on the white light spectrum of the Sun. The labeled absorption lines are identified in [2]. The expanded view of the sodium D-lines is taken from [3].](https://www.azooptics.com/images/Article_Images/ImageForArticle_1891_16106887861349575.jpg)
Figure 3. The upper spectrum shows the strong Fraunhofer lines superimposed on the white light spectrum of the Sun. The labeled absorption lines are identified in [2]. The expanded view of the sodium D-lines is taken from [3]. Image Credit: LightMachinery
The two closely spaced absorption lines located in the yellow portion of the spectrum are of particular note - these lines are sodium D-lines resulting from the absorption of yellow light by sodium within the outer atmosphere of the Sun. Accurate, high-resolution spectra of sunlight are available in reference materials.4 These range from the UV to well into the infrared.
Sunlight is a light source that is highly suited for not only demonstrating the capabilities of spectrometers, but also for calibrating them.
Coupling Sunlight into a Spectrometer and Tracking the Sun
The most straightforward means of displaying the solar spectrum on a LightMachinery spectrometer involves the coupling of direct sunlight into an optical fiber that is connected to the spectrometer’s input port.
Some versions of LightMachinery spectrometers offer the necessary throughput and sensitivity to record a solar spectrum by simply aiming the fiber end approximately in the Sun’s direction.
However, for most spectrometers, a lens must be used to collect sunlight with the input end of the fiber positioned at the focus of the lens. There are two key disadvantages to this rudimentary conceptual experiment.
To begin with, it is important to specifically aim the lens at the Sun while the fiber input at the focus is being positioned. Furthermore, the Earth’s daily rotation means that the image of the Sun at the focus will move one full disc diameter in around three minutes, therefore requiring frequent re-alignment to accommodate this movement.
It is possible to address these issues by coupling sunlight into a fiber via a commercial fiber collimator.5 The collimator can be mounted on a stable tripod and aimed at the Sun, allowing it to manually track the Sun’s movement across the sky. Alternatively, a more elegant approach would be to purchase a low-cost solar telescope6,7, which would be able to automatically track the Sun across the sky.
Upon request, LightMachinery can provide an eyepiece adaptor to couple the solar image into a fiber (Figure 4).
![The upper part of this Figure shows two solar telescopes that automatically track the Sun across the sky. Either one can be purchased for ~$500 [6,7]. The lower part of the Figure shows an eyepiece adaptor to couple light from the telescope into a fiber, and a commercial fiber collimator [5] that can be mounted on a tripod for manual tracking of the Sun.](https://www.azooptics.com/images/Article_Images/ImageForArticle_1891_16106888366147058.jpg)
Figure 4. The upper part of this Figure shows two solar telescopes that automatically track the Sun across the sky. Either one can be purchased for ~$500 [6,7]. The lower part of the Figure shows an eyepiece adaptor to couple light from the telescope into a fiber, and a commercial fiber collimator [5] that can be mounted on a tripod for manual tracking of the Sun. Image Credit: LightMachinery
Examining the Solar Spectrum with LightMachinery Spectrometers
Once sunlight has been successfully coupled into the spectrometer, a stripe image will be recorded on the camera sensor (Figure 5). These stripes display a number of similarities with those shown in Figure 2, but in this instance, dark regions in the white stripes correspond to solar absorption lines.
It is in these narrow wavelength regions that light intensity from the Sun is decreased via absorption. This takes place in the outer layers of the Sun’s atmosphere (Fraunhofer lines), or via absorption within the Earth’s atmosphere (telluric lines caused by gases such as water vapor or oxygen). Each individual stripe is separated by a single FSR of the etalon or VIPA.
The etalon FSR is accurately determined by its manufacturing process, meaning that it is relatively straightforward to compare a raw sensor image with the solar spectrum from existing literature. In instances where an approximate spectral region is known (for example, from the grating angle), then an accurate calibration is not required.
![A comparison of the solar spectrum from [4] with the sensor image recorded near 526 nm. The sensor display is a grey-scale image with white pixels corresponding to higher intensities. The solar spectrum has been scaled in the X-direction to agree with the known stripe spacing in the image. The wavelength range is ~524 to 528.5 nm, covering 90 stripes.](https://www.azooptics.com/images/Article_Images/ImageForArticle_1891_16106888525029890.jpg)
Figure 5. A comparison of the solar spectrum from [4] with the sensor image recorded near 526 nm. The sensor display is a grey-scale image with white pixels corresponding to higher intensities. The solar spectrum has been scaled in the X-direction to agree with the known stripe spacing in the image. The wavelength range is ~524 to 528.5 nm, covering 90 stripes. Image Credit: LightMachinery
Figure 5 displays such a comparison, with the sensor image flipped by 180 degrees in the horizontal direction to match the wavelength display shown in the reference materials.4
Thoroughly examining the sensor image in Figure 5 shows that several absorption features repeat at the bottom and top and bottom. According to the instrument’s principles of operation,1 the portion of the image shown represents >1 etalon order in the Y-direction, resulting in these repeating features.
Every LightMachinery spectrometer shipped includes the SpectraLoK software. This software package has been designed to “stitch” together successive stripes before displaying the resulting spectrum.
This process is known as “unwrapping”, and takes account of the non-linear dispersion in the vertical direction triggered by the etalon. Figure 6 displayed an unwrapped solar spectrum for an interesting region close to 518 nm; this spectrum is shown as directly displayed by the SpectraLoK software.
![Solar spectrum recorded by the HN-9332 spectrometer in the region near 518 nm displaying the Mg triplet absorption in the Sun’s outer layers. (In addition to the Mg and Fe lines indicated, there are also some Ni absorption lines in this region of the solar spectrum [8]).](https://www.azooptics.com/images/Article_Images/ImageForArticle_1891_16106888714233468.jpg)
Figure 6. Solar spectrum recorded by the HN-9332 spectrometer in the region near 518 nm displaying the Mg triplet absorption in the Sun’s outer layers. (In addition to the Mg and Fe lines indicated, there are also some Ni absorption lines in this region of the solar spectrum [8]). Image Credit: LightMachinery
As well as directly displaying spectra, the SpectraLoK software facilitates the exporting of data for further analysis and comparison with existing reference spectra. Figure 7 displays comparison graphs that use data downloaded via SpectraLoK (red data) and a related reference spectrum4 (blue data).
Figure 7 also demonstrates the spectral density of the absorption lines, the usefulness of this online data for comparisons with experimental spectra and the quality of the high-resolution solar spectra available.
![Comparison of a solar spectrum recorded with a LightMachinery HF-8989-2e spectrometer (red data), and a reference spectrum (blue data) from [4]. The region displayed is ~ 1nm wide, centered around 628 nm.](https://www.azooptics.com/images/Article_Images/ImageForArticle_1891_16106888944497917.jpg)
Figure 7. Comparison of a solar spectrum recorded with a LightMachinery HF-8989-2e spectrometer (red data), and a reference spectrum (blue data) from [4]. The region displayed is ~ 1 nm wide, centered around 628 nm. Image Credit: LightMachinery
Working with the Sun - Coverage of ~300 nm in a Single Exposure
The solar spectrum includes the range from UV to IR, including spectral absorption lines that are created as light moves through the Sun’s outer atmosphere and the Earth’s atmosphere. This means that there are many possibilities for interesting spectrometer demonstrations and experiments.9
For example, Figure 8 displays a solar spectrum acquired using a HN-9332 spectrometer. This spectrometer records almost all of the visible range of wavelengths with one exposure.
The HN-9332 spectrometer’s instrument resolution is best articulated as frequency units - ~20 GHz across the instrument’s wavelength coverage, corresponding to a resolution of ~15 pm at 425 nm, ~20 pm at 550 nm, and ~30 pm at 700 nm. The data displayed in Figure 8 can therefore be understood as being equivalent to >10,000 resolution points, all of which are recorded in a single exposure of under one second.
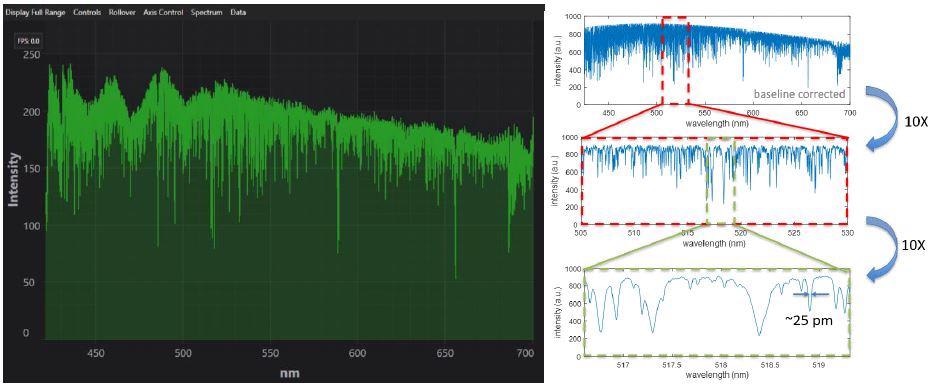
Figure 8. Demonstrating the wide wavelength coverage of the HN-9332 spectrometer by recording the visible region of the solar spectrum with a single exposure of only 0.7 seconds. The left portion of the Figure shows the entire 425-700 nm wavelength range as displayed directly by the SpectraLoK software. The number of pixels on the computer screen, rather than the resolution limit of the spectrometer, limits the accurate representation of the multitude of absorption lines. The right part of the Figure shows successively expanded regions around the magnesium triplet near 517 nm. Image Credit: LightMachinery
The HN-9332 instrument’s broad wavelength coverage allows for rapid “survey” spectra to be taken throughout the spectrum’s visible region. However, many Fraunhofer lines and the majority of telluric lines are narrower than the resolution of the HN-9332 instrument. Higher resolution spectrometers are required for detailed examination of the solar spectrum’s interesting regions; for example, those from the HF-8989 family.
High Resolution Solar Spectra
Figure 9 displays an especially interesting region of the solar spectrum. This region – found at around 689 nm - is dominated by telluric absorption caused by oxygen in the Earth’s atmospheric. Here, individual absorption lines in R- and P-branches of the oxygen band can be clearly observed, with the stronger absorption lines demonstrating ~100% absorption at the line-center.
![Telluric oxygen band in the 689 nm region of the solar spectrum. The screenshot on the left was recorded with a HN-9332 instrument (resolution ~30 pm). The experimental data (red) on the right was recorded with an HF-8989-3 spectrometer with a resolution of ~1 pm, and this experimental data is compared with a spectrum from [4] (blue).](https://www.azooptics.com/images/Article_Images/ImageForArticle_1891_16106929667151917.jpg)
Figure 9. Telluric oxygen band in the 689 nm region of the solar spectrum. The screenshot on the left was recorded with a HN-9332 instrument (resolution ~30 pm). The experimental data (red) on the right was recorded with an HF-8989-3 spectrometer with a resolution of ~1 pm, and this experimental data is compared with a spectrum from [4] (blue). Image Credit: LightMachinery
Telluric oxygen lines tend to have considerably narrower linewidths than Fraunhofer lines, so these are occasionally utilized in the determination of instrumental linewidths for spectrometers employed to record the solar spectrum.
A paper published by Fathivavsari et al. in 201410 described the use of two telluric oxygen lines (near 629 nm) to evaluate instrument profiles of two different spectrometers that were being used to record spectral atlases of the Sun. Figure 10 displays results from the use of a LightMachinery HF-8989-3 spectrometer recording the same two oxygen lines.
![On the left is a high-resolution solar spectrum taken with a HF-8989-3 spectrometer in the 629 nm region. The two oxygen lines used in [10] to compare instruments profiles are identified with arrows. (Experimental data shown in red and compared with a reference spectrum from [4] in blue). The right side shows expanded views of the oxygen line at 629.216 nm, together with an inset showing the spectrum of a red He-Ne laser (essentially a single frequency source at 632.816 nm) recorded with the same instrument resolution.](https://www.azooptics.com/images/Article_Images/ImageForArticle_1891_16106890222885820.jpg)
Figure 10. On the left is a high-resolution solar spectrum taken with a HF-8989-3 spectrometer in the 629 nm region. The two oxygen lines used in [10] to compare instruments profiles are identified with arrows. (Experimental data shown in red and compared with a reference spectrum from [4] in blue). The right side shows expanded views of the oxygen line at 629.216 nm, together with an inset showing the spectrum of a red He-Ne laser (essentially a single frequency source at 632.816 nm) recorded with the same instrument resolution. Image Credit: LightMachinery
Fathivavsari et al.10 made use of a large grating spectrometer. This spectrometer used 30 cm diameter mirrors with focal lengths of 3 m, and a 16 cm wide grating. In their experiment, this spectrometer measured a FWHM of 8.9 pm for the oxygen line at 629.216 nm.
The results from this experiment were then compared with measurements made on the huge FT spectrometer at Kitt Peak,11 which returned a FWHM measurement of 3.1 pm for the same oxygen line. Meanwhile, the smaller HF-8989-3 spectrometer measured FWHM of 3.6 pm for this line.
Both the Kitt Peak and HF-8989 spectrometers show very little instrumental broadening of the oxygen lines. It should be noted that the HF-8989-3’s instrument resolution is 1.0 pm, as demonstrated by the He-Ne spectrum. Meanwhile, the Kitt Peak’s instrument resolution of the 1m path-difference FTS is ~0.2 pm.
Atmospheric Investigations
Telluric oxygen lines may be used to explain the change in the solar spectrum seen as the pathlength of the sunlight through the Earth’s atmosphere differs (Figure 11).
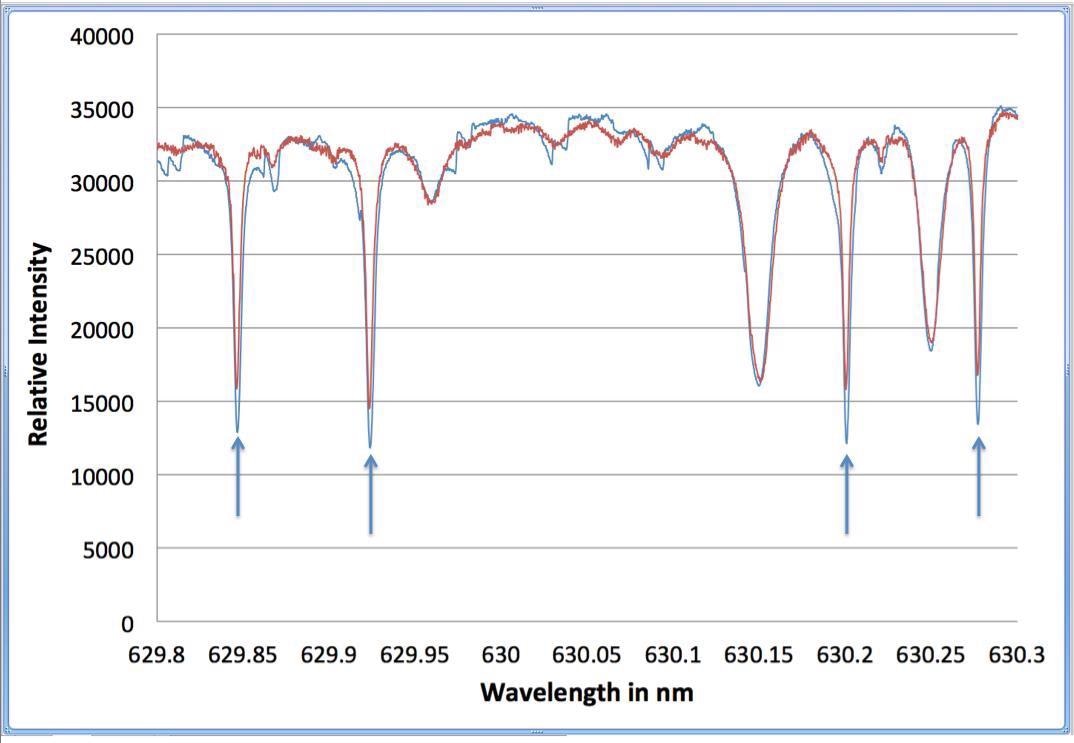
Figure 11. Effect of change in the pathlength through the earth’s atmosphere on the solar spectra taken near 630 nm. This region contains both narrow telluric oxygen lines, and wider Fe solar lines. The red spectrum was recorded near noon, while the blue spectrum was recorded later in the afternoon. The additional oxygen absorption caused by a longer path through the earth’s atmosphere can be clearly seen in the four oxygen lines marked by arrows. Image Credit: LightMachinery
Telluric lines can be identified by their sensitivity to pathlength through the atmosphere. When solar spectra from different websites are compared, it is commonly clear that the spectra have been taken with considerably different pathlengths through the Earth’s atmosphere.
In most cases, comparing experimental solar spectra with reference solar spectra4 allows for easy confirmation of a spectrometer’s calibration. In some spectral regions, however, there might not be an exact correspondence between the experimental absorption lines and the lines displayed in the reference spectra. For example, extra absorption lines can appear in the experimental spectra in the wavelength region near 800 nm (Figure 12).
![Demonstration of the effects of humidity on solar spectra by comparing spectra from [4] (blue) with spectra taken in Ottawa on a humid summer’s day using a HF-8995-1 spectrometer (red). In the left chart, it is easy to recognize the 3 Fraunhofer lines marked with yellow lines. From [8] the remaining two lines (marked with blue arrows) can be identified as atmospheric water vapour lines. The right chart shows a nearby wavelength region where water vapour lines dominate the spectra. Clearly the spectra from [4] were recorded at a location with much less water vapour in the atmosphere.](https://www.azooptics.com/images/Article_Images/ImageForArticle_1891_1610689142593628.jpg)
Figure 12. Demonstration of the effects of humidity on solar spectra by comparing spectra from [4] (blue) with spectra taken in Ottawa on a humid summer’s day using a HF-8995-1 spectrometer (red). In the left chart, it is easy to recognize the 3 Fraunhofer lines marked with yellow lines. From [8] the remaining two lines (marked with blue arrows) can be identified as atmospheric water vapour lines. The right chart shows a nearby wavelength region where water vapour lines dominate the spectra. Clearly the spectra from [4] were recorded at a location with much less water vapour in the atmosphere. Image Credit: LightMachinery
Recording the spectrum of the Sun not only provides details about conditions in the Sun’s outer atmosphere, it also provides useful information about the Earth’s atmosphere in the area above the spectrometer itself.
Measuring Doppler Shifts Caused by the Sun’s Rotation
Because solar absorption lines and telluric oxygen lines are in close proximity in some regions of the solar spectrum, this close proximity can be leveraged to ascertain the Sun’s rotational velocity, and therefore the current distance between the Earth and the Sun, by measuring the Doppler shift of solar lines relative to fixed oxygen lines.
The only equipment required to perform this experiment is a HF spectrometer and a solar telescope. As the Sun rotates relative to the Earth, one limb of the Sun’s disc moves towards the Earth, while the other recedes. Because of this, light from one side of the Sun’s disc will be red-shifted by the Doppler effect, while light from the other side will be blue-shifted.
It is possible to observe and understand these shifts as shifts in the wavelength of solar lines relative to telluric oxygen lines - oxygen lines resulting from absorption in the Earth’s atmosphere, is stationary in relation to the telescope. Figure 13 shows the key measurement for this particular experiment.9
The maximum Doppler shift from limb to limb of the Sun’s disc is only ~8 pm,9,12 so the HF-8989-3’s total instrument resolution (~1 pm) is necessary for accuracy.
However, LightMachinery spectrometers’ fast acquisition rate is also extremely beneficial for this type of measurement. Rather than setting up a complex imaging system to show the portion of the Sun’s disc coupled into the spectrometer fiber, it is possible to simply set the SpectraLoK software to record a new spectrum every 100 milliseconds as the telescope scans from one limb to the other.
The instrument’s capacity to rapidly display live spectra makes it possible to find telescope positions with significant Doppler shifts, while recording longer-exposure spectra with improved signal-to-noise ratios at these positions. The Fe lines shown in Figure 13 are separated by ~5 pm because these spectra were not taken at the extremities of the Sun’s disc.
![A measurement of the Doppler shift of two Fraunhofer Fe lines (relative to the unshifted oxygen telluric lines) caused by the Sun’s rotation. In the left chart, the red and blue lines are experimental data taken with an HF-8989-3 spectrometer as the image of the Sun’s disc was moved across the input fiber to the spectrometer (from near one edge to near the other). The exposure time for each experimental spectra was <1 second. The figure on the right side is taken from [9], and shows a similar measurement made with a SPEX 1704 1-m grating spectrometer.](https://www.azooptics.com/images/Article_Images/ImageForArticle_1891_16106891632114134.jpg)
Figure 13. A measurement of the Doppler shift of two Fraunhofer Fe lines (relative to the unshifted oxygen telluric lines) caused by the Sun’s rotation. In the left chart, the red and blue lines are experimental data taken with an HF-8989-3 spectrometer as the image of the Sun’s disc was moved across the input fiber to the spectrometer (from near one edge to near the other). The exposure time for each experimental spectra was <1 second. The figure on the right side is taken from [9], and shows a similar measurement made with a SPEX 1704 1-m grating spectrometer. Image Credit: LightMachinery
Conclusion
Sunlight is an intense, cost-effective light source that includes thousands of “built-in” calibration features. This article explored just some of the fascinating observations and experiments that can be undertaken using sunlight as the illumination source.
The experiments were made possible thanks to the wide spectral coverage and high resolution of the LightMachinery family of spectrometers. Several other, similar experiments remain possible in spectral regions from the UV, far into the IR.
References
- https://lightmachinery.com/media/1857/hyperfine-principles-of-operation.pdf
- https://mark4sun.jpl.nasa.gov/report/UT_seminar_Solar_Spectrum_Toon.pdf
- http://fermi.jhuapl.edu/liege/s08_0364.html
- http://bass2000.obspm.fr/solar_spect.php?lang=en
- https://www.thorlabs.com/navigation.cfm?guide_id=27
- https://www.ioptron.com/product-p/8806.htm
- https://maisonastronomie.ca/en/product/solarquest-skywatcher/
- http://bass2000.obspm.fr/download/solar_spect.pdf
- Stephen J. Ratcliff et. al., “High-resolution spectroscopy in the undergraduate physics laboratory”, Am. J. Phys. 60 (7), July 1992, pp 645-649.
- https://arxiv.org/pdf/1407.5727.pdf
- http://www.astrosurf.com/spectrohelio/spectre_solaire-en.php

This information has been sourced, reviewed and adapted from materials provided by LightMachinery.
For more information on this source, please visit LightMachinery.