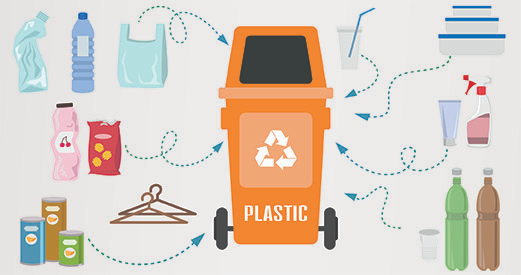
The problem of plastic waste continually flowing into the environment is an expanding issue, globally. As landfills get bigger and bigger, we must relinquish our single-use mentality and keep moving towards a habit of recycling to produce a more responsible plastic economy.
Identification of different types of plastic for separation can be a useful tool when considering how to recycle effectively, and Raman spectroscopy provides both the speed and specificity to help.
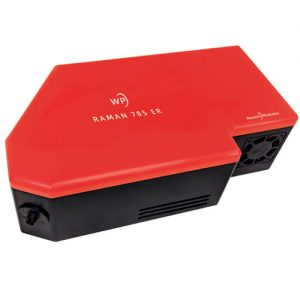
This article introduces the WP 785 ER extended range Raman spectrometer as the tool best optimized to distinguish between plastic types, due to its excellent spectral range far exceeding the fingerprint region, high sensitivity and signal to noise ratio (SNR), and superb reproducibility.
The capacity of this extended range Raman spectrometer includes the ability to determine the chemical nature of plastic items right down to the specific type within some of the more diverse polymer families, as well as the presence of additives.
Raman’s narrow linewidth, high-sensitivity to non-polar bonds, and low-sensitivity to water and commonplace inorganic fillers make the method particularly well-suited for this application. Raman's unparalleled specificity in such a task, in combination with the rapid, accuracy of the WP 785 ER, could make this the perfect combination to bring plastic ID technology to life.
The extended range of the new WP 785 ER to 3500 cm-1 facilitates observation of C-H peaks in plastics which, together with its superior reproducibility, allows highly accurate library matching, even for very similar organic compounds like plastics.
A Global Problem
Plastic is a highly versatile material that is omnipresent in our daily lives: in fact, it’s difficult to imagine life today without it. The increased use of plastic, as a mass-produced product, did not begin until the 1960s but in as little as 20 years plastic had overtaken steel as the most commonly used material across the world.
Plastic is a designer material like no other – available in a wide range of form factors, simple to color or make transparent, and cost-effective. However, the bulk of plastic is manufactured for single-use items, including the 78 million tons of plastic packaging produced every year, a third of which finds its way to the ocean (one garbage truck every minute). By 2030, this amount is set to double if this trend continues at the present rate.
The increased awareness of the problem with plastic waste around the world, in conjunction with the greater scrutiny of industry practices, has produced a significant opportunity for better and more sustainable approaches to create a responsible plastic economy. Society's prevailing view of plastic as a high-quality, valuable, designer material, is a constant that also necessitates radical improvements in recycling economics and quality.
Due to the damaging effects that can be caused when mixing various kinds of plastics, recycled post-consumer plastic waste not only needs to be clean and colorless, but also of great chemical purity to contend with virgin material. Raman spectroscopy aids all three of these situations: by determining the type of polymer in the waste stream, capturing any residual contamination, and identifying the presence of dyes.
While this has been demonstrated using the fingerprint region of polymer spectra (to 2000 cm-1), this article will show how extended range and superior sensitivity, reproducibility, and SNR can provide highly accurate plastic identification at speeds practical for industrial use.
Reduce. Recycle. Raman.
Recording Raman spectra from a range of everyday plastic items enabled a sufficient demonstration of the capabilities of Raman spectroscopy to identify specific plastic types. This was achieved by taking 10 of the most common plastic material types and using them to develop a model for identification of plastic-type based on Raman spectroscopy.
The 38 plastic samples measured included plastic bottles, containers, tubing, syringes, bags, goggles, films, ties, tapes, and foam. This allowed for the incorporation of the most typical plastic or polymer types, including polyamide (PA), polyethylene (PE), polyester (PET), polystyrene (PS), polycarbonate (PC), polyurethane (PU), poly-methylmethacrylate (PMMA), polypropylene (PP), polytetrafluoroethylene (PTFE), and polyvinylchloride (PVC).
In addition to known plastics with visible markings and reliable chemical provenance, the samples included a small number of unmarked ‘unknowns’ to confirm that the algorithms would rightly dismiss those as failing to match approved, standard recyclable categories.
Measurements were conducted with the WP 785 ER, a high-performance, extended-range high-throughput spectrometer adapted with a temperature-regulated detector and 25 µm slit, covering a spectral range from 200 to 3500 cm-1 with a resolution of 9 cm-1. Moreover, a 785 nm, 300 mW laser was used to stimulate the Raman emission, with the routing of light to and from the sample via an RP 785 fiber-coupled Raman probe. A 105 µm, 0.22 NA routed laser light to the probe, and a 600 µm, 0.39 NA fiber paired with the spectrometer gathered any scattered light. Spectra are registered with an integration time of 200 ms without averaging: a total of 20 spectra were recorded at 4 different locations on each item.
As a result of the extended-range spectrometer’s high-resolution, the Raman spectra recorded are very rich in features, as shown by the comparison of singular sample spectra comprising of different polymer materials in Figure 1.
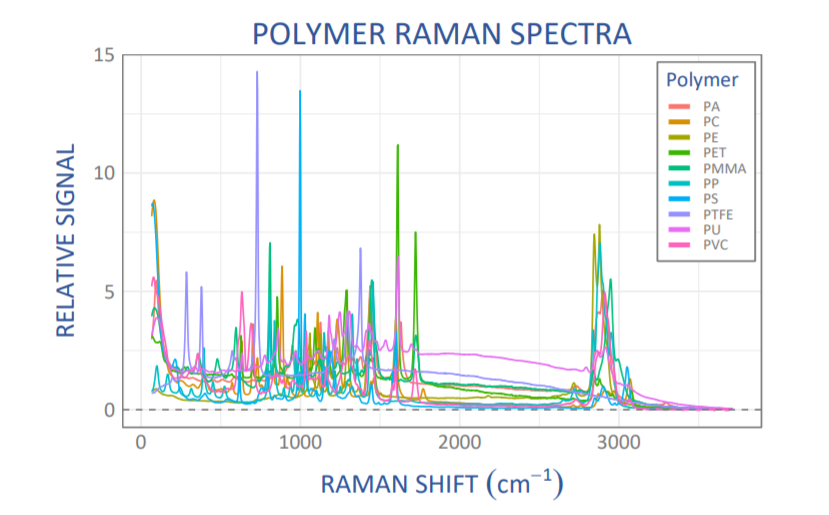
Figure 1: Comparison of Raman spectra for individual samples made of different polymer types. The signal is (SNV-) scaled for better comparison. PA = polyamide, PC = polycarbonate, PE = polyethylene, PET = polyester, PMMA = poly-methylmethacrylate, PP = polypropylene, PS = polystyrene, PTFE = polytetrafluoroethylene, PU = polyurethane, PVC = polyvinylchloride.
Despite the rapid acquisition time of just 200 ms, the spectra were high quality and demonstrated no discernible noise. High spectral quality and signal to noise (SNR) are vital when trying to reach greater confidence in polymer identification while high velocity is essential to the throughput of sorting systems used in recycling facilities.
First Steps in Analysis – ‘Plastically’ Different
Calculating the first derivative of each spectrum was the first step taken in analysis. Thus, observation at the first derivative of a spectrum attracts its main characteristics and exacerbates small differences between almost identical spectra. It can be utilized to locate precise peak locations, which show up as zero-crossings also in the first derivative.
Peak widths in the first spectrum convert into peak height in the first derivative, with narrower peaks exhibiting larger amplitudes also in the first derivative. The use of the first derivative in the analysis also helps remedy background signals and promotes multicomponent analysis. Differentiation and smoothing are frequently merged into a single algorithm such as a Savitzky-Golay filter for optimal results.
In this instance, calculations of the first derivative of each spectrum using a second-order Savitzky-Golay filter were performed while slightly oversampling with a 9-point window to eliminate any broadband fluorescent background. By scaling the derivative spectra to a conventional normal variate enabled the elimination of any signal variation due to differences in the sample-probe distance.
Numerical differentiation, like a high-pass filter, typically amplifies noise and is therefore averted in favor of ad-hoc background subtraction using smooth fits. Yet, because of the high signal-to-noise ratio in the spectra present, it was possible to evade such fits and take the favored derivative route, producing high-quality, background-free spectra.
High Reproducibility
For polymers with significant chemical uniformity, such as polystyrene, great reproducibility of the spectra from sample-to-sample was discovered, as well as from location-to-location as illustrated in Figure 2. This was despite significant variances in their form, even though this diverse group included a petri dish, several boxes, and the plastic center from a roll of tape.
Such reproducibility is vitally important to achieving high confidence in any spectral matching application while signifying superior wavelength stability of the WP 785 ER spectrometer employed.
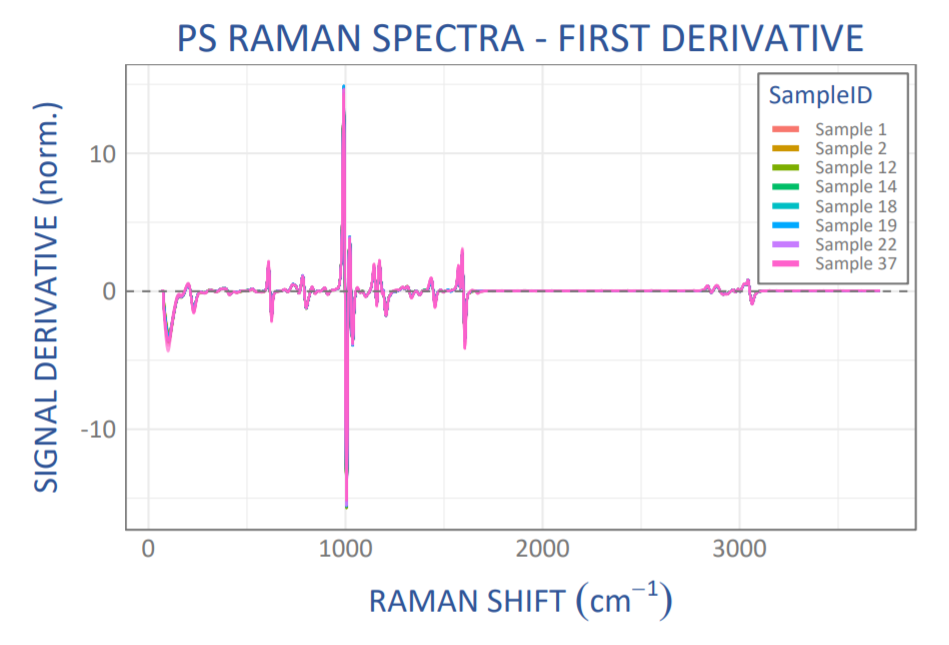
Figure 2: Scaled derivative Raman spectra from 8 different polystyrene (PS) samples (20 spectra each), showing excellent spectrum-to-spectrum reproducibility.
High Specificity
A further advantage of the superb spectral reproducibility seen from the WP 785 ER data of polymers was the capacity to identify even minor variables between spectra with the confidence that those differences are (statistically) significant. For example, Figure 3 demonstrates scaled derivative Raman spectra for two different polyamide (Nylon) samples.
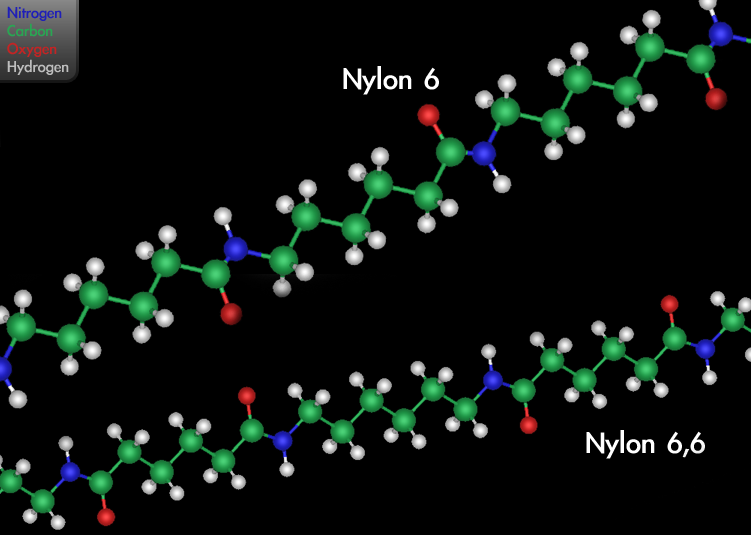
By Michael Ströck (mstroeck) at en.wikipedia – Transferred from en.wikipedia, CC BY-SA 3.0.
Various kinds of Nylon exist with different amounts of carbon atoms in the links between the amide groups, leading to slight discrepancies in the spectra, for instance around 950 cm-1. Given the outstanding sample-to-sample spectral reproducibility illustrated in Figure 2, we can rest assured that the minor differences between first derivative spectra seen in Figure 3 are considerable enough to assign these two samples as two different types of Nylon.
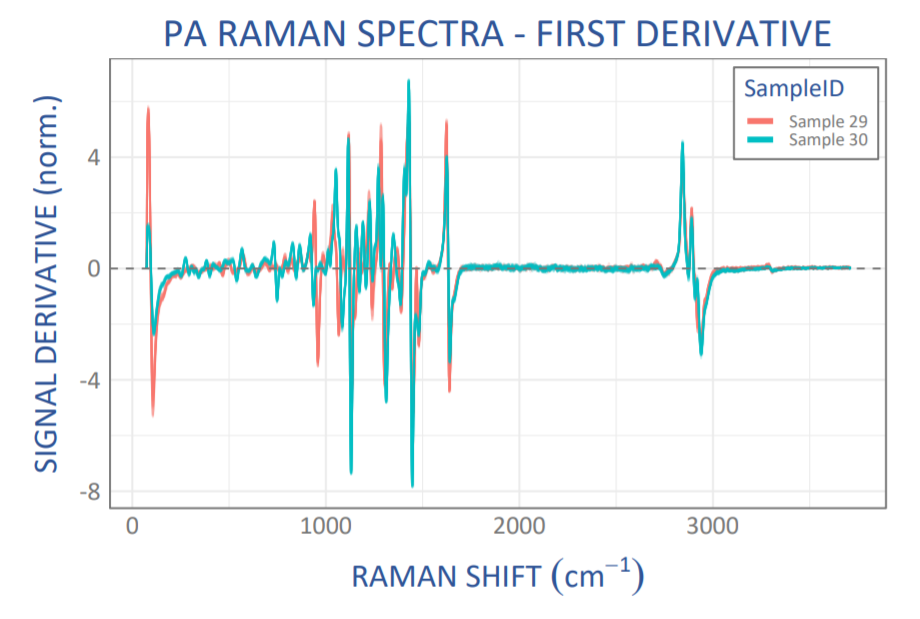
Figure 3: Scaled derivative Raman spectra from 2 different polyamide (PA) samples (20 spectra each) showing the high specificity, and clearly resolving even small spectral differences.
Identifying the Culprits
Once assurance was gained that the spectral quality was high and variances between spectra were significant, the next step was analysis. This was performed using statistical techniques to seek out correlations in the data and pairing the spectral data against a library.
For example, principal component analysis enables the visualization of the similarities, reproducibility, and differences between the Raman spectra of different polymer samples within the whole set of recorded spectra. In this instance, the primary components caught considerable signal contributions up to at least 15th order, which is testimony to the excellent quality of the signal and information content of the Raman spectra collected. Figure 4 demonstrates a score plot for the first two principal components, clearly exhibiting a distinction between different polymers, as well as the importance of any possible differences within a polymer group (for example PA).
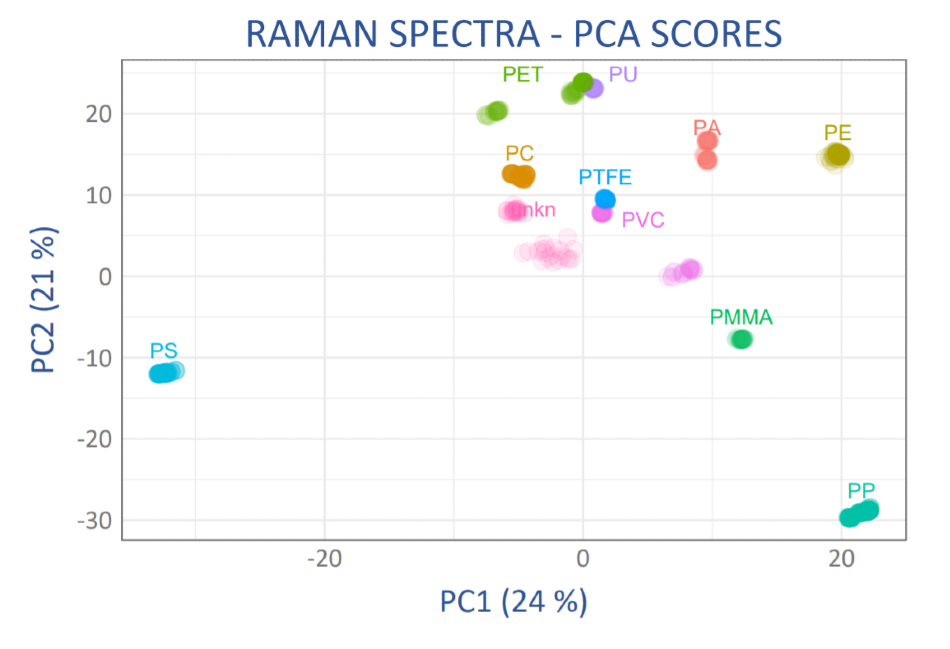
Figure 4: Scores plot for the first two principal components for the scaled derivative Raman spectra for all samples showing the high reproducibility and specificity of the spectra. Polymer abbreviations as in Figure 2, “unkn” = two samples of unknown polymer type.
Close clustering signifies that the major components selected are appropriate and significant for the identification of materials with a given group. Measurement of a successive unknown which converges with one of these groups can then be assigned to that material type. Having greatly reproducible spectra from sample-to-sample and location-to-location makes it far simpler to do so reliably.
Across the study of plastics, two polymer groups which are known to differ in their composition due to industry practices in manufacturing demonstrated more than one region of clustering, as would be expected: 1) the PVC group included vinyls with different plasticizer, and 2) the PET group included polyester (just a single variant in this family of polymers which includes Mylar®).
In comparison, chemically unambiguous polymers, such as polystyrene (PS), resulted in clearly defined, tight clusters, signifying both the applicability of Raman spectroscopy to the identification of plastics and also the superb quality of the data used in this specific study – a direct consequence of the performance capability of the WP 785 ER.
Matchmaking Polymers and Plastics
Despite qualitative PCA plot interpretation, the determination of a specific plastic or polymer type for high-quality recycling necessitates the statistical matching of a recorded Raman spectrum against a library of reference Raman spectra. To test the suitability of the latest configuration of the Raman system for this application, determination of spectral matching was conducted utilizing a somewhat different statistical method: Pearson’s correlation coefficient, r2, a measure of the linear correlation between two variables X and Y.
In this instance, Pearson’s correlation coefficient looked at the correlation between the scaled derivative Raman spectra for a given sample and all spectra in a library built from all residual samples with known polymer identity, that is, in “leave-one-out” (LOO) cross-validation.
Utilizing derivative spectra concentrates the matching algorithm on the edges of the vibrational bands and produces inherently high sensitivity to even slight spectral differences between any two spectra. However, this will, in turn, require outstanding wavelength stability of the spectrometer, a key characteristic of the Wasatch Photonics spectrometer design.
Therefore, determination of the combined confidence for both accepted and rejected matches using a cross-entropy (log-loss) function summed over all library spectra, yielding a numerical measure which is interpreted as the total uncertainty in the match. This numerical measure penalizes any wrong assignments, as well as low confidence in all correct assignments or rejections.
A low score (uncertainty) indicates a correct and confident assignment, the numerical value of which can be understood as the negative logarithm of the overall confidence; for example, an assigned uncertainty of 0.05 corresponds to overall matching confidence of 90% (-log(0.9) is about 0.05). The overall matching confidence varies dramatically by polymer type, as shown in Figure 5.
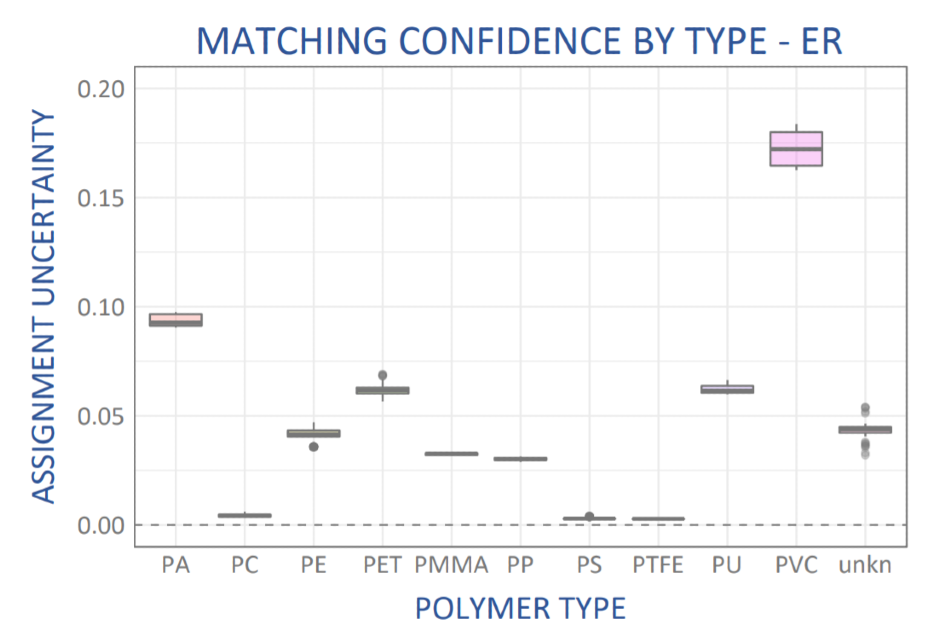
Figure 5: Assignment uncertainty for the match of each sample spectrum against a “leave-one-out” library constructed from the remaining sample spectra of known polymer type. PA = polyamide, PC = polycarbonate, PE = polyethylene, PET = polyester, PMMA = poly-methylmethacrylate, PP = polypropylene, PS = polystyrene, PTFE = polytetrafluoroethylene, PU = polyurethane, PVC = polyvinylchloride.
The polymer types with the largest uncertainty were those known to have chemical variation within their families (PA and PVC), as discussed above. All other polymer types showed >86% confidence in matching; those with unambiguous chemical structure, such as PC, PS, and PTFE yielded exceptionally high confidence in the spectral match, >98.5%.
The Case for Extended Range – The Best Gets Better
The spectra recorded and analyzed above were taken over the extended spectral range of the WP 785 ER, from 200 cm-1 to 3500 cm-1, although traditional wisdom would suggest that only the fingerprint region to 2000 cm-1 is necessary for identification applications. Would a more restricted range suffice for the identification of plastics?
When operating in a recycling environment in a real-world scenario, the fingerprint region might be overpowered with signals from sample contaminations, increasing the significance of the less-crowded high-frequency stretching vibrations beyond 2000 cm-1. Additionally, some everyday polymers, such as ABS, which was not part of the present sample set, feature typical vibrations in this region.
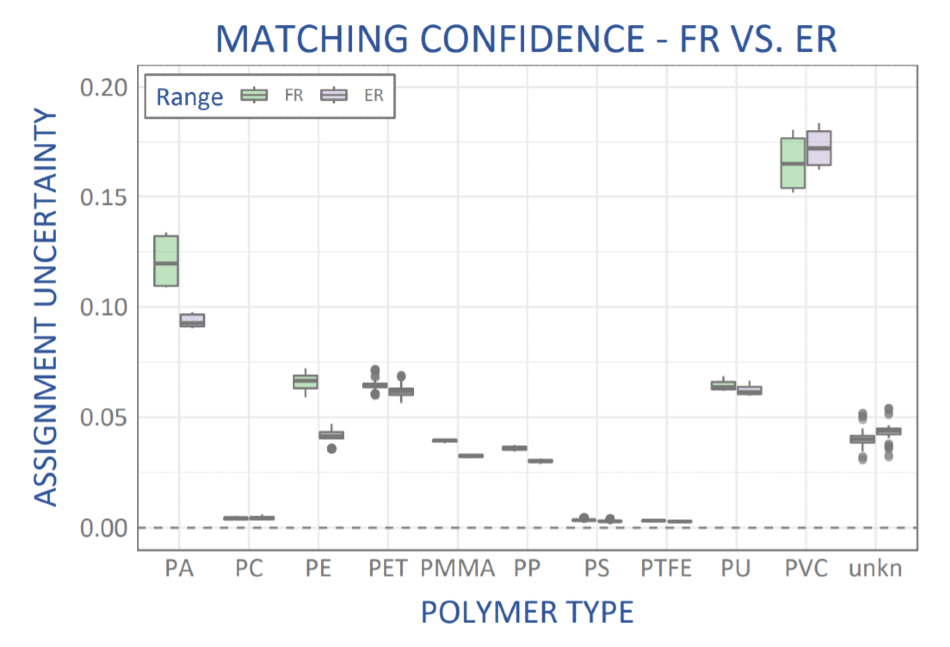
Figure 6: Comparison of matching confidence for plastics identification using spectral data over the fingerprint range to 2000 cm-1 (FR, green) vs an extended range to 3500 cm-1 (ER, grey).
The repetition of the analysis above was once more conducted in order to test the significance of using extended range spectral acquisition but this time using truncated spectra. Recognition of the polymer matching performance subsequent to the same methodology limited the upper end of the spectrum to 2000 cm-1 in order to simulate analysis using only the fingerprint region. The influence on polymer matching confidence due to the additional information made available in the extended spectral range is illustrated in Figure 6.
Even for the non-contaminated samples used in the present study, a (statistically) considerable improvement for most polymer types was observed, with an improvement in matching confidence between 10 and 25% for most polymer types. Polyethylene exhibited the greatest improvement in confidence; the matching uncertainty was nearly halved.
With a chemical structure that only appears in C-H and C-C bonds, the polyethylene vibrational spectrum is sparse in the fingerprint region but features a notable CH-stretch peak around 3000 cm-1, which in all likelihood results in the significant improvement in matching confidence.
The advancement in matching confidence for these 10 polymers as a group affirms the advantages of utilizing extended range for the accurate determination of plastic types in recycling, even when the spectra used in each case is highly reproducible, and with excellent SNR.
Conclusion
Raman spectroscopy is a useful and influential tool for the identification of plastic types that demand very high specificity, as exhibited throughout the analysis of common household and laboratory items with the new WP 785 ER extended range Raman spectrometer. Even when subjected to scan rates of just 200 ms, the gathered spectra provided superb SNR and reproducibility, enabling the development of a library of 10 polymer spectra against which plastics could be matched to positively identify the exact type of polymer used, even when restricted to the fingerprint region (as in our standard range WP 785 spectrometer).
When utilizing the full range of the WP 785 ER to 3500 cm-1 in library development and analysis, the matching confidence grew even more so for the common recyclable plastics tested. This validated and encouraged the belief in the suitability of this new spectrometer tool for progressively accurate polymer identification in high throughput sorting for the recycling of plastics. This demonstrates and proves that even the best can get better – with more and better data.
The WP 785 ER Raman spectrometer is available in TEC-regulated and TEC-cooled models extending out to 3500 cm-1, and can be purchased with a choice of slit size for as low as 6 cm-1 resolution. A hybrid model with onboard laser allows for an even more compact system size and greater value. These 785 Raman spectrometers are perfect for the analysis of nanomaterials, proteins, water content, and other materials high in saturated bonds, as well as identification applications that can benefit from the enhanced matching confidence of extended range Raman measurements.

This information has been sourced, reviewed and adapted from materials provided by Wasatch Photonics, Inc.
For more information on this source, please visit Wasatch Photonics, Inc.