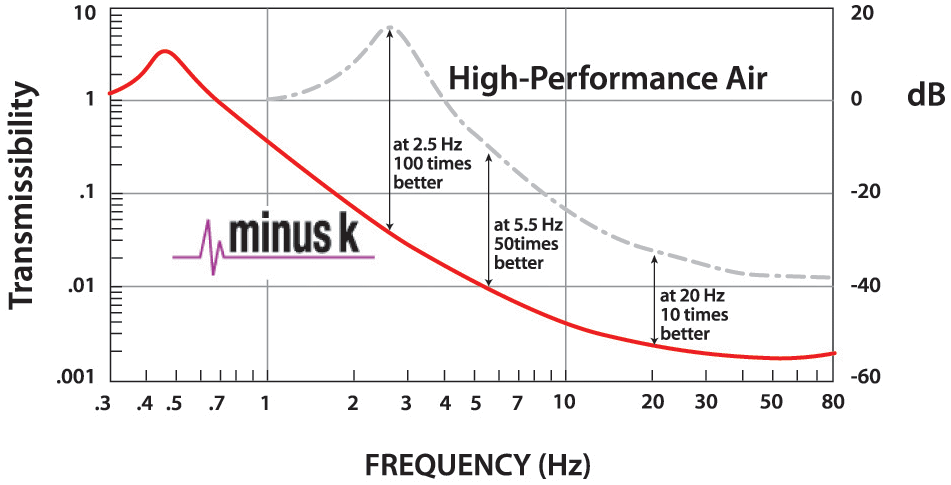
Based on user evaluations and field testing, the Minus K 1/2-Hz vibration isolation workstations and platforms perform between 10 and 100 times better than high-performance air tables, depending on the frequencies of vibration isolation. They also perform better than electronic-cancellation or active systems.
The transmissibility curves are shown below. These compare typical Minus K 1/2-Hz performance with top-performing air tables. Minus K isolators (adjusted to 1/2 Hz) attain 99.7% isolation efficiency at 10 Hz, 99% at 5 Hz, and 93% at 2 Hz.
Isolation performance is close to that of an ideal undamped single DOF system up to around 10 Hz and, at higher frequencies, reaches a floor in the transmissibility curve with several resonances.
For any Minus K 1/2-Hz system, vertical or horizontal, the Minus K curve below is typical. Measured transmissibility curves for some Minus K benchtop products can also be seen below.
Vibration Isolation Tables, Platforms & Custom Systems Videos
Transmissibility Test Procedure
A Stanford Research Instruments SR785 Dynamic Signal Analyzer was utilized to generate the transmissibility curves provided by Minus K Technology. The output source of the SR785 is set to generate a swept sine signal.
The signal is fed into a Labworks PA-138 power amplifier and the amplifier drives a Labworks ET-126 electrodynamic shaker. The shaker is mounted in a heavily reinforced frame which also supports a 650BM-1 isolator.
This support isolator has been modified to work only in the vertical direction and it has been adjusted to around 2.75 Hz. This isolator supports a heavy top plate and whatever ballast weight is required to get the total payload (including the test isolator) up to around 650 pounds.
As it applies to the isolators, transmissibility is a ratio of the output signal on the top plate divided by the input signal that the base of the isolator sees. It can also be thought of as the ratio of what passes through the isolator, divided by what is present on the isolator support. To establish the input and output signals, two similar accelerometers are employed.
The input accelerometer is joined to the heavy top plate on the 650BM-1 support isolator, and the test isolator also rests on the heavy top plate. By doing this, the accelerometer measures the vibrations fed to the isolator.
The output accelerometer is positioned on top of the properly loaded test isolator top plate and both accelerometers are held in place by a thin layer of seismic wax. This provides an easy to undo, yet secure, bond for measurement. The SR785 gathers both sets of data, quantifies their ratio, and shows the ratio as transmissibility.
In much the same way, the horizontal transmissibility was gathered. The differences were that the electrodynamic shaker was mounted horizontally, the support isolator was permitted to move horizontally, and the accelerometers were mounted on their sides. This permitted the ratio of horizontal data to be quantified and shown as horizontal transmissibility.
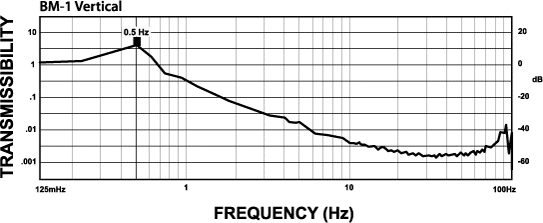
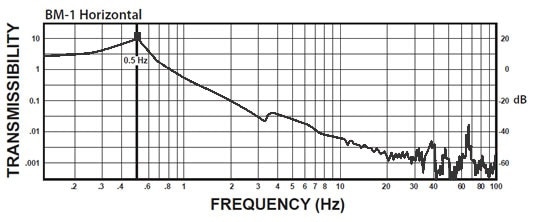
BM-1 Isolator
The below curve exhibits the typical vertical 1/2 Hz performance of the BM-1. Compared to typical high-performance air tables, it provides 10-100 times better performance.
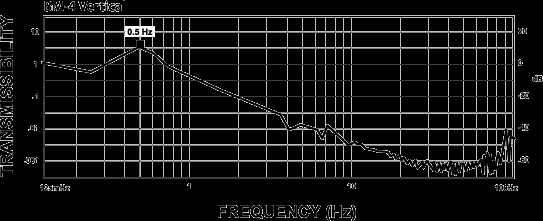
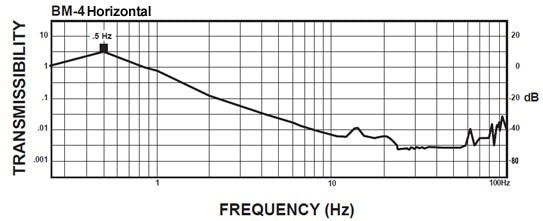
BM-4 Isolator
The below curve exhibits the typical vertical 1/2 Hz performance of the BM-4. Compared to typical high-performance air tables, it provides 10-100 times better performance.
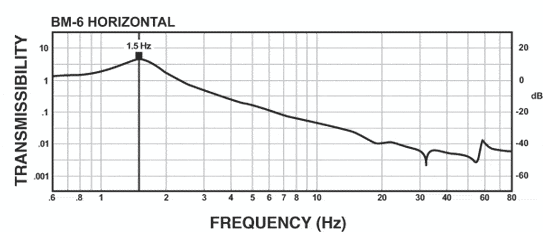
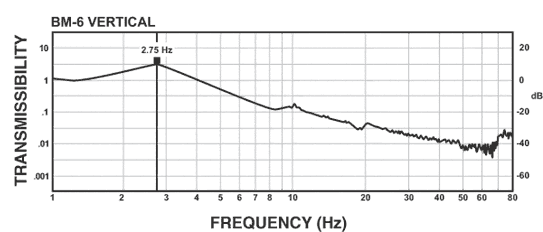
BM-6 Isolator
The curves below show the better-than-air performance delivered by the BM-6. Horizontally, the BM-6 provides much better performance than typical air tables, which can have horizontal frequencies as high as 4-5 Hz. Vertically, the BM-6 supplies a resonant frequency that is comparable to or better than most air tables.
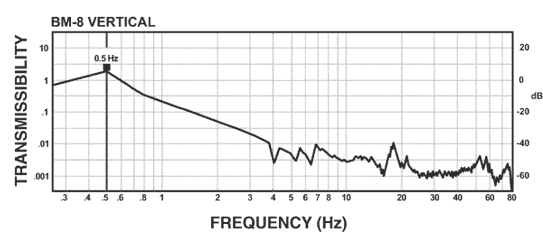
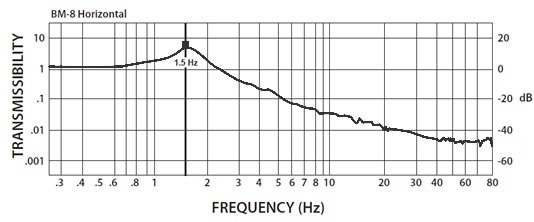
BM-8 Isolator
The below curve shows the vertical 1/2 Hz performance of the BM-8. The BM-8 delivers the high performance of Minus K’s larger isolators but in a package that is only 4.6 inches tall. The horizontal performance of the BM-8 is the same as that of the BM-6.
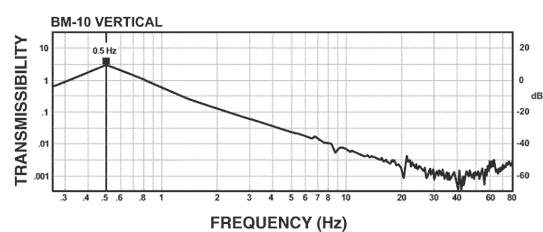
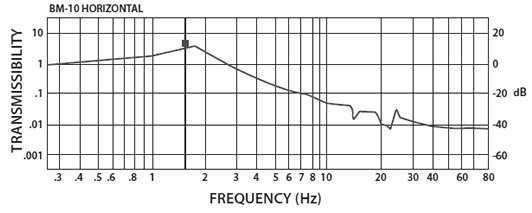
BM-10 Isolator
The below curve demonstrates the vertical 1/2 Hz performance of the BM-10. It provides performance that is 10-100 times better than an air table in a lot smaller package. The horizontal isolation performance of the BM-10 is the same as that of the BM-6.
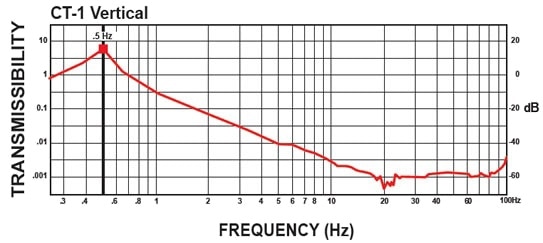
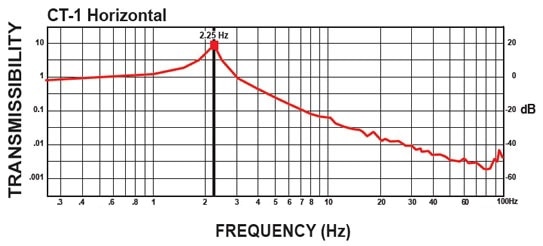
CT-1 Isolator
The below curves demonstrate the 1/2 Hz performance of the CT-1. It offers 10-100 times better performance than an air table.
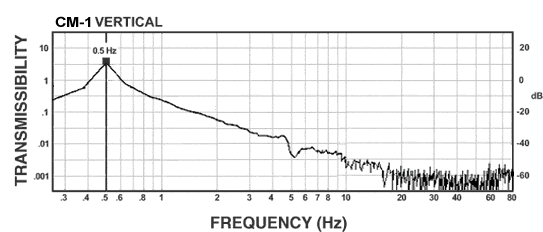
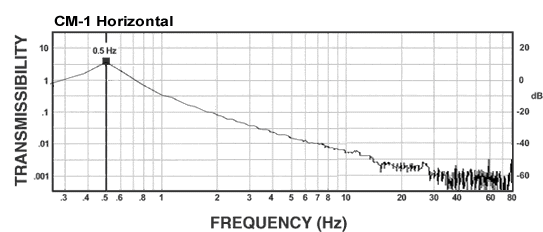
CM-1 Isolator
The curves below show the 1/2 Hz performance of the CM-1. Its performance is 10-100 times better than an air table.
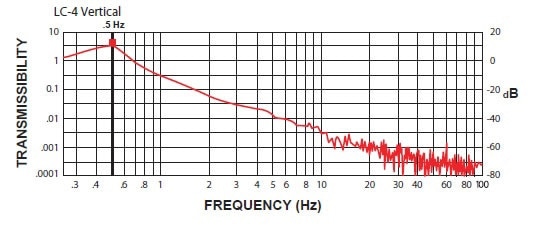
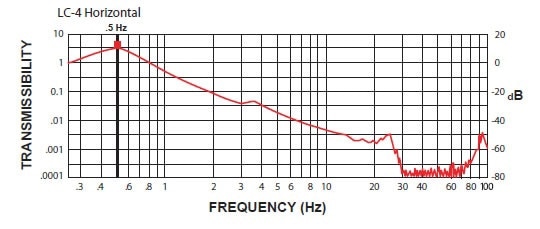
LC-4 Isolator
The below curves demonstrate the 1/2 Hz performance of the LC-4. It provides 10-100 times better performance than an air table.
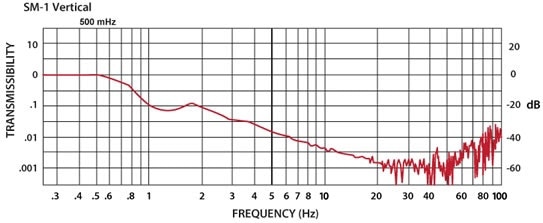
SM-1 Isolator
The 1/2 Hz performance of the SM-1 is shown in the curve below. (The curve below regarding 2 Hz is not valid. The curve was measured from ambient vibrations and they were too low to get valid results below around 2 Hz. The actual curve should be fairly similar to those of the other 0.5 Hz isolators.)
The ambient horizontal vibrations at the facility were too low to measure a valid horizontal transmissibility curve, but it is expected that the actual curve is quite similar to those of the other 0.5 Hz isolators.

This information has been sourced, reviewed and adapted from materials provided by Minus K Technology.
For more information on this source, please visit Minus K Technology.