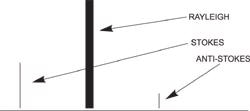
It is the shift in wavelength of the inelastically scattered radiation that provides the chemical and structural information. Raman shifted photons can be of either higher or lower energy, depending upon the vibrational state of the molecule under study. A simplified energy diagram that illustrates these concepts is shown on the right.
Simplified energy diagram
Stokes radiation occurs at lower energy (longer wavelength) than the Rayleigh radiation, and anti-Stokes radiation has greater energy.
The energy increase or decrease is related to the vibrational energy levels in the ground electronic state of the molecule, and as such, the observed Raman shift of the Stokes and anti-Stokes features are a direct measure of the vibrational energies of the molecule. A schematic Raman spectrum may appear as shown below.
The energy of the scattered radiation is less than the incident radiation for the Stokes line and the energy of the scattered radiation is more than the incident radiation for the anti-Stokes line.
The energy increase or decrease from the excitation is related to the vibrational energy spacing in the ground electronic state of the molecule and therefore the wavenumber of the Stokes and anti-Stokes lines are a direct measure of the vibrational energies of the molecule.
In the example spectrum, notice that the Stokes and anti-Stokes lines are equally displaced from the Rayleigh line. This occurs because in either case one vibrational quantum of energy is gained or lost.
Also, note that the anti-Stokes line is much less intense than the Stokes line. This occurs because only molecules that are vibrationally excited prior to irradiation can give rise to the anti-Stokes line. Hence, in Raman spectroscopy, only the more intense Stokes line is normally measured Raman scattering is a relatively weak process. The number of photons Raman scattered is quite small. However, there are several process which can be used to enhance the sensitivity of a Raman measurement.
Raman Techniques
Resonance Raman
If the wavelength of the exciting laser coincides with an electronic absorption of a molecule, the intensity of Raman- active vibrations associated with the absorbing chromophore are enhanced by a factor of 102 to 104.
This resonance enhancement or resonance Raman effect can be extremely useful, not just in significantly lowering the detection limits, but also in introducing electronic selectivity. Thus the resonance Raman technique is used for providing both structural and electronic insight into species of interest.
Metalloporphyrins, carotenoids and several other classes of biologically important molecules have strongly allowed electronic transitions in the visible, making them ideal candidates for resonance Raman spectroscopy. Resonance selectivity has a further practical use, in that spectrum of the chromophoric moiety is resonance enhanced and that of the surrounding environment is not. F
or biological chromophores, this means that absorbing active centres can be specifically probed by visible excitation wavelengths, and not the surrounding protein matrix (which would require UV lasers to bring into resonance).
Resonance Raman spectroscopy is also an important probe of the chemistry of metal centred complexes, fullerenes, polydiacetylenes and other "exotic" molecules which strongly absorb in the visible. Although many more molecules absorb in the ultraviolet, the high cost of lasers and optics for this spectral region have limited ultraviolet (UV) resonance Raman spectroscopy to a small number of specialist groups.
Schematic Raman spectrum
Vibrations which are resonantly enhanced fall into two or three general mechanistic classes. The most common case is Franck-Condon enhancement, in which a component of the normal coordinate of the vibration occurs in a direction in which the molecule expands during an electronic excitation.
The more the molecule expands along this axis when it absorbs light, the larger the enhancement factor. The easily visualized ring breathing (in-plane expansion) modes of porphyrins fall into this class.
Vibrations which couple two electronic excited states are also resonantly enhanced, through a mechanism called vibronic enhancement. In both cases, enhancement factors roughly follow the intensities of the absorption spectrum. The fuller theory of resonance enhancement is beyond the scope of this section.
Resonance enhancement does not begin at a sharply defined wavelength. In fact, enhancement of 5x to 10x is observed if the exciting laser is within even a few 100 wavenumbers below the electronic transition of a molecule. This "pre-resonance" enhancement can be experimentally useful.
Surface Enhanced Raman Scattering (SERS) Raman
The Raman scattering from a compound (or ion) adsorbed on or even within a few Angstroms of a structured metal surface can be 103 to 106x greater than in solution. This surface-enhanced Raman scattering is strongest on silver, but is observable on gold and copper as well. At practical excitation wavelengths, enhancement on other metals is unimportant.
SERS arises from two mechanisms:
- The first is an enhanced electromagnetic field produced at the surface of the metal. When the wavelength of the incident light is close to the plasma wavelength of the metal, conduction electrons in the metal surface are excited into an extended surface electronic excited state called a surface plasmon resonance. Molecules adsorbed or in close proximity to the surface experience an exceptionally large electromagnetic field. Vibrational modes normal to the surface are most strongly enhanced.
- The second mode of enhancement is by the formation of a charge-transfer complex between the surface and analyte molecule. The electronic transitions of many charge transfer complexes are in the visible, so that resonance enhancement occurs. Molecules with lone pair electrons or pi clouds show the strongest SERS. The effect was first discovered with pyridine. Other aromatic nitrogen or oxygen containing compounds, such as aromatic amines or phenols, are strongly SERS active.
The effect can also been seen with other electron-rich functionalities such as carboxylic acids.The intensity of the surface plasmon resonance is dependent on many factors including the wavelength of the incident light and the morphology of the metal surface.
The wavelength should match the plasma wavelength of the metal. This is about 382 nm for a 5µm silver particle, but can be as high as 600nm for larger ellipsoidal silver particles. The plasma wavelength is to the red of 650nm for copper and gold, the other two metals which show SERS at wavelengths in the 350-1000 nm region. The best morphology for surface plasmon resonance excitation is a small (<100nm) particle or an atomically rough surface.
SERS is commonly employed to study monolayers of materials adsorbed on metals, including electrodes. Other popular surfaces include colloids, metal films on dielectric substrates and, recently, arrays of metal particles bound to metal or dielectric colloids through short linkages.
Although SERS allows easy observation of Raman spectra from solution concentrations in the micromolar (10x-6) range, non- reproducability of quantitative measurements has in the past marred its utility for analytical purposes. However, standardization in production of SERS active media is steadily improving its potential in this area also.
Ultraviolet Resonance Raman Spectroscopy (UVRRS)
UVRRS is a powerful tool in the molecular analysis of complex biological systems. Most biological systems absorb UV radiation and hence have the ability to offer resonance with UV Raman excitation. This results in the highly selective resonance Raman effect enabling enhancement of important biological targets such as protein or DNA.
For example, excitation around 200nm enhances the Raman peaks from vibrations of amide groups; excitation around 220nm enhances peaks from certain aromatic residues. The Raman scatter from water is weak, allowing for analysis of very weak aqueous systems.
Due to the selective nature of UVRRS, a tunable laser is typically required as the excitation source. Since truly tunable continuous-wave lasers are not yet available, a Nd:YAG-pumped dye laser with frequency-doubled output is one suitable UVRRS system. Depending on the dyes used, this laser setup can give almost any required UV wavelength.
Intensified CCDs (ICCDs) with UV photocathodes, back-illuminated CCDs or CCDs with UV enhancing (BASF lumogen)coatings can be used as detectors for UVRRS. These detectors are used on account of their high detection efficiency and multichannel capabilities.
The primary obstacle to the merging of the worlds of UVRRS and fiber-optic spectroscopy is solarization, the process by which UV radiation causes opacity of fiber-optics (even quite pure silica fibers). This opacity impairs transmission, rendering standard fiber-optics useless for UVRRS.
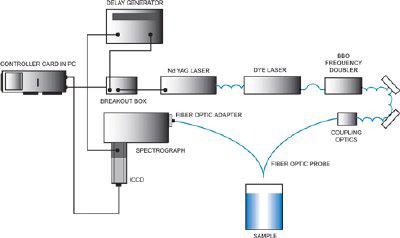
Fiber optic UVRRS configuration
Time-Resolved & Pulsed Raman
Vibrational Raman spectroscopy is now widely recognized as a useful technique for chemical analysis of stable species, since the technology which underpins Raman measurements has matured. Similarly, time-resolved Raman spectroscopy has also become established as an excellent method for the characterization of transient chemical species.
Many of the technical advances which have reduced the cost and increased the reliability of conventional Raman systems can also be exploited in studies of transient species.
Species of Interest
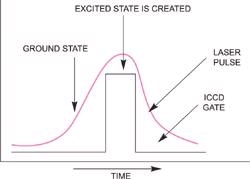
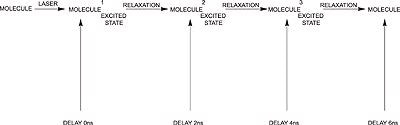
Pulsed lasers are typically utilized in the study of short-lived species. A laser pulse can be supplied to a molecular system with enough energy to redistribute the electrons in a molecule causing the formation of an excited state as illustrated on the right. The Raman spectrum of this excited state molecule can be studied either using the same laser pulse or a different pulse from a second laser (single color and two-color pulsed Raman).
Excited states of interest can have lifetimes, from picoseconds to milliseconds, but the majority can be studied using gating in the order of 5ns. As the majority of excited states are generated using UV and visible lasers, photocathodes with high UV and visible Quantum Efficiencies (QE's) are typically suitable.
Single Colour Raman Using an ICCD (Internal triggering or External triggering)
The simplest pulsed laser experiments are so-called single- color experiments where high irradiance laser pulses are used both to initiate the photoreaction, and then to Raman probe the transient species created within the pulse width.
By opening the intensifier tube as shown on the right, only the Raman spectrum of the excited state will be recorded. This pulse/ICCD gate combination will be repeated and accumulated hundreds to thousands of times in order to achieve a good overall signal-to-noise ratio with high dynamic range.
Schematic of basic pulsed excited state Raman
Two Color Raman Using an ICCD and Two Lasers (Internal Triggering or External Triggering)
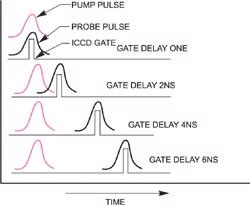
In Time Resolved Resonance Raman (TR3) spectroscopy, pairs of laser pulses of different wavelength are used to photolyse (optically "pump") and then to Raman probe the transient species of interest.
The spectral window of the spectrograph/detector is chosen so that it corresponds to the frequency range of the Raman scattering from the probe laser.
Schematic of pump-probe (two color) Raman
The time evolution of the transient signal is monitored by recording a series of spectra at different delays after the photolysis event, i.e. at a series of time delays between the excitation and probe pulses. The ICCD camera (Andor model DH720-18F-03 for instance) or either of the lasers can supply the trigger.
A delay generator is used to controls the delays.
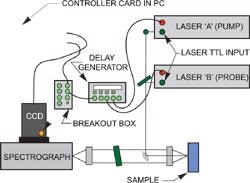
Pulsed two color Raman layout with delays under the control of a delay generator
Time delay sequences
Confocal Raman Microscopy
In Raman microscopy, a research grade optical microscope is coupled to the excitation laser and the spectrometer, thus producing a platform capable of obtaining both conventional images and in addition generating Raman Spectra from sample areas approaching the diffraction limit (~1 micron).
Imaging and spectroscopy can be combined to generate "Raman cubes", 3- dimensional data sets, yielding spectral information at every pixel of the 2D image. A motorized xyz microscope stage can be used to automatically record spectral files, which will constitute the basis of Raman images, Raman maps or a set of Raman spectra recorded from preselected points. Specific software routines will allow the quick and easy reconstruction of these maps.
The possibility of generating two-dimensional and three-dimensional images of a sample, using various special features, is an evident advantage over either traditional spectroscopy or microscopy.
RAMAN Instrumentation and Set-ups
The first ever Raman "instrument" was constructed in 1928. This instrument used monochromatized sunlight as a light source and a human eye as a detector. Raman instrumentation was developed (based around arc lamps and photographic plates) and soon became very popular up until the 1950's.
Since these early days, Raman instrumentation has evolved markedly. Modern instrumentation typically consists of a laser, Rayleigh filter, a few lenses, a spectrograph and a detector (typically a CCD or ICCD).
The Laser
One of the major advantages of dispersive Raman is that it offers the possibility to select the optimal laser excitation wavelength to permit the recording of the best Raman information. For example, wavelengths can be selected to offer the best resonance with the sample under investigation.
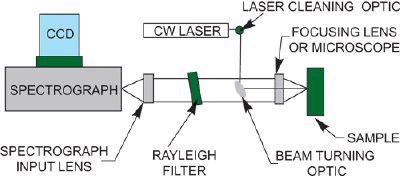
Typical Continuous Wave (CW) Raman layout
One might also need to tune wavelength to avoid fluorescence and thermal emission backgrounds. Nowadays, it is possible to use laser lines from UV, (down to 200nm) up to the infrared, (1.06µm Nd:YAG laser line), from microWatts up to several Watts.
Andor Solutions for Raman Spectrocopy
Detectors
Most of the current dispersive Raman set-ups are now equipped with multichannel two-dimensional CCD detectors. The main advantages of these detectors are the high quantum efficiency, the extremely low level of thermal noise (when effectively cooled), low read noise and the large spectral range available.
Many CCD chips exist, available in front and back-illuminated formats, but one of the most common spectroscopy sensor formats is the back-illuminated 1024 x 256 pixel array, containing 26 x 26 microns.An excellent compromise in the battle between cost and performance is an open electrode chip, like that in the Andor iDus model DU420A-OE.
Deep depletion chips have found use recently for improved NIR Raman detection, suitable for use with 785nm lasers. The fact that deep depletion sensors have higher dark current than more conventional sensors, means that it is particularly important to apply effective thermolectric (TE) cooling in these devices.
Other chips with smaller pixel sizes, for increasing the spectral resolution, are also available, for example, the Andor iDus DU440A, which uses a sensor: 2048 x 512 pixels of 13.5 x 13.5µm. One must always bear in mind however, the signal to noise implications of dispersing a spectrum over a greater number of smaller pixels.
Raman spectroscopists, when using CW lasers, often make us of long exposure times (1 sec to 20 minutes) in order to reach a desired signal to shot noise ratio, and in those instances a multi-MHz readout camera is not required.
However, there are many cases where shorter exposure times must be applied, such as when following fast reactions, temperature jump experiments, and also for Raman mapping with high throughput. In these instances, the read noise floor of the sensor can contribute significantly to the overall signal to noise ratio.
Also, there are many instances in which light levels are fundamentally or necessarily low, such as when studying photolabile molecules, or when the concentration of the probed species is low. Again, this can render the read noise floor more significant.
In these cases, we recommend use of the Andor NewtonEM EMCCD platform, which offers the choice between conventional readout at slower readout speeds, and single photon sensitivity at either slow or fast readout speeds through an EMCCD amplifier, all with the high QE offered by back-illumination of the sensor. Newton represents the absolute ultimate in spectroscopic detection performance, in terms of sensitivity, speed and also flexibility.
It has been shown that CCD quantum efficiency in the red end of the spectrum decreases with cooling, while QE in the blue increases. The flexibility of low temperature TE-cooling systems is one of the reasons why thermo electric cooling is significantly superior to liquid nitrogen cooling.
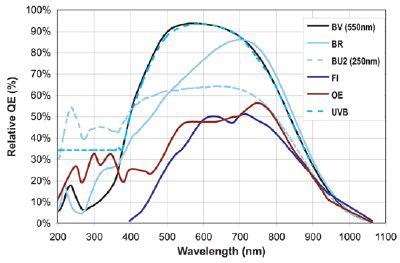
QE curves relevant to Raman Spectroscopy
Due to the fact that Raman requires a spectrograph, long and thin spectroscopic chips are typically used, (except when using an Echelle spectrograph). Since Raman is fundamentally a low light phenomenon, dark current is important and so imaging spectrographs and single track mode can be preferred. Using a small single track will also reduce the incidence of cosmic rays.
Spectrographs
The most widely used spectrograph configuration for Raman spectroscopy is the Czerny-Turner, such as in the Andor Shamrock 303i or the Shamrock 163i. The Czerny-Turner spectrograph makes use of mirrors as collimators in an off-axis configuration and employs a planar reflective grating in the collimated space, as illustrated on the right.
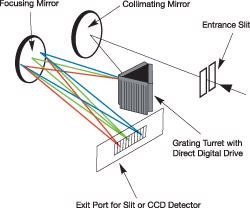
Example of Czerny-Turner layout
A concave holographic-grating spectrograph can also be used. This is a single element spectrograph. A reflective grating is formed on a curved focussing surface to yield an off-axis spectrograph.
The grating is typically a holographic surface relief pattern with a reflective overcoat. This is the simplest possible spectrograph design and, therefore, is very compact and inexpensive.
Andor Mechelle: the Echelle grating in the Mechelle Spectrograph is a very low-frequency reflective grating. The advantage of this type of spectrometer when compared to standard concave holographic or Czerny-Turner designs are as follows:
- No moving parts
- Wide spectral coverage and high resolution, simultaneously
- Large reduction in time when collecting a complete spectrum
- Compact, rugged design
- Improved imaging performance due to refractive optics
- Efficient coupling with fiber-optic devices due to fast refractive optics
Rayleigh Filters
Rayleigh scatter is elastically scattered light of the same wavelength as the laser and so is of no interest to the Raman spectroscopist. Rayleigh scatter is very intense (typically one million times stronger than Raman scatter) if this light is allowed to pass into the spectrograph, it will be so intense as to render it almost impossible to see any Raman spectrum at all.
For this reason Rayleigh scatter must be removed. There are two main techniques for the removal of this light:
- Rejection filters: dilectric filters, holographic notch filters & colored glass filters.
- Subtractive Double Spectrographs: a double spectrograph functioning in subtractive mode is often used as a Rayleigh filter. This is typically followed by a single dispersive spectrograph. A "triple" spectrograph is very light-hungry and has very poor throughput (~10%). It's advantage is that it is almost infinitely tunable.

This information has been sourced, reviewed and adapted from materials provided by Andor Technology Ltd.
For more information on this source, please visit Andor Technology Ltd.