Fluorescence microscopes and imaging systems make use of fluorescent biomarkers and fluorescence filter sets to produce bright and high-contrast images of biomolecules, organelles, cells, tissues, organs, and organ systems. Image quality is highly dependent on the design and the grade of performance seen in these fluorescence filters that are integrated into fluorescence microscopes. As a result, the performance of optical filters is just as important in creating a high-quality final image as the preparation of the sample and the selection of the fluorophores.
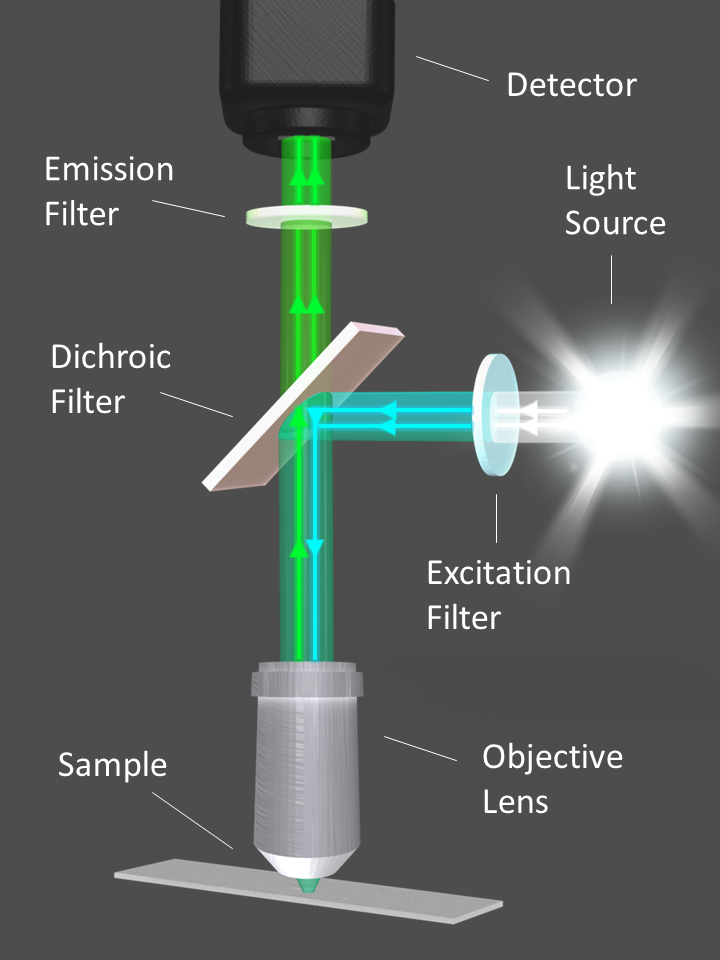
Figure 1. Diagram illustrating the optical filters and light path of a fluorescence microscope. Image Credit: Alluxa
Fluorescence
When a photon of light at a specific wavelength is absorbed by an atom or molecule, an orbital electron jumps from its ground state (S0) to an excited singlet state (S1). As the electron returns to its ground state, a lower-energy photon is emitted. Therefore, there is a longer wavelength than the photon that was initially absorbed (Figure 2). This phenomenon is known as fluorescence, it is the key concept behind a large variety of instruments used in biological science and medicine.
Fluorescence microscopes, imaging systems, flow cytometers, and DNA sequencers all use a light source, whether that is a laser, LED, or broadband lamp, in order to excite the fluorescent tags within a sample. Fluorescence filters isolate and direct the excitation signal towards the sample; they also direct the emission signal towards the detector or eyepiece (Figure 1).
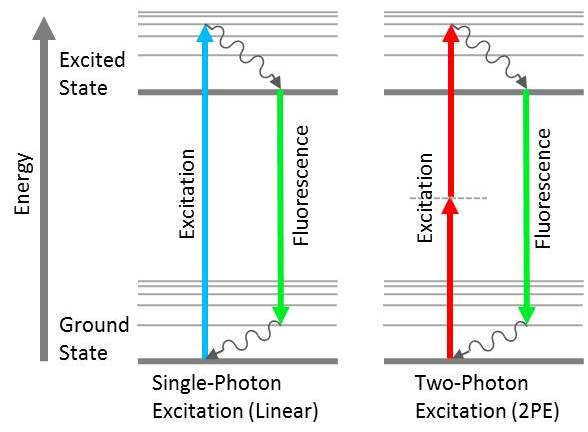
Figure 2. Jablonski diagrams showing the difference between linear fluorescence (left) and two-photon excitation (right). Image Credit: Alluxa
Sometimes, multiple longwave photons can be absorbed at the same time by a single atom or molecule. This results in an emitted photon possessing higher energy and a shorter wavelength than the photons that were initially absorbed (Figure 2). This non-linear fluorescence response has found application in two-photon and multi-photon fluorescence microscopy systems. However, there are other processes by which an electron in an excited state can return to the ground state. The processes, such as fluorescence resonance energy transfer (FRET) and stimulated emission depletion (STED), are used in microscopy.
Fluorescent Labels
Fluorophores, also called fluorochromes, are generally present in samples that have been studied with fluorescence. Samples can also be labeled with fluorophores. Fluorophores emit a relatively strong emission signal due to their aromatic chemical structures. Every fluorophore has a unique absorption or excitation spectrum as well as a unique emission spectrum, and they all peak in energy or intensity at a specific wavelength to them. The name Stokes shift (Figure 3) is given to the difference in wavelength between the peak absorption and peak emission of a fluorophore, and this difference can go from just a few nanometers to several hundred.
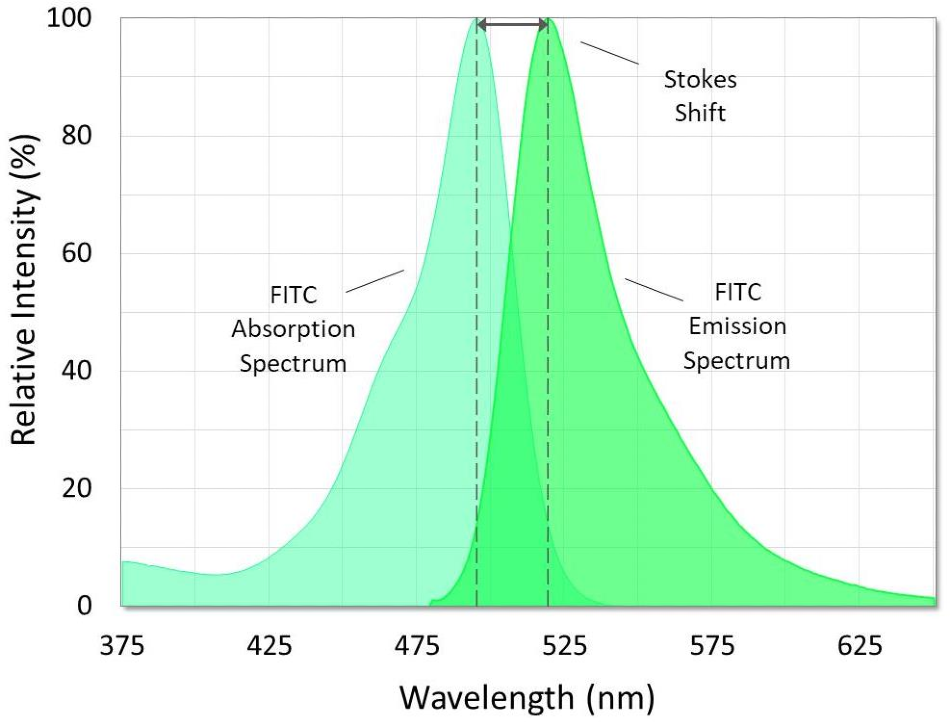
Figure 3. Absorption and emission spectra of fluorescein isothiocyanate (FITC). The Stokes shift is the difference between the spectral peaks. Image Credit: Alluxa
Fluorescent labels can come in a wide range of fluorescent proteins, probes, dyes, and other fluorophores. All of these alternatives will have a different excitation and emission spectra and a different Stokes shift. They will also all be different in terms of their brightness, maturation time, and photostability.
Their emission intensity will depend on the wavelength of light that is absorbed by the fluorophore. Light corresponding to the peak absorption will encourage the maximum emission intensity, but light at wavelengths farther from the absorption peak will generate an emission signal with a lower-intensity. Emission signal strength will also differ depending on the concentration of tagged molecules. For example, some fluorescence systems have been designed to detect the emission signal from a single molecule.
Fluorescence Filter Sets
Three types of optical filters are needed for epi-fluorescence and other standard fluorescence microscopes to function properly. These types include:
- An excitation filter
- An emission filter
- A dichroic beamsplitter (Figures 1 and 4)
Excitation and emission filters are bandpass filters that transmit a wavelength range that corresponds to the respective fluorophore absorption or emission spectrum, while also blocking extraneous light on either side. If a user is more concerned with the brightness of an image of its contrast, emission filters can also be longpass edge filters that transmit longer wavelengths instead of blocking them.
The majority of dichroic beamsplitters are longpass filters, and they have been designed to be used at a 45° angle of incidence (AOI). Dichroic filters direct the filtered excitation light towards the sample and the emission light from the sample through the emission filter to the detector (Figure 1).
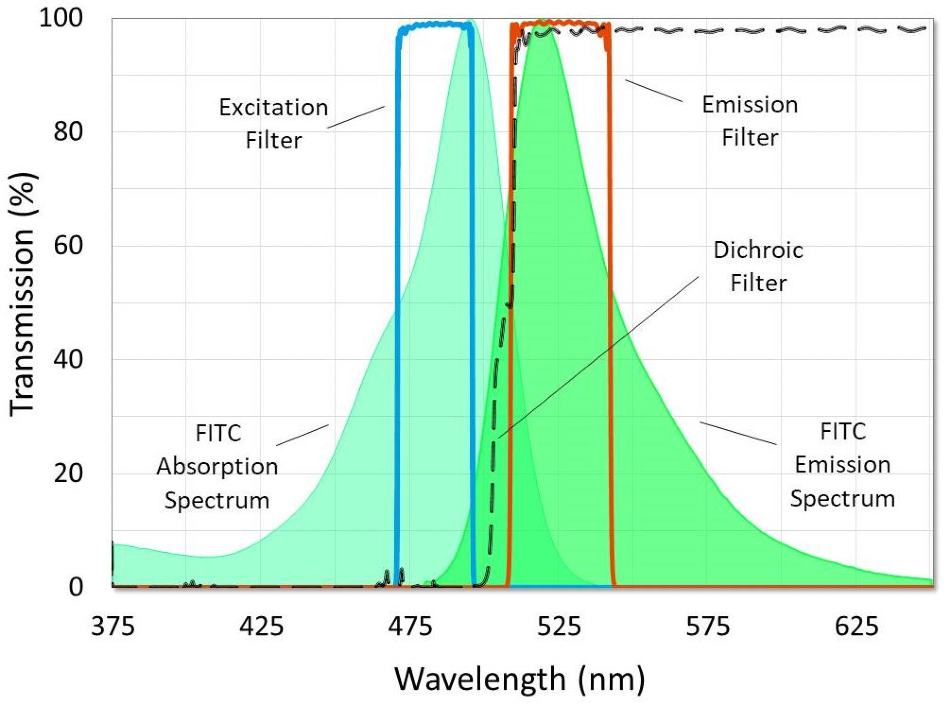
Figure 4. A fluorescence filter set designed for use with FITC. Image Credit: Alluxa
Fluorescence filter sets can be either single or multi-banded. They can also be made in multiple other configurations, with the most common configuration being fluorescence filter cubes and filter wheels. Single band filter sets can be used to view samples that have been tagged with one or more fluorophores by taking a series of images with each respective filter cube to then create a final composite image.
Pinkel or Sedat filter wheel configurations can also be used to fulfill this purpose. Pinkel filter sets comprise a multi-band emission filter and a polychroic filter, which are used in conjunction with several single-band excitation filters. Sedat filter sets are made up of a polychroic filter, which is used in conjunction with several single-band excitation and emission filters.
Full-multiband filter sets that consist of a multi-band excitation filter, a multi-band emission filter, and a polychroic filter, can also be used to generate a single image that contains all of the fluorescent tags.
Fluorescence Filter Set Requirements
To construct a fluorescence filter set that generates a high-quality, high-contrast image with a black background, excitation and emission filters should achieve high transmission with minimal passband ripple over the regions that correspond to the fluorophore excitation peaks or emissions. Their respective passbands also need to be separated so that overlap does not occur above a level of OD7 (-70 dB or 0.00001% transmission) (Figure 5). However, a crossover of OD6 (-60 dB or 0.0001% transmission) or OD5 (-50 dB or 0.001% transmission) is acceptable when using a fluorophore with a very short Stokes shift, as is also the case with certain multiband filter sets.
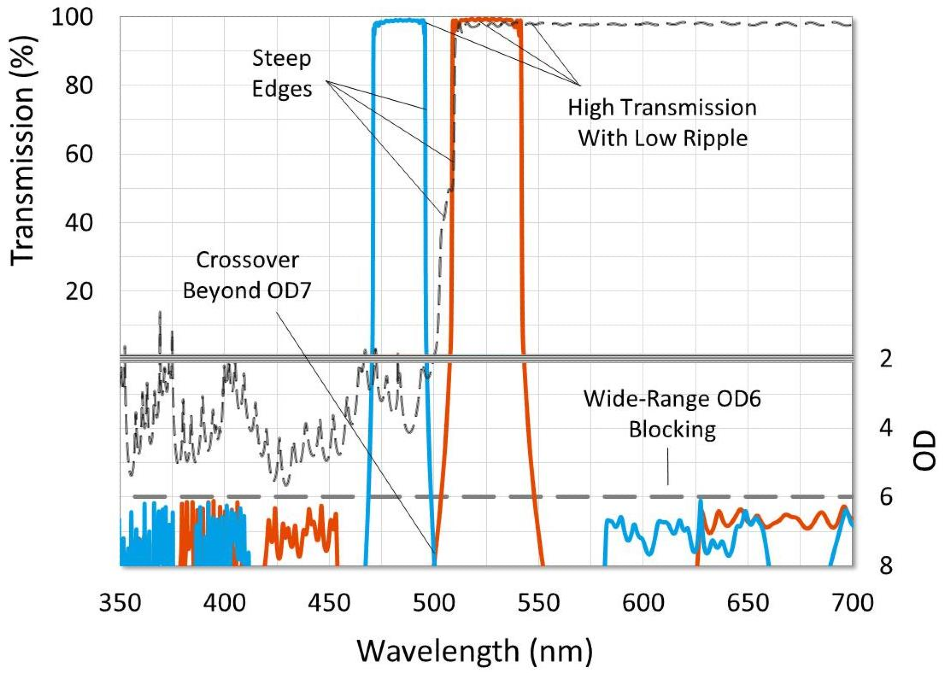
Figure 5. Graph of a high-performance fluorescence filter set. Characteristics designed to give high contrast and a black background and are highlighted. Image Credit: Alluxa
In order to achieve an OD7 crossover, fluorescence filters should be specified and designed as a set. It is also important to design excitation and emission filters with steep edges that transition from OD6 blocking to over 90% transmission in just a few nanometers, so that the passbands capture the respective fluorophore peaks.
The majority of fluorescence filter sets are designed so that the excitation and emission filter theory traces cross beyond OD7 to account for manufacturing tolerance. It is possible for the measured spectra of coated filters to deviate from theory, so it is crucial to specify these filters so that they can ensure appropriate crossovers are met. Examples of this would be specifying a relatively tight center wavelength tolerance, or specifying absolute transmission or blocking ranges instead of average.
To generate images that feature a black background, the design of the excitation and emission filters should block out any extraneous light. This can be achieved by specifying wide-range, out-of-band blocking ranges at a level of OD6 or more. Systems that use broadband light sources need blocking ranges that go from ~300 nm to ~1100 nm out-of-band. Switchable LED light sources need out-of-band blocking from ~300 nm to ~850 nm.
Emission filters for laser systems need at least OD6 absolute blocking at the laser line, but out-of-band blocking ranges can be similar to the emission filters used for LED light sources. If a user is not concerned about ambient light, excitation filters appropriate for laser systems may not always necessitate wide-range blocking over the passband of the emission filter.
It is also necessary to have dichroic filters to get a relatively steep transition between reflection and transmission bands, so the cut-on edge is placed between the passbands of the excitation and emission filters. Furthering this, all filters that transmit light to the detector or eyepiece need to be specified with low transmitted wavefront error (TWE) to circumvent distortion in the image.
Dichroic Flatness
The surface flatness of the dichroic beamsplitter is a feature that should be taken into account when choosing a fluorescence filter set intended for laser, imaging, total internal reflection fluorescence (TIRF), and super resolution systems. When a thin-film coating is deposited onto a substrate, the stress of the coating leads to the substrate bending, which results in a bowl- or dome-shaped curvature (Figure 6). This curvature, induced by the stress of the coating, can cause increases in the reflected wavefront error (RWE). This can lead to focal shifts and a reduction in spot size in these systems. To avoid these risks, in particular distortion, a low-stress coating (Figure 7) or backside compensation should be used.
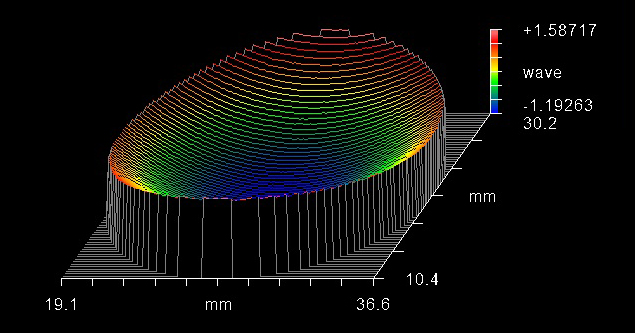
Figure 6. Interferogram showing the curvature caused by coating stress that can result in image distortion. Image Credit: Alluxa
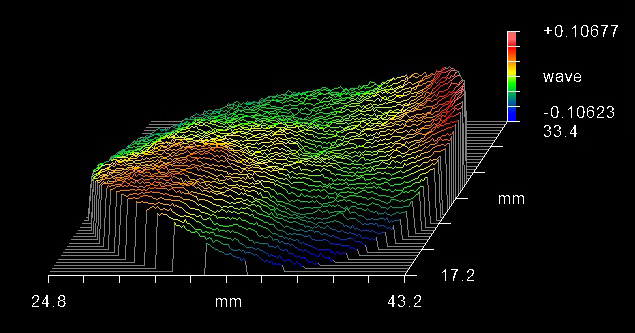
Figure 7. Interferogram showing a flat dichroic filter with low coating stress. Image Credit: Alluxa
Challenging surface flatness specifications are generally not necessary for standard widefield epi-fluorescence microscopes that are built with broadband lamp or LED light sources. Many of these systems are set up so that the dichroic transmits the emission light to the detector. As a result, TWE must be controlled, but it should be noted that the flatness of the surface is not likely to affect the quality of the final image.
Zero Pixel Shift
Fluorescence filters should be specified to produce zero pixel shift when they are used in any configuration that means the filters will be switched out to image multiple fluorophores within one sample. These particular configurations include single-band filter sets, Pinkel sets, and Sedat sets. The emission filters and dichroic filters included in these configurations should all come from one manufacturer and be specified with a high degree of parallelism. This is so that the user can minimize deviation of the beam, which can be caused by a wedge angle.
Most filters are not perfectly parallel, and coating stress will also encourage the beam to deviate to some degree, as well as pixel shifts also occurring in the time between image captures before and after the optical filters are introduced. However, when comparing images that have been captured with zero pixel shift, sets, which have been designed to work together, the user should not experience a shift of less than approximately ±1 pixel.
Minimizing Fluorophore Crosstalk
It is essential to minimize crosstalk between fluorophores when using multi-band and Pinkel sets to capture images of samples that have been tagged with multiple fluorophores. It is also important to minimize crosstalk for fluorescent in-situ hybridization (FISH), FRET, and flow cytometry applications.
Crosstalk, which is also termed bleed-through, happens when the excitation and emission signals of one fluorophore are transmitted through the filter channel that is reserved for a different fluorophore. This leads to colors blending in a single location, mimicking the effect of co-localization.
Although a certain degree of crosstalk should be expected, it is nevertheless important to choose fluorophores and filter sets that keep crosstalk levels to a minimum. Users can achieve this by avoiding fluorophore combinations that have a large amount of overlap between their emission spectra. Users should also avoid overlap between absorption spectra in instances where each fluorophore is excited by a different light LED or laser. Regardless of fluorophore selection, excitation and emission filters should be designed with relatively narrow passbands that are able to capture the peak excitation or emission of the target fluorophore and block as much overlap as possible (Figure 8).
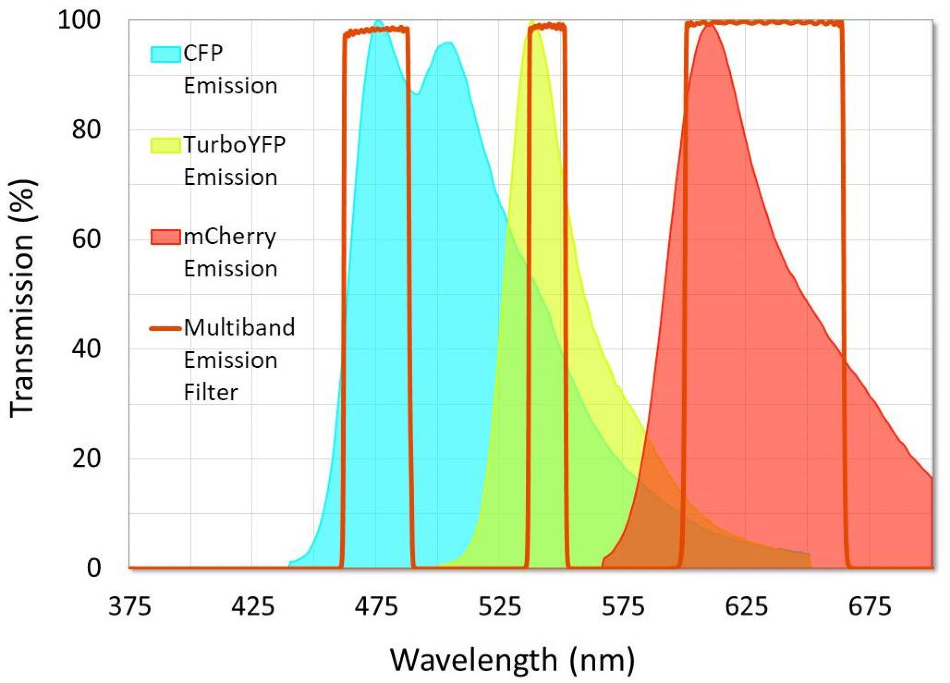
Figure 8. Example of a multiband emission filter that was designed to minimize crosstalk between fluorophores. Note that crosstalk in the second channel is unavoidable because of the emission spectra overlap between CFP and TurboYFP. Image Credit: Alluxa
Minimizing GDD
Non-linear optical (NLO) systems that use a pulsed femtosecond laser for excitation need optics that control phase shift and group delay dispersion (GDD). In these particular instruments, the pulsed beam is transmitted through or reflected off of several different optical components before it reaches the sample.
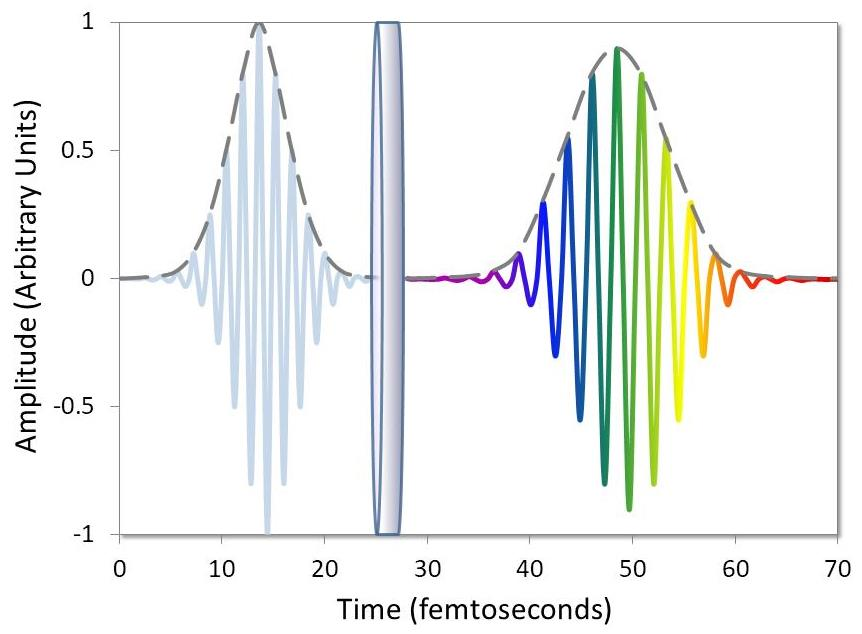
Figure 9. Diagram illustrating the effect of group delay dispersion (GDD). Image Credit: Alluxa
The peak pulse intensity will decrease if these optical filters and mirrors are not specifically designed for use with femtosecond lasers, because of group delay disperation every time the pulse train is reflected or transmitted (Figure 9). As a reduction in peak pulse intensity will in turn reduce the number of NLO signals, this compounded effect will lead to poor instrument performance overall.
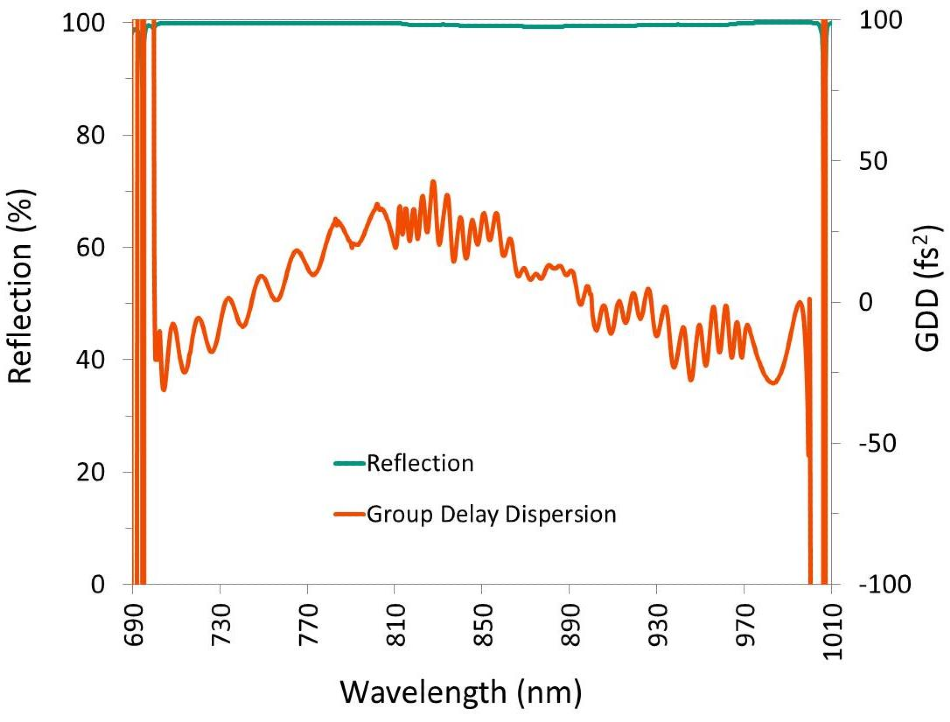
Figure 10. A high-reflectivity mirror designed to control GDD over a large wavelength range. Image Credit: Alluxa
Alluxa’s Fluorescence Filters
All of Alluxa’s fluorescence filters are hard-coated using an innovative SIRRUS plasma deposition process, which enables Alluxa to create high-performance excitation, emission, and dichroic filters that boast steep edges and transmission that is typically greater than 95%. In addition to this, Alluxa’s fluorescence filters feature precision wavelength control, deep blocking, and low TWE, which are also specified to produce zero pixel shift.
Our dichroic beamsplitters for laser, imaging, TIRF, and super resolution applications can achieve flatness levels of λ/2 P-V per inch or more on 1.05 mm thick substrates, and levels of λ/10 P-V per inch or more on thicker substrates. Alluxa also offers high-reflectivity mirrors and dichroic filters that effectively control GDD over a wide range of wavelengths.
Whether users are designing an OEM fluorescence system or they are looking for a filter cube, Alluxa’s knowledgeable engineers will work closely with them to design the fluorescence filters that best fit their specific requirements.

This information has been sourced, reviewed and adapted from materials provided by Alluxa.
For more information on this source, please visit Alluxa.