Silicon Wafer Brillouin Spectroscopy

Figure 1 illustrates the Brillouin spectrum of a silicon wafer, obtained by using a camera cooled only at -5 °C, restricting the exposure time to ten seconds due to the dark current. The spectrum was averaged fifty times (thus accruing the noise associated with fifty read-out events).

a) Brillouin frequency shift spectrum of a silicon wafer, acquired with a camera cooled only at -5°C. b) Raw sensor image. The exposure time was set to 10 seconds and the number of averages to 50.

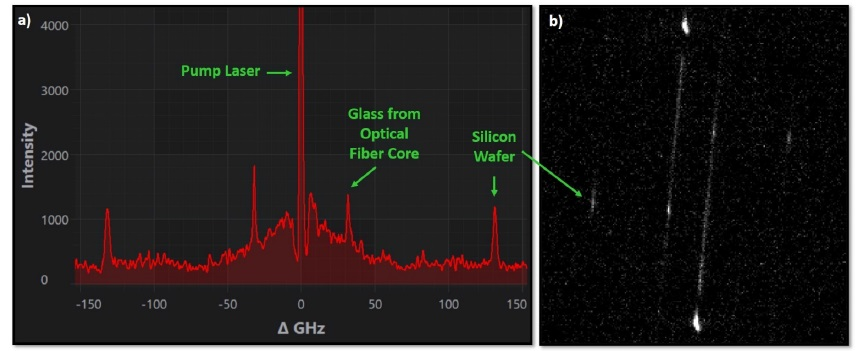
Figure 1. a) Brillouin frequency shift spectrum of a silicon wafer, acquired with a camera cooled only at -5 °C. b) Raw sensor image. The exposure time was set to 10 seconds and the number of averages to 50. Image Credit: LightMachinery  

In future work, a deeper cooled camera will be employed in order to enable lengthier exposure time, which will lead to a much greater signal-to-noise ratio with just a few minutes of complete exposure. Even with a short exposure time, the spectrum in Figure 1 displays the system’s immense potential.

The measured Brillouin frequency shift of the silicon wafer is 131.46 ± 0.07 GHz, in agreement with the anticipated shift. The pump laser signal is vastly attenuated (>70 dB) by the two “Pump Killers” utilized by the system.

Specifications

Source: LightMachinery

Sample System
  • The expected Brillouin frequency shift of silicon is around 131.6 GHz (using a longitudinal speed of sound in silicon of 8433 m/s, a refractive index of 4.151, and a pump wavelength of 532.2 nm)
  • Material: single crystal silicon wafer
  • Power at sample: 25 mW
  • Pump wavelength: 532.2 nm
  • Excitation/collection with 20X objective
  • Repeatability of Brillouin shift: highly sample and exposure dependent; <10 MHz is possible
  • FWHM of the instrument response: nominal 0.9 GHz


This information has been sourced, reviewed and adapted from materials provided by LightMachinery.

For more information on this source, please visit LightMachinery.

Citations

Please use one of the following formats to cite this article in your essay, paper or report:

  • APA

    LightMachinery. (2023, April 05). Silicon Wafer Brillouin Spectroscopy. AZoOptics. Retrieved on April 25, 2024 from https://www.azooptics.com/Article.aspx?ArticleID=1819.

  • MLA

    LightMachinery. "Silicon Wafer Brillouin Spectroscopy". AZoOptics. 25 April 2024. <https://www.azooptics.com/Article.aspx?ArticleID=1819>.

  • Chicago

    LightMachinery. "Silicon Wafer Brillouin Spectroscopy". AZoOptics. https://www.azooptics.com/Article.aspx?ArticleID=1819. (accessed April 25, 2024).

  • Harvard

    LightMachinery. 2023. Silicon Wafer Brillouin Spectroscopy. AZoOptics, viewed 25 April 2024, https://www.azooptics.com/Article.aspx?ArticleID=1819.

Comments

  1. Qurat-Ul-Ain Qurat-Ul-Ain Sweden says:

    Do you see any peaks/frequency shifts from backscattered-light optics in this Brillouin spectrum? Also, what is the material of the "Glass from Optical Fiber Core" in your spectrum?

The opinions expressed here are the views of the writer and do not necessarily reflect the views and opinions of AZoOptics.com.

Ask A Question

Do you have a question you'd like to ask regarding this article?

Leave your feedback
Your comment type
Submit

While we only use edited and approved content for Azthena answers, it may on occasions provide incorrect responses. Please confirm any data provided with the related suppliers or authors. We do not provide medical advice, if you search for medical information you must always consult a medical professional before acting on any information provided.

Your questions, but not your email details will be shared with OpenAI and retained for 30 days in accordance with their privacy principles.

Please do not ask questions that use sensitive or confidential information.

Read the full Terms & Conditions.