Nonlinear optical pump-probe microscopy is a new area for high resolution 3D imaging in modern microscopy. The imaging contrast relies upon the characteristic spectroscopic properties of specific molecules, for example their specific internal energy level structure.
This spectroscopic fingerprint is selectively probed by nonlinear light-matter interactions and this yields an image that shows the spatial distribution of the targeted molecule. The stimulated energy transitions can either be vibrational resonances of molecular bonds in the infrared ranged or molecular electronic transitions in the visible range, depending on the method.
A typical image of 512 by 512 pixels will cover an area of 100 by 100 mm. In order to obtain high resolution 3D images, they are consecutively recorded at distant focal planes with a typical vertical spacing of 1 mm.
Stimulation and readout of the nonlinear interactions are achieved by at least two pulses of well-defined properties: a pump and a probe pulse. This is different to other nonlinear optical imaging methods like fluorescence and incoherent Raman microscopy. Suppressing incoherent processes such as spontaneous emission is one of the main advantages of this stimulated readout.
The combination of high excitation laser power and sensitive detection results in an efficient overall yield of the nonlinear interaction. This enables images to be acquired quickly. The short laser exposure time reduces the photo damage on the sample caused by the high powered laser. Particular marker molecules are not needed for sample preparation as they are in fluorescence imaging.
One of the key goals of current research is reducing the time it takes to acquire an image. This is often directly related to detection sensitivity. With a modern scanning microscope, acquisition times of up to 30 fps are possible for a 512 by 512 pixel image1. These acquisition times enable rapid 3D imaging. However, it is possible to analyze dynamics in complex biosystems on a microscopic scale by recording 2D images at video-rates.
Nonlinear optical pump-probe microscopy is a potential technique for non-invasive imaging in biomedicine due to its ability to perform 3D imaging within tissues. This would provide complementary data to the fluorescence and magnetic resonance imaging techniques that are currently applied.
Table 1. Example wavelengths as used in2 for C-D and C-H bond vibration.
| Vibration |
C-H bond |
C-D bond |
| Ω |
2875 cm-1 |
2100 cm-1 |
| λP |
830 nm |
830 nm |
| λS |
1090 nm |
1005 nm |
| λA |
670 nm |
707 nm |
Coherent Raman Microscopy
Coherent Raman microscopy utilizes the vibrational fingerprint for molecule-selective imaging. This article discusses stimulated Raman scattering (SRS) and coherent anti-Stokes Raman scattering (CARS).
The corresponding multi-photon processes for SRS and CARS are shown in Figure 1. These techniques both involve coherent excitation of molecule vibrations. This is achieved by simultaneously applying near-infrared Stokes and visible pump pulses with a resonant frequency difference W. In order to trigger these multi-photon processes, the Stokes and pump pulses need to be synchronized in time and to obey a well-established phase relationship.
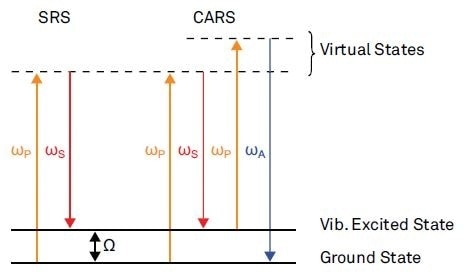
Figure 1. Nonlinear optical pump-probe microscopy is a new field for 3D high resolution imaging in modern microscopy.
SRS probes the vibrational excited states by working out the energy exchange between the laser field and the molecule caused by the nonlinear interaction. This energy exchange manifests in an intensity loss in the probe pulse (stimulated Raman loss) and an intensity gain in the Stokes pulse (stimulated Raman gain).
The nonlinear interaction is continually turned off and on, using intensity modulation of the Stokes pulses for measurements. The stimulated Raman loss on the pump pulses appears modulated. This loss can be determined with a lock-in amplifier, a technique known as modulation transfer, and this enables rapid imaging. An example of this is the video-rate in-vivo SRS imaging shown by Saar et al3.
Modulation transfer in SRS microscopy could also be used to modulate the pump pulse and detect the stimulated Raman gain on the Stokes pulse.
By monitoring the stimulated anti-Stokes emission, CARS probes the excited vibrational resonances. However, the weak background contribution to the anti-Stokes emission that is not related to any vibrational resonances limits the sensitivity of direct detection of the anti-Stokes emission. Two different lock-in schemes for background free CARS imaging with high sensitivity are mentioned in a review by Day et al4.
Ganikanov et al5 initially implemented the first lock-in technique – frequency modulated CARS (FM-CARS). The vibrational resonance frequency W is modulated by the frequency modulation of the pump pulses. The demodulated anti-Stokes signal represents the frequency derivative of the anti-Stoke emission at the excitation frequency. Therefore, due to its flat frequency response, the background contribution is rejected.
Potma et al6 were the first to implement the second lock-in technique – interferometric CARS. There is an interface between the anti-Stokes emission of the imaging specimen and the phase-modulated local oscillator pulses at the anti-Stokes frequency.
Due to the quadrate phase relation between the background and the resonant anti-Stokes contribution, a background-free vibrational absorption signal is achieved by correctly adjusting the local oscillators optical phase. According to recent experiments by Jurna et al7, the phase of the vibrational response is fully resolved for chemical selectivity amongst overlapping resonances from multiple molecular bonds.
Nonlinear Absorption Microscopy
The imaging contrast in nonlinear absorption microscopy is based upon characteristic molecular electronic transitions. In the modulation transfer technique, the nonlinear interaction is detected by the exchange of energy between the molecule and the laser field. A number of examples for imaging are given in a recent review by Min et al8. The absorption process for two of these is shown in Figure 2.
Figure 2a shows a process called two photon absorption (TPA). This is the absorption of two photons by passing a virtual state, provided that the sum of their frequency matches an excited state.
The excitation pulses must obey a well-established phase relationship and be synchronized in time. TPA can also be detected when the wavelength of the two photons is the same, so long as both interacting photons are modulated for intensity. Ye et al9 explain that the nonlinear absorption process leads to a response at double the modulation frequency.
A potential process occurring in transient absorption (TA) imaging is shown in Figure 2b. A femtosecond time delay is introduced between the pump and the probe pulses and both laser frequencies are tuned to an electronic transition.
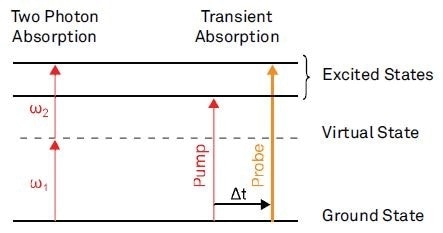
Figure 2. Examples for nonlinear absorption processes.
The transient absorption is then the absorption of the probe pulse due to the preceding pump pulse. For the configuration depicted in Figure 2b, ground-state electrons are excited by the pump pulse.
The probe pulse can see a ground-state population, smaller than that without the pump pulse, when the electrons are in the excited state. Therefore, the absorption of the probe pulse is less in the presence of the pump than when the pump is absent.
By altering the delay between the pulses, it is possible to interrogate the decay dynamics of the excited state. This technique is applied in pump-probe spectroscopy in order to probe femtosecond electron dynamics.
Example Experiments
Stimulated Raman Scattering Microscopy
Mikhail Slipchenko and Delong Zhang from the group of Ji-Xin Chengs at Purdue University built an SRS imaging setup2. The parts relevant to modulation transfer SRS experiments and their interconnections are shown in Figure 3.
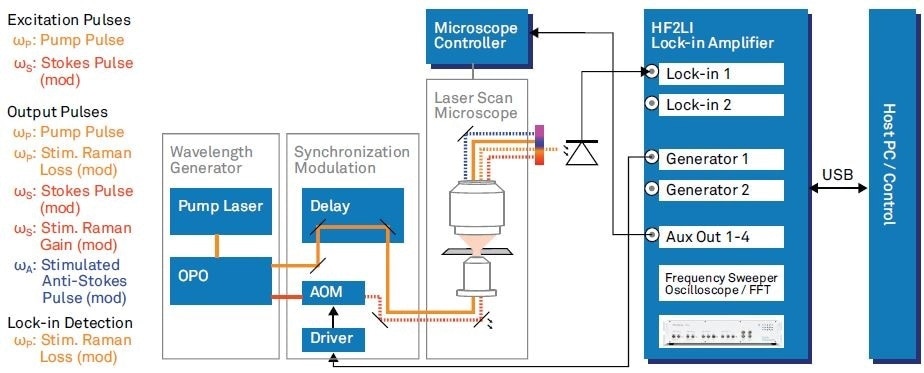
Figure 3. SRS microscope as used by Zhang et al2 with parts related to backward fluorescence imaging omitted. The list on the left hand side mentions all the involved optical frequencies. Wavelength Generation: pump pulses generated with a femtosecond pump laser (repetition rate 80 MHz). Tunable pump (680 - 080 nm) and Stokes (1000 - 1600 nm) are provided by an optical parametric oscilla tor (OPO). Synchronization, Modulation: time synchronization of the pulse trains with a delay stage and intensity modulation at 5.4 MHz with an acousto optic modulator (AOM). Modulation carrier from HF2LI fed to driver. Laser Scan Microscope: microscope with laser steering controlled by the Microscope controller.
The two tunable excitation pulses (pump and Stokes) are provided by an optical parametric oscillator (OPO) pumped by a femtosecond Ti:Sapphire laser oscillator. An acousto-optic modulator (AOM) is subsequently used to modulate the intensity of the Stokes pulses at 5.4 MHz. The Stokes pulses that result are then temporally and spatially overlapped with the pump pulses. The 5.4 MHz reference carrier is provided by the lock-in amplifier.
To focus the excitation beams into the sample, a high numerical aperture objective is used. Another microscope objective is used in order to collect both the CARS and SRS signals generated from the sample in the forward direction.
The pump pulses are optically filtered from the output pulses and then measured by a photodiode and demodulated by the HF2LI in order to measure the stimulated Raman loss. The demodulated signal is transmitted, via the HF2LI’s auxiliary output, to the microscope controller.
The application of femtosecond laser pulses instead of the widely used picosecond pulses is another innovative feature of the microscope2. Due to an increased excitation bandwidth of shorter pulses, the femtosecond laser pulses are able to better excite isolated vibrational resonances.
Due to the higher peak power of the femtosecond laser pulses, photodamage on biological samples is an important issue. This was addressed by balancing the excitation power to the near-infrared Stokes pulses (40 mW). At this level, possible photodamage is relatively smaller than that of visible pump pulses (10 mW). Images are also collected with high-sensitivity and at high-speed. The exposure time to the laser of one sample pixel, the pixel dwell time, is still below 4 ms.
One of the focus areas of this study was the synthesis of lipid droplets (LD) consisting of fatty acids (FA) for energy storage within cells. This had been previously studied by Slipchenko et al10 using Raman microscopy. Imaging C-H bonds at a Raman shift of 2875 cm-1 determines LDs synthesized from endogenous glucose present within the cell.
In order to enable SRS imaging to differentiate between endogenous and exogenous FA within LD, deuterated exogenous FA was added which has a characteristic response from C-D bonds at a Raman shift of 2100 cm-1. Figure 4 demonstrates this principle.
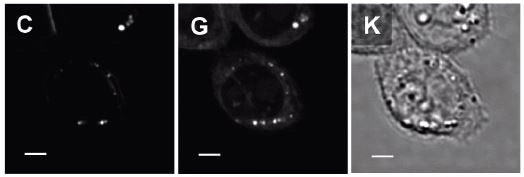
Figure 4. Adapted with permission from2. Copyright 2011 American Chemical Society. The figure shows SRS and transmission images of CHO cells incubated for 7 hours in the cell culture medium supplemented with 100 µM deuterated palmitic acid (exogenous FA with C-D vibration). Figure 4C shows an SRS image of the C-D vibration and indicates the presence of exogenous FA in LD and cell membranes. Figure 4G shows an SRS image at the C-H vibration of the same cells and shows the distribution of endogenous FA in cells. Notably, the location of LD in 4C and 4G indicates that even when cells are supplemented with exogenous FA, intra-cellular LD contain both endogenous and exogenous FA. This suggests that the cell still synthesizes endogenous FA to facilitate the LD formation. The transmission image in Figure 4K lacks any chemical information found in the SRS images. Scale bar: 5 µm.
3D SRS Images of anesthetized C. elegans worm were also collected at the C-H vibration in this study. A 3D map of the LD distribution within the worm is created from these images. In total, 50 frames at different elevations are acquired with 512 by 512 pixels and with a pixel dwell time of 2 ms.
Transient Absorption Microscopy
A nonlinear microscope able to perform transient absorption (TA) imaging with an HF2LI for signal acquisition was constructed by Yang Wan and Desiré Whitmore at the Potma Group at UC Irvine11. The related femtosecond pulses with a repetition rate of 80 MHz are listed in Table 2.
Table 2. Components of transient absorption process.
| Excitation pulses |
Output pulses |
| ω1: pump pulse (mod) |
ω1: pump pulse (mod) |
| ω2: probe pulse |
ω2: probe pulse |
|
ω2: transient absorption (mod) |
The wavelength of the pump pulse and the probe pulse is 820 nm and 943 nm respectively. Figure 3 shows that the pump pulses pass the AOM and the probe pulses pass the delay stage in order to adjust the interpulse delay. The modulation frequency is 1.5 MHz and the excitation powers are 0.5 mW for the probe pulse and 1 mW for the pump pulse.
The transient absorption on the probe pulse is isolated from the output pulses by optical filtering and demodulation by the HF2LI once the interaction with the sample takes place. Then, the signal is transmitted, via the auxiliary outputs of the HF2LI, to the microscope controller.
The wavelength configuration that Desiré Whitmore utilized for TA uses stimulate emission in metallic structures as an imaging contrast. Therefore, it is possible to visualize individual single-walled carbon nanotubes (SWNT) with metallic properties.
Carbon nanotubes are difficult to synthesize with specific material properties but they have the potential to offer innovational solutions in many fields of technology. They have to be individually characterized to select SWNTs with specific material properties at the end of the fabrication process.
For this purpose, nonlinear optical pump-probe microscopy with the ability to study fast electron dynamics by TA can be used. Due to the very small size of SWNTs, the optical response is weak and this means that long image acquisition times are required. Frame-based averaging is applied, rather than a single scan with long acquisition time, because the maximum pixel dwell time is limited by photodamage. SWNT imaging with a pixel dwell time of 20 ms is shown in Figure 5.
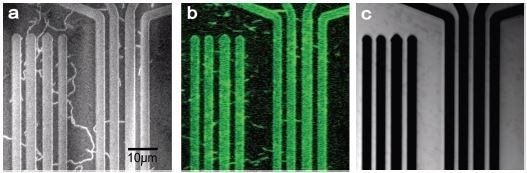
Figure 5. Adapted with permission from11. Copyright 2011 Desiré Whitmore. Figure 5a is a scanning electron microscope (SEM) image of synthesized SWNT with Titanium pads for electrical characterization. While the SEM resolves individual SWNT, no information concerning the electronic properties is obtained. Figure 5b shows a TA image of the same region. As the response from SWNT depends on the optical polarization of the laser pulses, only horizontally aligned SWNT are visible. By changing the interpulse delay, the electron dynamics of individual metallic SWNT are studied. The pads are resolved in the TA image due to their metallic properties. The pixel dwell time was 20 µs and a longer pixel dwell time of 100 µs resulted in photodamage of the SWNT. Figure 5c shows a transmission image of the same region and does not show any signature from SWNT.
User Benefits
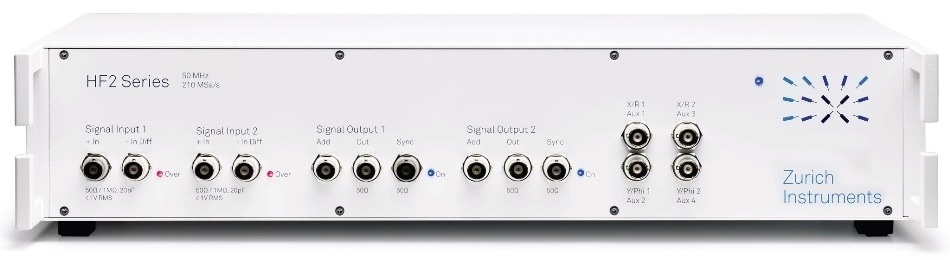
The Zurich Instruments HF2LI lock-in amplifier has features that are essential for high-speed nonlinear optical pump-probe microscopy compared to other commercially available devices. These features include:
- Auxiliary outputs sampled at 1 MS/s
- Faster filter time constant of 780 ns
- Frequency range up to 50 MHz
- 120 dynamic reserve for best-in-class signal-to-noise ratio
- Constructed with the most advanced integrated components available in the market
- Up to 6 demodulators in one lock-in unit
Modulation frequencies have a typical pulsed laser repetition rate of 80 MHz and are always below 40 MHz. These conditions are perfectly matched with the frequency range of the HF2LI. By selecting a first order filter with a time constant of 780 ns, it is possible to set the demodulation bandwidth as high as 200 kHz for fast scanning speeds.
Unnecessary distortions can be avoided by updating auxiliary outputs of the HF2LI every microsecond with time equidistant samples and this provides fast output and acquisition of the demodulated signals. On these outputs, a 200 kHz filter suppresses aliasing.
The maximum effective demodulation bandwidth is 147 kHz at the auxiliary outputs of the HF2LI, considering the superposition of the two filter transfer functions. The 200 kHz bandwidth can also be achieved with digital sample transfer to the computer using USB cable.
Table 3 summarizes the achievable imaging frame rate with an HF2LI employed for signal acquisition for various resolutions. The left-most column shows the number of pixels per frame. The 5% Rate is, for instance the frame rate, where the demodulation filter creates a 5% increase in the smallest resolvable feature size.
Table 3. Achievable imaging frame rates with HF2LI.
| Frame pixels |
5% Rate |
10% Rate |
20% Rate |
| 512 x 512 |
1.2 fps |
1.7 fps |
2.3 fps |
| 256 x 256 |
4.9 fps |
6.7 fps |
9.4 fps |
| 175 x 175 |
10 fps |
14 fps |
20 fps |
For all these frames it is assumed that the smallest resolvable feature is sampled by two pixels. For example, 128 x 128 mm is the size of the 512 x 512 pixel frame. For the frame rates listed in Table 3, a zero time is assumed for the acquisition of subsequent frames. Detailed calculations can be found in 12.
High-speed microscopy with 10 or more frames per second is achievable with a minimal trade-off special resolution. As well as nonlinear absorption and coherent Raman microscopy, nonlinear pump-probe imaging techniques like photothermal microscopy can also benefit from the fast detection performance.
The HF2LI has six demodulators and two signal inputs, and these can be employed for various detection methods. An example of this is simultaneously measuring single beam two photon absorption, which is detected on the second channel, and modulation transfer, determined on the first channel of the HF2LI, at any arbitrary value of the modulation frequency.
Therefore, the optical setup needs to be extended to simultaneously detect the collected pump-pulses. Another example is the pseudoheterodyne detection method13. This is where optical phase modulators measure the vibrational phase in the interferometric CARS setup.
Acknowledgements
Zurich Instruments thanks Desiré Whitmore from UC Irvine (currently UC Berkeley) and Mikhail Slipchenko from the Purdue University for sharing results from their measurement setups, which are shown in the example experiments of this application note and for their support.
References
- Evans, Potma, Puoris’haag, Cote, Lin, Xie, Chemical imaging of tissue in vivo with video-rate coherent anti- Stokes Raman scattering microscopy, PNAS, 102 (46) 16807-16812, 2005
- Zhang, Slipchenko, Cheng, Highly sensitive vibrational imaging by femtosecond pulse stimulated Raman loss, J. Phys. Chem. Lett., Vol 2, 1248 - 1253, 2011
- Saar, Freudiger, Reichman, Stanley, Holtom, Xie, Video-rate molecular imaging in vivo with stimulated Raman scattering, Science, Vol 330, 2010
- Day, Domke, Rago, Kano, Hamaguchi, Vartiainen, Bonn, Quantitative coherent anti-Stokes Raman scattering (CARS) microscopy, J. Phys. Chem. B, Vol 115, 2011
- Ganikhanov, Evans, Saar, Xie, High-sensitivity vibrational imaging with frequency modulation coherent anti- Stokes Raman scattering (FM CARS) microscopy, Optics Letters, Vol 31 No 12, 2006
- Potma, Evans, Xie, Heterodyne coherent anti-Stokes Raman scattering (CARS) imaging, Optics Letters, Vol 31 No 2, 2006
- Jurna, Garbacik, Korterik, Herek, Otto, Offerhaus, Visualizing resonances in the complex plane with vibrational phase contrast coherent anti-Stokes Raman scattering, Anal. Chem, Vol 82, 2010
- Min, Freudiger, Lu, Xie, Coherent nonlinear optical imaging: Beyond fluorescence microscopy, Annu. Rev. Phys. Chem., Vol 62, 507-530, 2011
- Ye, Fu, Warren, Nonlinear absorption microscopy, Photochemistry and Photobiology, Vol 85, 631 - 645, 2009
- Slipchenko, Le, Chen, Cheng, High-speed vibrational imaging and spectral analysis of lipid bodies by compound raman microscopy, J. Phys. Chem. B, Vol 113, 7681 - 7686, 2009
- Whitmore, Design and construction of linear and nonlinear optical systems for measurements of nanomaterials: Towards chemistry at the space-time limit, Ph.D. Thesis, University of California, Irvine, 2011
- Derivations shown in Zurich Instruments Blogs
- Zurich Instruments application note on pseudoheterodyne detection in optics

This information has been sourced, reviewed and adapted from materials provided by Zurich Instruments.
For more information on this source, please visit Zurich Instruments.