The first step for selecting a technology or instrument for areal surface topography measurement is the performance specifications. To precisely measure the texture of the surface, sensitivity to small differences in surface height z as a function of position in the x-y plane is required, as shown in the topography map of Figure 1.
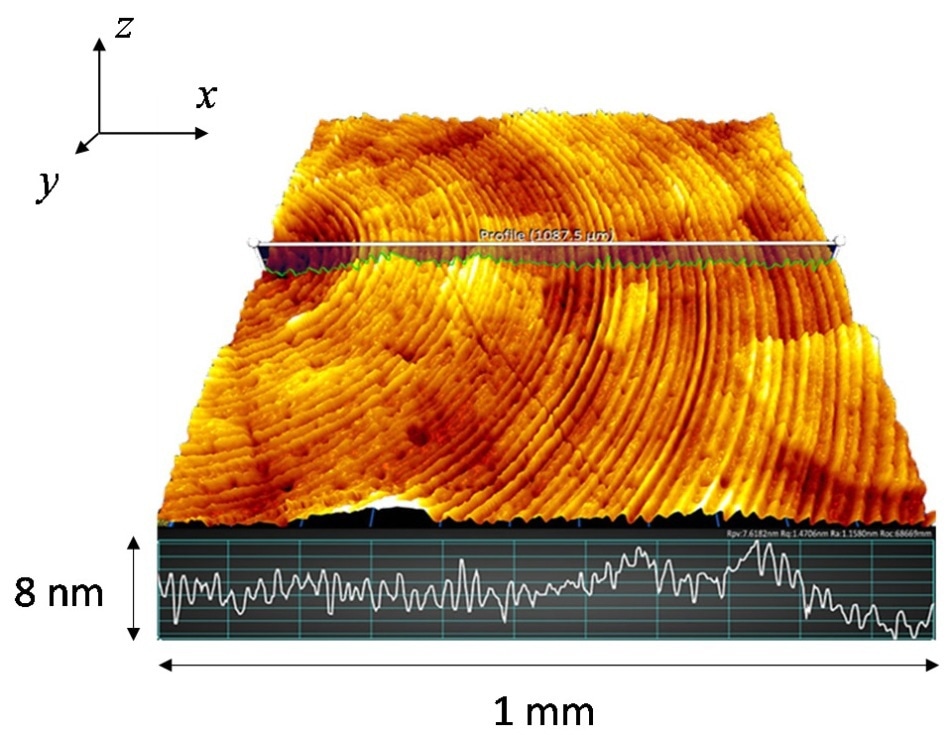
Figure 1. An example of optical surface topography measurement requiring nm level sensitivity to surface heights.
Vertical resolution is the most often cited parameter related to surface height measurement sensitivity. It is qualitatively understood to represent the smallest surface height variation that a person can detect. A review of international standards, technical articles and instrument brochures reveals a lack of consensus regarding how to find out the vertical resolution, thereby making its numerical specification a questionable value today [1]. This contradicts the steady progress in understanding and quantifying sources of uncertainty in the measurement of areal surface topography [2–4]. Researchers, instrument makers and users are asked to specify its value quantitatively, although there is no formal definition for vertical resolution. This can result in confusion and even commercial conflicts. It is therefore important to re-evaluate the meaning of vertical resolution and perhaps identify a better way to characterize instrument performance.
What is the Definition of Vertical Resolution?
First of all, questioning the use of the word vertical is worthwhile. There is obviously no requirement to measure surface heights with respect to the distant horizon although it is true that often the sample is horizontal and therefore surface heights are vertical. In the context of stylus instruments in ISO 25178-601 [5], the term appears informally, but a normative definition is not available in the areal texture standards. To rectify this, the most recent draft of ISO 25178-600 notes that the instrument z-axis that nominally corresponds to surface heights is sometimes referred to as the vertical axis, irrespective of the orientation [6].
Secondly, in the guide to uncertainty in measurement (GUM) and in the international vocabulary of metrology (VIM), resolution refers to the smallest difference between displayed indications that can be distinguished meaningfully (VIM 4.15 [7]; GUM F.2.2.1 [8]). A conventional interpretation of this guidance in computer-based metrology is that the resolution corresponds to the least significant bit (LSB) of the height-sensor digitization. For instance, a sensor may have an analog-to-digital (A/D) converter that reads 0 or 1 nm for the LSB. This sensor would have a vertical resolution of 1 nm, if employed for profiling surface heights, which means that measuring a smaller height difference than this in a single measurement with this particular A/D converter is not possible.
Resolution is not clearly defined with full-field instruments that derive surface height data from a sequence of tens or even hundreds of digitized camera frames, as is the case with coherence and confocal scanning interference microscopes. A decade or two ago, when heights were computed as 16-bit integers, the tradeoff between resolution and height range often led to a minimum measurable height that corresponded to the data storage format. Nowadays, however, computer display and storage capabilities have become sophisticated to a point where these factors are no longer a limit in distinguishing surface heights. For instance, ZYGO Mx™ software uses 64-bit, double-precision internal representation, with an LSB of one-billionth of a nanometer (10-9 nm). However, understanding and acceptance of such a value as useful information on a specification sheet is unlikely. To conclude, presently there is no standardized definition of vertical resolution in optical surface topography measurement.
Regions Analysis with Mx Software, Part 1: Optical Profiler Surface Topography Measurement
Possible Interpretations
Given the ambiguity in its meaning, it is not a surprise that there is a variety of interpretations of vertical resolution. Thus, for instruments that have similar abilities to detect small variations in surface texture, this results in a comprehensive inconsistency in the quoted values for related specifications, by as much as three orders of magnitude. Table 1 shows a sampling of usually published specifications [4]. A range of quantitative values are obtained not because of the actual differences in performance but because of the lack of proper understanding of the term vertical resolution. In certain cases, as described in the previous paragraph, the specification corresponds to the computer data representation. In other instances, the specification is the standard deviation of the topography RMS (root mean square) or Sq parameter, which, in the limit of a perfectly featureless object surface, is merely the repeatability of the measurement noise level.
Table 1. Published specifications related to the concept of vertical resolution for a selection of commercially manufactured 3D interference microscopes.
| Instrument |
Specification |
Value (nm) |
| A |
Height resolution |
0.001 |
| B |
Repeatability of surface RMS (Z) |
0.003 |
| C |
RMS repeatability (RMSσ) |
<0.01 |
| D |
Vertical resolution |
0.01 |
| E |
RMS repeatability of surface accuracy |
0.01 |
| F |
RMS repeatability |
<0.02 |
| G |
Noise floor |
0.05 |
| H |
Vertical resolution |
<0.1 |
| I |
Vertical resolution |
0.1 |
| J |
RMS repeatability |
0.3 |
| K |
Vertical resolution |
1 |
There is a temptation to explain vertical resolution as the z-axis equivalent of lateral resolution, which ISO documents define as the smallest distance between two surface features in the x-y plane for which the features are clearly distinguishable [6,9]. In the case of optical instruments, the diffraction limit is given by an influence factor for lateral resolution, whereas for stylus tools it is the radius of the stylus tip. Can this concept be applied to surface heights in the z direction?
The analogy between axial and lateral resolution has meaning for optical coherence tomography (OCT), where the axial resolution quantifies the capability to separate scattering centers along a common line of sight (i.e., within a single axial scan, equivalent to a single pixel). This is an elementary performance parameter in OCT that does not get any better with averaging, related to focus depth and spectral bandwidth [10]. Axial resolution of less than a micron is believed to be extremely good [11] in contrast to the nanometer values shown in Table 1. The minimum transparent film thickness is the comparable specification for surface structures. For this, there are distinctly separable confocal or interferometric height signals [12,13].
Vertical resolution generally refers to the ability to measure the difference in heights of widely separated surface features in the x-y plane of an opaque object. The analogy between vertical and lateral is no longer applicable in this case. No fundamental principle other than random noise can limit the smallest detectable difference in z for widely separated points on the two plateaus of a step height specimen. As a matter of fact, with sufficient optical power, lateral smoothing and measurement time, it can easily reach the picometer range.
Instrument Noise
Based on the observations above, it is advisable to avoid quoting the vertical resolution of instrument, except as a qualitative idea. This creates a situation where there is no performance parameter related to the minimum detectable height difference. Explicitly quantifying the measurement noise is a reasonable alternative. This is an idea supported by established norms (VIM 4.14 [7]). ISO 25178 documents consider instrument noise as the internal noise added to the output signal by the metrology system when it is placed in an ideal environment with minimal disturbances, for the purpose of specifying instrument performance[6,9].
A fundamental test for noise in areal surface topography maps comprises of repeated measurements on a polished, flat part. The surface topography repeatability (STR) gives an idea on how close one can expect the indicated height value for a specific sample point (or camera pixel) to repeat if the measurements are taken time and again without changing the conditions of measurement [9]. A noise-equivalent Sq or a standard deviation is obtained and is readily determined from statistics over a full image of surface points.
A simple STR test measures a smooth, flat part twice, subtracts the difference of the two resulting topography maps and calculates the standard deviation Sq of this difference map [6,9,14].
The STR, denoted here as NM, is
 |
(1) |
In order to provide a robust estimate of STR, several methods use multiple measurements [9,15,16].
Over a number of years, a common practice in areal measurement specification has been to quote a vertical resolution or its equivalent without any indication of how long it would take to achieve it. This contradicts good engineering practice in specifying sensor noise [17,18]. Excluding the measurement time in a specification can lead to expectations that do not correspond to realistic instrument use. On the other hand, the data acquisition time or number of averages can be adjusted to reach a desired measurement precision once there is a noise level expressed with respect to a time bandwidth. Figure 2 shows the use of time averaging with sinusoidal phase shifting interferometry to illustrate the importance of including data acquisition time in an STR evaluation [19]. Five averages per second are allowed by a 100 Hz, 1024 × 1024 pixel camera, resulting in a measurement noise level of 0.072 nm/√Hz. An alternative approach to reduce the noise is to more densely sample the signal that can trade a longer acquisition time for lower noise levels without averaging individual measurements [20].
The data acquisition rate is not easily expressed as a time bandwidth in Hz for instruments that scan over an adjustable range of surface heights. For these systems, a meaningful expression of STR would be a dimensional value in addition to a height-scanning rate and the corresponding camera format, as in STR = 0.1 nm at 10 µm/s for 1 k × 1 k pixels.
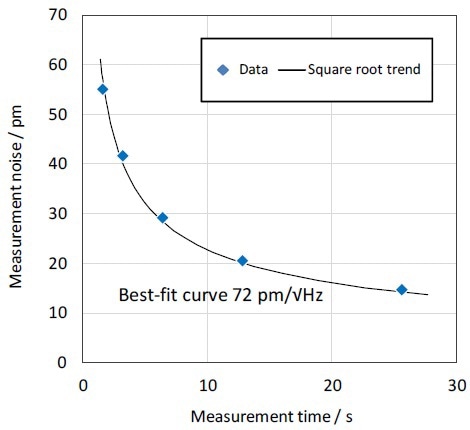
Figure 2. Experimental demonstration of the reduction of measurement noise as a function of data acquisition time for the ZYGO Nexview™ 3D interference microscope.
In evaluating the STR as a measure of performance, its association with spatial filtering is another important factor to be considered. The application of a deionizing or high spatial frequency S filter can improve the STR at the expense of reduced lateral sampling. In some cases, pixel averaging is part of the normal or default operation of the instrument, while in other cases it may be mandated by a surface texture analysis procedure. In all cases, it is important to document or record the spatial filtering so that its effects are understood.
A Useful Specification
According to the previous paragraphs, redefining the term vertical resolution in terms of the ISO 25178 definition of instrument noise, probably with a scaling factor, is one way to address the ambiguity in the meaning and measure of vertical resolution [21, 22]. However, there are obstacles to its general acceptance despite being a good solution. Vertical resolution is already interpreted in many different ways, such as the digital data representation, that are not directly tied to random instrument noise.
Convincing instrument makers to accept the new definition, even when it results in a commercial disadvantage with regard to quoted specifications from competitors who use a more generous interpretation of the same term is the real challenge. Due to this reality, early adopters could fall in a disadvantageous position for years until the new definition is completely standardized by the ISO and accepted by the user community.
A few specification sheets have started using the STR directly, thus simultaneously offering a quantitative performance value while defining a test procedure to validate it [4, 23]. This STR specification corresponds directly to the ISO-defined instrument noise, if performed under ideal conditions. Instrument noise is another term that can be used in a specification sheet without ambiguity. This solution can be applied instantly as both instrument noise and STR appear in published ISO standards as well as in additional draft standards [6, 24].
Conclusions
To conclude, the term vertical resolution should not be used as a performance specification for areal surface topography instruments, unless it is clearly mentioned on the specification sheet that it is synonymous with or scaled to an ISO-defined term such as STR or instrument noise. To avoid confusion, STR or instrument noise can be alternatively used. In all cases, any quantitative performance statement associated with noise in the surface height measurement should be accompanied by the bandwidth or data acquisition rate, the number of independent 3D image points and any implicit post-processing or filtering that modifies the effective lateral sampling.
Acknowledgments
This paper is an updated and expanded version of a proceedings paper entitled, “The meaning and measure of vertical resolution in surface metrology” prepared for the 5th International Conference on Surface Metrology, Poznan, Poland, 2016.
Conflicts of Interest
The Authors declare no conflict of interest.
References and Notes
1. Leach, R.K. Is One Step-Height Enough? In Proceedings of the Annual Meeting of the American Society for Precision Engineering, Austin, TX, USA, 5 November 2015; pp. 110–113.
2. Haitjema, H. Uncertainty in measurement of surface topography. Surf. Topogr. Metrol. Prop. 2015, 3, 035004. [CrossRef]
3. Leach, R.; Giusca, C.; Haitjema, H.; Evans, C.; Jiang, J. Calibration and verification of areal surface texture measuring instruments. CIRP Ann. Manuf. Technol. 2015, 64, 797–813. [CrossRef]
4. De Groot, P.J. Progress in the specification of optical instruments for the measurement of surface form and texture. In Proceedings of the SPIE Sensing Technology + Applications. International Society for Optics and Photonics, Baltimore, MD, USA, 6 May 2014; Volume 9110, p. 91100M.
5. ISO25178-601: Geometrical Product Specifications (GPS)—Surface Texture: Areal—Part 601: Nominal Characteristics of Contact (Stylus) Instruments; International Organization for Standardization: Geneva, Switzerland, 2010.
6. ISO DIS 25178-600:201: Geometrical Product Specifications (GPS)—Surface Texture: Areal—Part 600: Metrological Characteristics for Areal-Topography Measuring Methods (DRAFT 2016-05-07); International Organization for Standardization: Geneva, Switzerland, 2016.
7. JCGM 200:2012 International Vocabulary of Metrology—Basic and General Concepts and Associated Terms (VIM), 3rd ed.; Joint Committee for Guides in Metrology: Geneva, Switzerland, 2012.
8. JCGM 100:2008 Evaluation of Measurement Data—Guide to the Expression of Uncertainty in Measurement (GUM); Joint Committee for Guides in Metrology: Geneva, Switzerland, 2008.
9. ISO 25178-604:2013(E): Geometrical Product Specification (GPS)—Surface Texture: Areal—Nominal Characteristics of Non-Contact (Coherence Scanning Interferometric Microscopy) Instruments; International Organization for Standardization: Geneva, Switzerland, 2013. Appl. Sci. 2017, 7, 54 6 of 6
10. Drexler, W.; Liu, M.; Kumar, A.; Kamali, T.; Unterhuber, A.; Leitgeb, R.A. Optical coherence tomography today: Speed, contrast, and multimodality. J. Biomed. Opt. 2014, 19, 071412. [CrossRef] [PubMed]
11. Povazay, B.; Bizheva, K.; Unterhuber, A.; Hermann, B.; Sattmann, H.; Fercher, A.F.; Drexler,W.; Apolonski, A.; Wadsworth, W.J.; Knight, J.C.; et al. Submicrometer axial resolution optical coherence tomography. Opt. Lett. 2002, 27, 1800–1802. [PubMed]
12. De Groot, P.J.; Colonna de Lega, X.; Fay, M. Transparent film profiling and analysis by interference microscopy. In Proceedings of the Optical Engineering + Applications. International Society for Optics and Photonics, San Diego, CA, USA, 14 August 2008; Volume 7064, p. 706401.
13. Artigas, R. Imaging confocal microscopy. In Optical Measurement of Surface Topography; Springer:Berlin/Heidelberg, Germany, 2011; Chapter 11.
14. Giusca, C.L.; Leach, R.K.; Helary, F.; Gutauskas, T.; Nimishakavi, L. Calibration of the scales of areal surface topography-measuring instruments: Part 1. Measurement noise and residual flatness. Meas. Sci. Technol. 2012, 23, 035008. [CrossRef]
15. Haitjema, H.; Morel, M.A.A. Noise bias removal in profile measurements. Measurement 2005, 38, 21–29. [CrossRef]
16. Zygo Corporation. Measuring Sub-Angstrom Surface Texture. Application Note AN-0002 2008.
17. Usher, M.J. Noise and bandwidth. J. Phys. E Sci. Instrum. 1974, 7, 957. [CrossRef]
18. Sydenham, P.H.; Thorn, R. Handbook of Measuring System Design; John Wiley & Sons Ltd.: Chichester, UK, 2005.
19. De Groot, P. Principles of interference microscopy for the measurement of surface topography. Adv. Opt. Photonics 2015, 7, 1–65. [CrossRef]
20. Fay, M.F.; de Lega, X.C.; de Groot, P. Measuring high-slope and super-smooth optics with high-dynamicrange coherence scanning interferometry. In Optical Fabrication and Testing (OF&T); Classical Optics 2014; OSA Technical Digest: Kohala Coast, HI, USA, 5 June 2014; paper OW1B.3.
21. Wiora, G.; Bauer, W.; Seewig, J.; Krüger-Sehm, R. Definition of a Comparable Data Sheet for Optical Surface Measurement Devices. Available online: www.optassyst.de/fairesdatenblatt (accessed on 20 December 2016).
22. Helmli, F. Focus Variation Instruments. In Optical Measurement of Surface Topography; Springer: Berlin/Heidelberg, Germany, 2011; Chapter 7.
23. Zygo Corporation. Nexview Optical Profiler. Specification Sheet SS-0098 01/15 2015.
24. ISO WD 25178-700.2: Geometrical Product Specifications (GPS)—Surface Texture: Areal—Part 700: Calibration and Verification of Areal Topography Measuring Instruments (DRAFT); International Organization for Standardization: Geneva, Switzerland, 2015.

This information has been sourced, reviewed and adapted from materials provided by Zygo Corporation.
For more information on this source, please visit Zygo Corporation.