Polytec's Optical Measurement System
Polytec's optical measurement equipment focuses on dynamic response measurements. MEMS devices typically have actively moving parts for sensing and actuation: electrical testing alone cannot determine essential information, but dynamic response measurements can.
Dynamic response measurements include micromirror settling-time dynamics, resonator displacement amplitudes, and cantilever resonance frequencies. Non-invasive, precise, real-time, and high-resolution measurement techniques are required in such cases.
The Polytec microscope-based measurement system incorporates three technologies:
- Laser Doppler Vibrometry (LDV) measures out-of-plane motion. To measure in-plane vibrations, two extra vibrometer channels are oriented to the surface. Automatic scanning allows deflection shapes to be measured and shown as 3D animations.
- Strobe video microscopy measures in-plane motions and provides comprehensive 3D motion analysis.
- White-light interferometry (WLI) enables the measurement of surface topography for static shapes.
This apparatus is now used by the MEMS community to characterize devices such as micro mirrors, cantilevers, gyros, accelerometers, actuators, RF switches, ultrasonic transducers, microphones, ink jets, resonators, and pressure sensors. Applications include:
- Dynamic testing of device response to evaluate mechanical parameters such as resonance frequency, stiffness, and damping
- Characterization of device response during design and release phases
- Validated performance against expected FE model predictions
- Measurement of settling time dynamics for precise movement and 3D depiction of response
- Calibration of actuator and sensor displacements vs driving voltage across various motions and frequencies
- Topography measurement to determine surface attributes following manufacture, including shape, roughness, curvature, geometry, step height, film tension, and delamination.
This article demonstrates how the Polytec optical measurement system is used in a variety of different scenarios.
The operating principles are critical for understanding the technology's inherent advantages and limitations. The next sections provide a full explanation of this technology, followed by examples showing how the aforementioned techniques are applied to key applications.
Laser Doppler Vibrometry
The laser Doppler vibrometer (LDV) is an optical instrument that uses laser technology to detect velocity and displacement at specific spots on a vibrating object. Laser vibrometers operate without contact and are unaffected by surface qualities or environmental conditions.
The laser beam may be focused to a spot as small as 1 mm in diameter, enabling the investigation of MEMS components visible under an optical microscope. Diffraction limits preclude measurements of devices smaller than the wavelength of light used (532 nm).
LDV is a highly sensitive optical technology capable of measuring displacements from centimeters to picometers at frequencies ranging from near DC to GHz.
In addition to their large frequency range, LDVs feature a high dynamic range (over 170 dB) for velocity amplitudes from 0.02 µm/s to 10 m/s. These properties enable measurements that are not achievable with holographic or other approaches.
The LDV makes use of the Doppler effect, in which light backscattered from a moving target contains information about velocity and displacement at the point of incident. Surface displacement affects the phase of the light wave, while instantaneous velocity shifts the optical frequency.
Using interferometric methods, the received light wave is combined with a reference beam before recombining at the photo detector. Figure 1 shows the fundamental arrangement of a modified Mach-Zehnder interferometer.
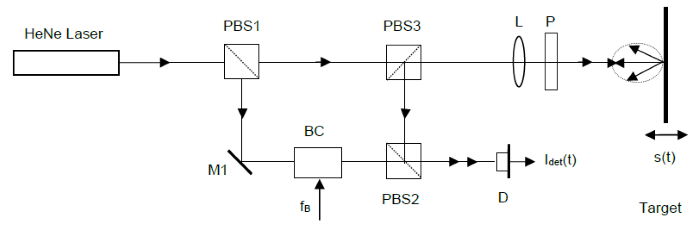
Figure 1. Optics schematic of a modified Mach-Zehnder Interferometer. Image Credit: Polytec
The signal recorded by the optical detector contains direction-sensitive frequency and phase modulation from the moving object. Target displacement s(t) results in a phase modulation.
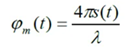 |
(1) |
λ - laser wavelength
According to the basic relationships dφ/ dt = 2πf and ds/dt = v, phase modulation corresponds to a frequency deviation known as the Doppler frequency. The detector output signal's resulting frequency accurately retains the velocity vector's directional information (sign).
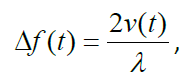 |
(2) |
LDV measurements are dynamic and do not provide information about static shape (as is possible with other techniques such as digital holography or white-light interferometry). The detector output signal is phase- and frequency-modulated, encoding displacement and velocity.
A laser vibrometer's signal decoder blocks use phase and/or frequency demodulation algorithms to retrieve displacement and velocity time histories from the modulated detector signal.
Both digital and analog frequency demodulators convert the instantaneous Doppler frequency into a voltage proportionate to the vibration velocity. The high-quality demodulation electronics employed ensure key accuracy, linearity, sensitivity, and signal-to-noise ratio throughout the vibrometer system.
The LDV measurement devices can be upgraded to a 3D vibrometer configuration, allowing for pm-resolution in both out-of-plane and in-plane motion. The optical system is based on heterodyne Mach-Zehnder interferometry, which uses three linearly independent interferometer channels (Figure 2).
The laser beam is sent on-axis through the main interferometer if acousto-optically frequency-shifted in relation to the three reference beams. The scattered light is then gathered both on-axis and in two off-axis directions.
The three detector signals include the entire broad bandwith 3D vibration spectra at the measurement point. To obtain Cartesian coordinates from the vibration data, a coordinate transformation is used.
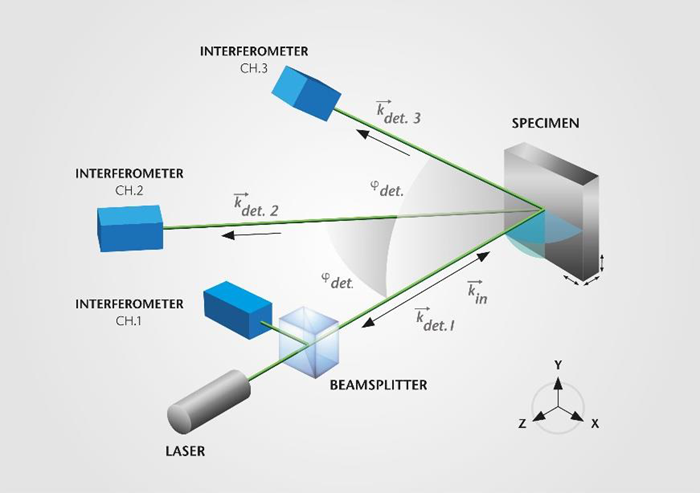
Figure 2. Optical layout of 3D laser vibrometer. Image Credit: Polytec
One disadvantage of using LDV is that measurements are taken at a single location rather than across an entire field, as with video interferometry techniques. The LDV approach can be extended to full-area scanning by deflecting the laser-measuring beam in the x and y directions using scanning mirrors.
Figure 3 shows the schematic for this, together with scanning mirror M. The laser measurement beam can be directed at any spot visible on the live microscope video. This technique involves scanning an area point by point to determine the structure's velocity field.
A single-point LDV can be treated as a conventional sensor (i.e., analog output recorded by an oscilloscope or other data acquisition systems), but a scanning LDV requires system software to create a scan measurement grid, control the scanning process, and acquire measurement data simultaneously.
The phase of each point is established by simultaneously measuring an extra reference channel (usually the driving signal generated by the internal signal generator). This data is used to calculate 3D deflection forms.
The end result is a mapping of the velocity and/or displacement field across the structure, which enables 3D animations of the reaction in either the frequency or time domain.
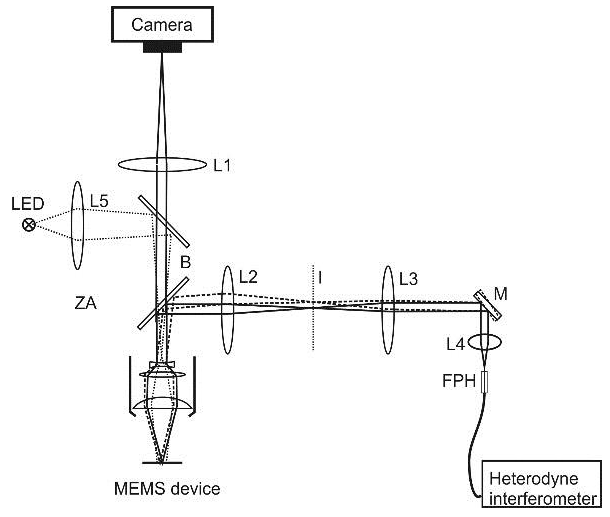
Figure 3. Optical layout of the microscope scanning laser vibrometer. Image Credit: Polytec
Strobe Video Microscopy
Strobe video microscopy detects in-plane periodic motion in MEMS. This approach may be used in conjunction with LDV. Figure 4 shows an integrated CCD camera that captures stroboscopic pictures.
The signal driving the specimen, the LED-strobe flashes, and the camera exposure must be precisely coordinated. Figure 4 shows a timing diagram of strobe synchronization for two camera shots taken at different periods of the periodic excitation cycle.
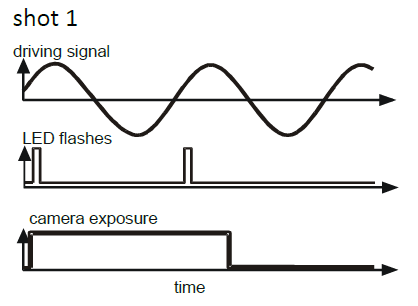
Figure 4. Timing diagram of the strobe signals. Image Credit: Polytec
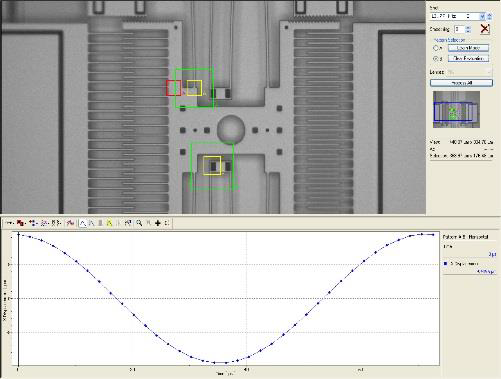
Figure 5. In-plane motion of the comb drive device. Image Credit: Polytec
A collection of strobe images is collected, and pixel discrepancies between frames are determined using machine vision analysis. In-plane motion algorithms use correlation functions to determine position shifts (δx, δy) between images based on a user-defined search pattern.
Image-correlation algorithms allow the calculation of δx and δy values with sub-pixel resolution. This requires post-processing and is not captured in real time like the LDV.
Figure 5 shows the pattern match and displacement of a comb-driven MEMS device at resonance. The device automatically steps through user-defined frequencies and records image sets to obtain the frequency response.
Data on displacement versus phase delay is retrieved for each measured frequency and displayed as a Bode plot. In-plane motion analysis can be accomplished using both sine excitation and a step response.
White-light Interferometry
White-light interferometry (WLI) enables the assessment of static surface topography.
This delivers an x-y-z mapping of the device surface to establish critical properties such as flatness, step heights, curvature, parallelism, roughness, angles, and volumes. The results can be shown as 2D or 3D mappings for evaluation, defect analysis, and/or parameter extraction for specific locations.
The WLI employs a Michelson interferometer with the optical arrangement shown in Figure 6. The coherence length of the whitelight source is in the µm range.
A beam splitter divides the collimated light beam into two beams: an object beam and one for reference. The light scattered back from the mirror and the object are overlaid at the beam splitter and photographed with the CCD camera.
This interference produces fringe patterns, which are traced out for each pixel in the camera image. Using a z-stage, the interference signal is modulated for each pixel, resulting in a correlogram.
The correlogram reaches its maximum value when the distance to the reference mirror is equal to the distance to the device surface.
Following a measurement run, the correlograms from the camera frames are evaluated, allowing a genuine topographical representation of the surface to be reconstructed as a 3D topography map, as shown in Figure 7.
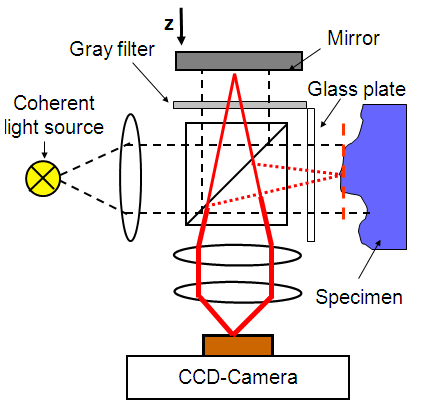
Figure 6. White-light interferometer schematic. Image Credit: Polytec
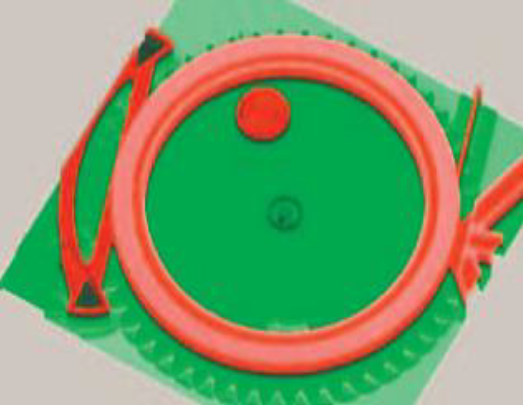
Figure 7. Topography measurement of a micro gearwheel. Image Credit: Polytec

This information has been sourced, reviewed, and adapted from materials provided by Polytec.
For more information on this source, please visit Polytec.