OCT angiography, also known as OCTA, is a dye-free, noninvasive imaging method that can be applied for the 3D visualization of blood flow in tissues. It is a variation of optical coherence tomography (OCT), an optical imaging technique first used in ophthalmology.
OCT utilizes light scattered from various depths in tissue to construct a cross-section image of the tissue under investigation. These images can be merged to generate a composite 3D image of the tissue structure several millimeters in depth. In OCTA, software is used to compare sequential scans to identify local signal fluctuations due to the motion affiliated with blood flow.
OCTA enables the capture of volumetric angiography in just a few seconds, offering parallel tissue structure and blood flow information for research and diagnostic purposes.
This article provides an overview of OCT angiography – its development, advantages, and technology. Moreover, various methods used in OCTA are explored, as well as considering the choice of scan pattern.
OCT angiography (OCTA) relates to a class of medical imaging techniques that facilitates the visualization of blood vessels in living tissue. Generally, angiography is conducted by manipulating a conventional medical imaging technique to offer a contrast for the blood vessels.
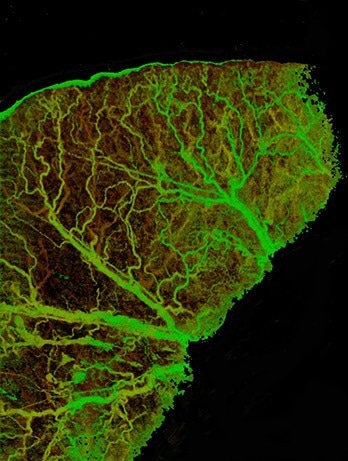
OCTA image of a full mouse ear showing a well-defined vascular pattern. Image taken with an OCT system built using a Cobra 800 spectrometer. Image Credit: Wasatch Photonics, Inc.
The objective of any angiography technique is to differentiate the blood vessel network from the surrounding tissue. Several other methods, such as X-ray fluoroscopy, employ contrast agents that are administered orally or by intravascular injection into the bloodstream. Angiography of the eye typically uses fluorescein or ICG dyes to show the contrast. It requires injecting dye in the subject’s vein, followed by retina imaging using a specialized camera.
First introduced in the early 1990s, optical coherence tomography (OCT) has become a well-established medical imaging technique. The technique is employed on an extensive basis in ophthalmic diagnostics and has demonstrated excellent potential for many other applications. The technique delivers several novel attributes that have made it extremely effective for medical imaging applications.
OCT offers resolution under 10 micrometers, producing a three-dimensional map of the structure, and can offer volumetric information in just a matter of seconds. Similar to other imaging techniques, there have been different varieties of OCT developed that can enable good contrast for blood vessels in particular. A significant benefit that OCT-based angiography delivers is that there is no need to introduce any additional contrast agent. Contrast agents can provoke unwanted side effects and may impact the normal biology of the subject, making repeated imaging sessions increasingly difficult.
OCTA combines all of the desirable features of optical coherence tomography and brings them to the field of angiography. Particularly, the vascular structure can be mapped at resolutions high enough to visualize the microvessels. Moreover, it is possible to map the vessels in three dimensions, equating to the general tissue structure. OCT is extensively utilized throughout ophthalmology which is why the first applications of OCT angiography are generally found in this field. However, there are also a number of applications for OCT angiography in life sciences, dermatology, oncology, and endocrinology. The addition of greater contrast, particularly for angiography, is expected to expand the application potential for OCT.
How OCT Angiography Works
The primary objective when applying angiography is to determine which specific regions of the image are the blood vessels. This can be seen as a statistical estimation problem where each pixel in the image has a particular likelihood of belonging to a blood vessel. This is contingent on the signal properties that are considerably different when looking at the blood vessels compared to the rest of the tissue.
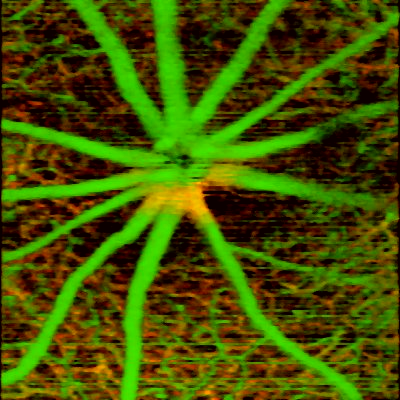
OCT angiography image of mouse retina shows both large and micro-vessels at different depth locations using intrinsic contrast only. The false color in the image encodes the depth location of the blood vessels. Image taken with an OCT system built using a Cobra 800 spectrometer. Image Credit: Wasatch Photonics, Inc.
OCTA depends on this signal variation due to the motion of the particles, such as red blood cells in the vessels, to set them apart from the remainder of the sample under investigation. Therefore, the temporal OCT signal properties may vary in the areas with moving particles compared to the static regions of the tissue.
Execution of this concept in practice necessitates three main considerations: 1) The signal properties and optimal means of measuring them for variations over time, 2) The time differences at which the signal should be measured to study the dynamics, and 3) Taking into account the signal changes as a result of factors other than motion in blood vessels, such as the overall motion of the sample and noise/inaccuracies in the measurement of the signal.
The Signal: Intensity and Phase
The signal captured using optical coherence tomography incorporates two types of localized information. Firstly, the intensity of the light reflected by that point within the sample. Secondly, the variations in the phase of the light wave. While the phase itself is arbitrary, the reflected intensity is contingent on the local heterogeneity or the refractive index gradient of the region under investigation.
Variations in the phase over time stem from the motion of the scattering particles relative to the direction of travel of light. When the sample is absolutely still, it can be determined that any variation in the intensity and phase of the reflected signal is a result of inherent signal noise.
The motion of the red blood cells in the blood vessel results in fluctuations in the phase and intensity of the signal over time. Thus, quantifying this variation allows the user to estimate the probability of a specific pixel in the image representing a blood vessel.
There are numerous methods available for generating an angiographic map from OCT images. These methods may use phase, intensity, or a combination of both. Concerning the ‘phase only’ methods, Doppler shift techniques are the most frequently used. These techniques measure the variations in phase over time at a particular location.
Frequency shifts or phase changes are caused by the motion of a scattering particle towards or away from the imaging beam. This technique is particularly sensitive to minor displacements (on the order of the wavelength of light) and is, therefore useful when measuring the slow movements of cells in smaller vessels.
However, it has several considerable drawbacks. The phase change method is unsuitable for vessels nearly perpendicular to the beam as it is only sensitive to the motion following the beam’s direction. The technique is sensitive to minor changes, making it more vulnerable to bulk motion of the tissue and noise in the system.
The method that only uses the intensity component of the signal is known as speckle variance. An OCT intensity image has an intrinsic speckle nature, hence the word speckle. This technique is able to estimate the statistical variance of the signal intensity from the same location at various points in time.
The variance calculated is normalized relative to the intensity of the image in the region. The region of the image with moving scatterers has comparatively higher levels of variation over time compared to the regions with static tissue. This technique is more stable and less susceptible to small displacements in the sample; however, by not incorporating the phase information, the technique can be less sensitive to slow-moving scatterers.
Additionally, there are techniques that leverage changes in both the intensity and the phase simultaneously. One known technique employs the concept of complex differential variance, where the variations in both the intensity and phase over time are quantified. The variance is determined along the axial direction with a weighted average. This limits the sensitivity of this method, as opposed to the Doppler shift technique, to small axial displacements. When applied in the appropriate manner, this method of OCTA image analysis may combine the best of of both phase and intensity-based methods.
Scan Patterns: All About the Timing
In OCTA, an angiographic map is generated based on fluctuations in intensity or phase over time. This means there is a need to measure the OCT signal at the same location a number of times. Unfortunately, the regular raster scan method is not appropriate for OCT angiography, as this technique only samples each point at one specific moment in time and does not contain any information relative to temporal variation in the signal.
Various scan patterns have been applied to acquire the temporal dynamics of the signal. A primary factor in scan pattern selection is the time difference between the measurements at the same location. If the measurements are taken too close together (in time), the variations from smaller vessels with slow-moving red blood cells will not be determined. When the measurements are too distant from one another, the signal may change in the non-vessel regions as a result of sample movement or environmental variations.
Choosing the appropriate scanning pattern is dependent on the sample of interest. In the case of imaging the eye, a prolonged time difference will not be appropriate due to the limited capability of patients to fixate. In these cases introducing motion correction methods are crucial to compensate for sample instability. Conversely, OCTA can be performed on a mechanically stable sample via scan patterns that probe the sample at longer time differences. Such patterns offer the best chance of visualizing microvasculature in significant detail.
Angiographic imaging can also use patterns that are not simply variations of conventional raster scans. A frequently used method applies a spiral scanning pattern. Such a pattern eradicates the flyback time affiliated with the common raster scan patterns, facilitating faster resampling of the sample of interest.
Bringing OCTA into Your Lab
OCT angiography is an effective technique for noninvasive imaging of vascular structure and blood flow, with applications that serve an extensive range of medical research and diagnostics. For both research and OEM use cases, Wasatch Photonics supplies high-speed OCT spectrometers and industry-leading OCT gratings to facilitate this approach. Explore various Wasatch products below:
- OCT gratings: Broadband, high-efficiency transmission gratings, available online or via custom order.
- OCT spectrometers: Low roll-off designs based on proprietary optics optimize sensitivity and SNR for clearer images, with over a dozen standard models for visible and 800 nm OCT with 250 kHz scan rates.
Contact Wasatch Photonics today to receive a quote!

This information has been sourced, reviewed and adapted from materials provided by Wasatch Photonics, Inc.
For more information on this source, please visit Wasatch Photonics, Inc.