For over 10,000 years, since the agricultural revolution, humans have progressively sought new ways to manage and improve local and global environments. In modern times, there has been an increased dependency on the ability to control and understand the environment in relation to human interaction and impact for reasons associated with safety and security, commerce, and science.
This includes a desire to develop a better understanding of natural and man-made or influenced phenomena such as ocean temperatures/currents, forest fires, sea-ice, forests and deforestation, atmospheric constituents (clouds and aerosols), lightning, oil spills, crops/surface cover and albedo, and weather (storms).
An enhanced ability to manage or understand these phenomena is crucial to maintaining a healthy planet capable of sustaining human life as part of its diverse biomass. However, properly understanding such phenomena and how they change over time requires measurement.
Perspective
An external view often offers unique insights into an environment, as it can be exceptionally difficult to observe a system objectively from within. During the 1960s, the capacity to “slip the surly bonds of Earth”1 was established, which resulted in a race for government-sponsored space agencies to exploit the ability to observe the Earth from above by launching satellites with earth observation (EO) capabilities.
From NASA’s first space-based multispectral imager (MSI), Landsat-1, launched in 1972, to the ESA’s Sentinel-2B “Europe’s eyes on Earth”, which was launched more recently in 2017, Table 1 exhibits just a few examples of the various optical EO instruments governmental space agencies have deployed to date.
Table 1. Examples of EO missions employing optical instruments.² Source: Iridian Spectral Technologies
| . |
. |
. |
. |
| NASA |
Landsat-1 |
4 band (Green, Red, two NIR) |
1972 |
| JPSS; VIIRS (Visible IR Imaging Radiometer Suite) |
22 bands (412 nm-12 um); 1 PAN, 9 VIS/NIR, 8 MWIR, 4 LWIR |
2011 |
| GOES-16; ABI (Advanced Baseline Imager) |
16 bands (2 VIS; 4 NIR; 10 IR) |
2016 |
| GOES-16; GLM (Geostationary Lightning Mapper) |
single NIR band imaging 777.4 nm |
2016 |
| ESA |
ERS-1; IRR (Infrared Radiometer) |
4 band MSI VIS-SWIR (650-1.6 nm) |
1991 |
| Proba-V (vegetation) |
4 bands (Blue, Red, NIR, MWIR) |
2013 |
| Copernicus – Sentinel-2B |
VIS/SWIR MSI 443-2190 nm |
2017 |
| ISRO |
Rohini RS-D2 |
VIS/IR imaging |
1983 |
| Oceansat(IRS-P4); OCM (Ocean Colour Monitor) |
8 band MSI VIS-IR |
1999 |
| RESOURCESAT-2A |
4 band (3 VIS; NIR/SWIR) |
2016 |
During the 1970s, launch costs were in the tens of thousands of dollars, but massive reductions down to just a few thousand dollars today, primarily due to “ride-share” launches combining dozens of satellites from various organizations, has made space exploration commercially accessible and financially viable.
Combined with a detailed observational capacity to offer actionable (and saleable) EO information to terrestrial customers, an EO “space race” has begun as several commercial organizations can access and acquire EO information across the electromagnetic spectrum as displayed in the infographic below (courtesy of TerraWatch Space by Aravind).
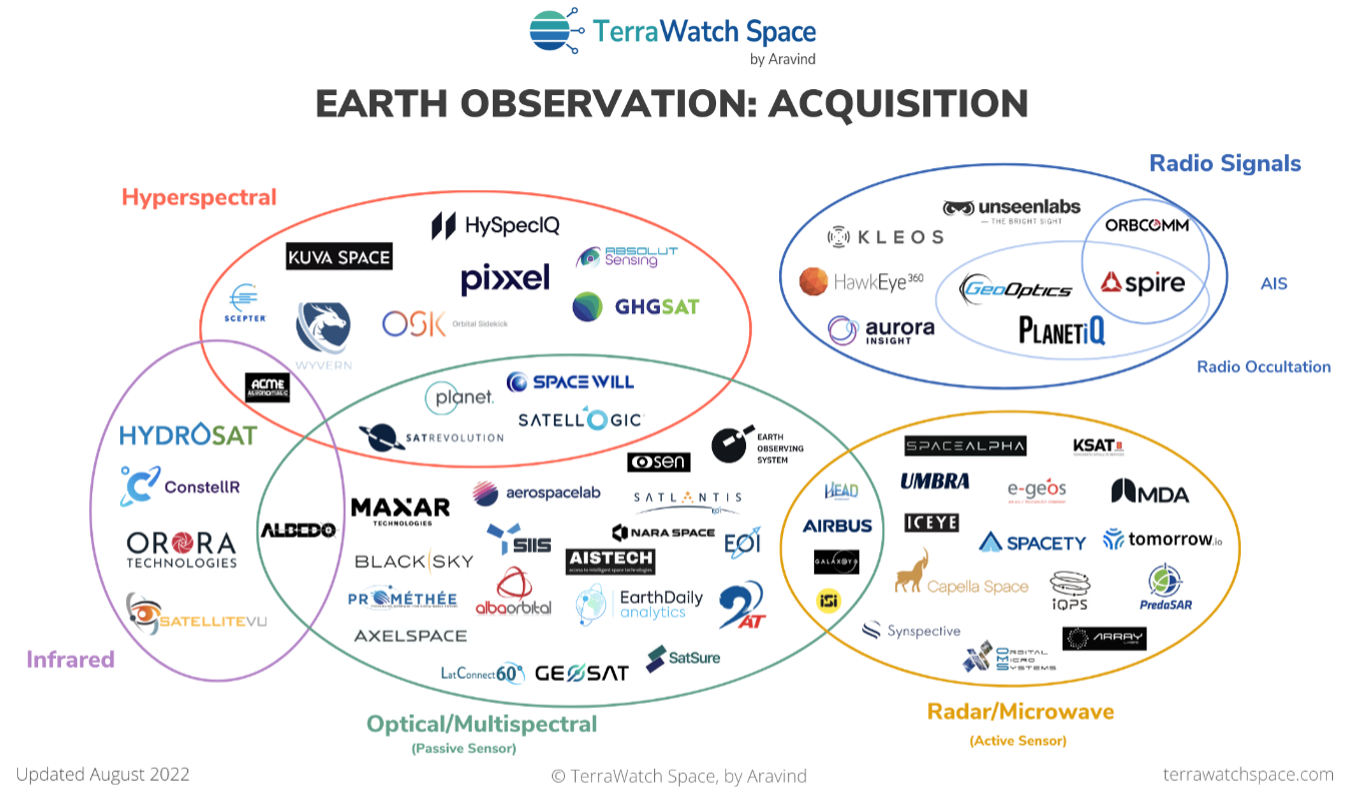
Image Credit: Iridian Spectral Technologies
However, making observations from orbit comes with its own set of challenges and solutions:
- CHALLENGE: Looking through the atmospheric conditions (clouds/aerosols) or, in certain cases, exclusively observing these atmospheric constituents or phenomena.
- SOLUTION: wavelength selective imaging
- CHALLENGE: Study small signals in a large background scene.
- SOLUTION: Highly uniform, large collection optics
- CHALLENGE: Fit as much measurement capability into as lightweight and small a package as possible to reduce launch costs.
- SOLUTION: Compact/multi-spectral imaging
- CHALLENGE: Identify the type of phenomena (“what”) and location (“where”) under observation from a distance (e.g., low earth orbit is 160 - 2000 km above the Earth’s surface)
- SOLUTION: Combine spectral (“what”) and high spatial (“where”) resolution
- CHALLENGE: Successfully survive launch conditions and maintain functionality outside of Earth’s protective atmospheric blanket
- SOLUTION: Reliable and robust optical components
The availability of optical filters in various designs and formats is a major contributor to each of these solutions within photonics-based EO instruments, acting as “the eyes of the instruments.”
Wavelength Selective Imaging
Whether utilizing band-pass (BPF), notch, or edge-pass designs, optical filters inherently carry wavelength selectivity to the instruments in which they are installed. In EO systems, single selective wavelength bands are generally required to observe novel spectral characteristics representative of the distinctive phenomena of interest.
Various atmospheric and environmental constituents have a range of wavelength bands that are transmitted, reflected, or absorbed contingent on their chemical composition. Table 2 illustrates the optical bands on NASA’s Landsat 8 and their relationship with the constituents under observation.
Table 2. Landsat 8 optical bands [Ref NASA]. Source: Iridian Spectral Technologies
| Band # |
Wavelength range (nm) |
Spatial Resolution (m) |
Constituent Measured |
| 1 |
433-453 |
30 |
Coastal (shallow water)/aerosol (fine dust/smoke) |
| 2 |
450-515 |
30 |
Visible (blue) |
| 3 |
525-600 |
30 |
Visible (green) |
| 4 |
630-680 |
30 |
Visible (red) |
| 5 |
845-855 |
30 |
NIR – vegetation |
| 6 |
1556-1660 |
30 |
Geology – Earth, soils and rocks |
| 7 |
2100-2300 |
30 |
Geology – Earth, soils and rocks |
| 8 |
500-680 |
15 |
PAN |
| 9 |
1360-1390 |
30 |
Clouds |
ESA’s SENTINEL-2 sensor bands (S2A bands displayed in Table 3) demonstrate some common elements with some of the Landsat bands and are now the standard for both space agency and commercial visible-to-near-infrared (VNIR) EO spectral bands to assess terrestrial constituents in agriculture, forestry, and land/water features.
Table 3. SENTINEL-S2A optical bands [Ref ESA]. Source: Iridian Spectral Technologies
| Band # |
Center Wavelength /Bandwidth (nm) |
Spatial Resolution (m) |
| 1 |
442.7/20 |
60 |
| 2 |
492.7/65 |
10 |
| 3 |
559.8/35 |
10 |
| 4 |
664.6/30 |
10 |
| 5 |
704.1/14 |
20 |
| 6 |
740.5/14 |
20 |
| 7 |
782.8/19 |
20 |
| 8 |
832.8/105 |
10 |
| 8a |
864.7/21 |
20 |
The user can selectively observe only the signal from the constituent or phenomena under study by selecting optical filters with a band-pass region relative to the wavelength band of interest, thereby achieving “more signal with less background” in their data.
Large, Highly Uniform Collection Optics
If the constituent of interest has spectral bands that are extremely narrow or in close spectral proximity to “background” bands, or if the signal is a minor contributor relative to the background, then large, narrow band-pass filters (NBPFs) that offer enhanced wavelength selectivity may be necessary.
One such application is measuring or mapping lightning from orbit, which demands high wavelength selectivity over a large field of view. Lightning can be studied by observing a narrow atomic oxygen triplet line at 777.4 nm (reference MeteoSAT LI).
However, knowing exactly where and when lightning will strike is challenging, so a significantly large detector area is required over which this very narrow wavelength selectivity is maintained. This necessitates an extremely uniform, narrow optical filter. Iridian has exhibited its capacity to produce such an NBPF centered within 20 pm of the target wavelength over an operating clear aperture >125 mm in diameter.3
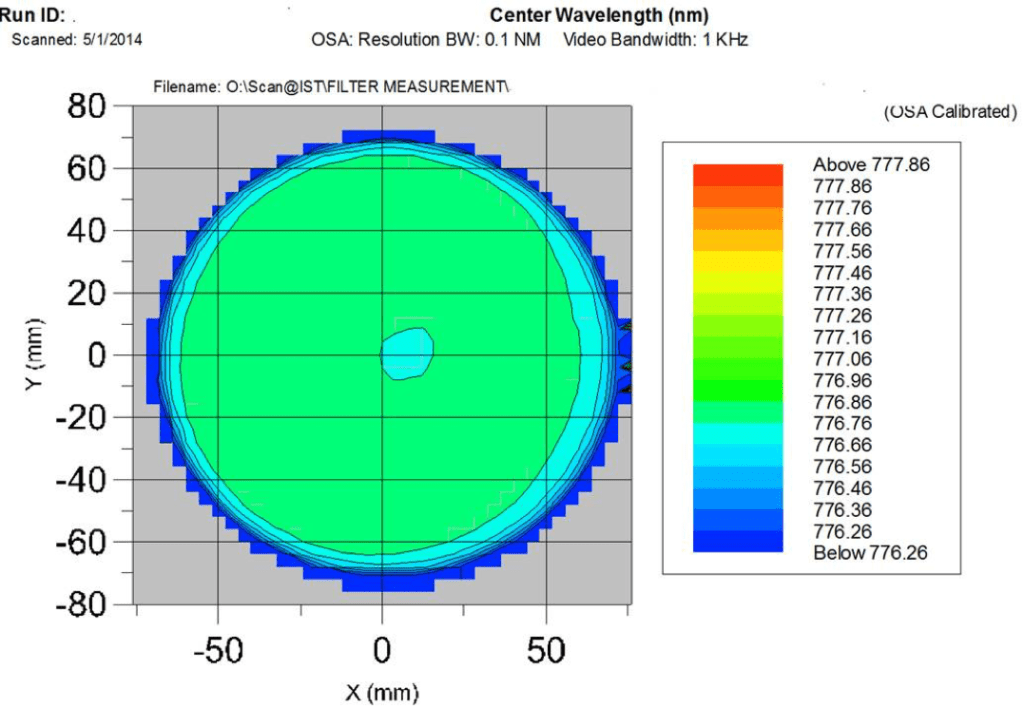
Figure 1. Spatial variation in CWL across 125 mm diameter demonstrating highly uniform large NBPF. Image Credit: Iridian Spectral Technologies
The benefit of an instrument with such high precision and “field of view” must be offset against the increased weight and cost of manufacturing such large complex filters and the associated optical components.
Compact/Multi-Spectral Imaging
To minimize weight and cost per “science line,” several EO imaging systems try to incorporate as much science as possible into one instrument by using a single detector to cover multiple spectral bands of interest. This multispectral imaging (MSI) has led to the need for filter arrays in which the spectral performance can spatially vary across the part.
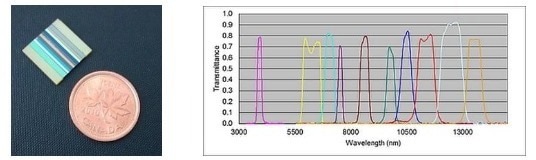
Figure 2. Multispectral array of 10 BPFs (developed under a subcontract from ABB Canada for the Space Technology Development Program of the Canadian Space Agency). Image Credit: Iridian Spectral Technologies
By utilizing a filter with this multi-zone type of construction, various pixel bands on the detector will be sensitive to various spectral bands and, therefore, can evaluate various constituents or phenomena of interest.
Manufacture of multi-zone/multispectral filter (MZF or MSF) arrays can be accomplished by using a butcher block construction, in which filters of different kinds are manufactured, singulated, and fixed together into an array; or by patterning (via masking) various spectral bands on a monolithic substrate. Hybrid approaches are also feasible by bringing assembly and patterning together on a single filter array.
Butcher block MZF arrays offer the benefit of streamlining the coating process by avoiding compounding coating run yields; the filter manufacturer only needs to coat a single band on any given substrate, which is the method used for most “conventional” optical filter manufacturing.
Butcher block arrays can be an excellent choice when several (>4 or 5) bands of interest are to be assessed or when the complexity in individual filter bands is elevated, prompting increased filter coating thickness and decreased run success yields.
Patterned MZF arrays offer the potential to produce nearly any shape or size of spectral band (not only stripes or rectangles as in a butcher block) with considerable improvement (2x or more) in the size of the transition zone.
Limiting the loss of good pixels using a patterned array can be advantageous since pixels under the transition zone are typically unusable for analysis. Moreover, coating on monolithic substrates circumvents the challenges related to alignment tolerances between the various spectral bands.
High Spatial and Spectral Resolution
Greater discrimination of a “science line” can be reinforced by limiting the filter's bandwidth associated with the band of interest. In MSI applications, this enhancement in spectral resolution means a loss in spatial resolution as it shrinks the signal to noise (less total light) and the aperture size (pixels available) for any single band.
By comparison, if a broad band panchromatic (PAN) filter covering the entire visible spectrum is used, the increase in total light at these pixels offers enhanced spatial resolution. For Landsat 8, the PAN band has a greater spatial resolution (15 m versus 30 m), twofold when compared to the other optical bands (see Table 2).
By bringing PAN and wavelength selective bands together through “PAN sharpening,” an array can be applied to accurately map where a particular signal originates from and what the signal represents.
Robust and Reliable Optics
There is no value in running a system with a high-resolution optical filter if it cannot survive the conditions of use when in orbit.
With close control of deposition processes (sputtering or enhanced evaporating) and materials, experienced manufacturers can create optical filters with excellent density and adhesion to endure typical terrestrial requirements for fluctuations in humidity and temperature without altering or degrading with use or time.
Typical reliability specifications include:
- No change in spectral performance or degradation in surface quality after:
- 24 hours of damp heat exposure (95% RH; 49 °C))
- Thermal cycling/shock tests from -60 to 70 °C
- Tape and rub tests for adhesion
Once these filters and filter arrays are in orbit, they may also need to endure extreme temperature ranges (down to 70 K) and the solar and electron radiation that the Earth’s atmosphere typically filters out. Filters and filter arrays deployed in these environments may require further specialized testing to confirm that they will survive the demanding operating environment.
Challenges for the Future
The commercialization of space is expanding into new frontiers as the launch cost continues to decline. While NASA, ESA, and ISRO continue to plan and launch satellites with EO capacity, it is anticipated that an extensive array of EO satellites will be increasingly owned and operated by private organizations such as Planet, EarthDaily Analytics, Satellogic, GHGSat, among many other non-governmental space agencies.
Recently published in a EuroConsult report,4 between 2011 and 2020, commercial satellite constellations made up 65% of all EO satellite launches, and it is expected that that share of commercial EO satellites will grow to >75% in the next ten years within excess of 2600 EO satellites scheduled for launch between 2020 and 2030.
This free enterprise and capitalistic pursuit of space will continue to offer greater access to information, and this data will be used for more than the historical purposes of defense and intelligence.
As the extent of extra-terrestrially acquired data opens up, new applications arise to leverage this information and improve the management and control of terrestrial activities and commerce. Photonics and optical filters will have a crucial part to play in enabling many of these new developments.
References
- [Ref. John Gillespie Magee, Jr.]
- [Ref NASA, ESA, ISRO, JAXA]
- Large format BPF – a uniformity challenge (Iridian)
- https://news.satnews.com/2022/01/12/euroconsult-publishes-the-14th-edition-of-their-earth-observation-satellite-systems-market-report-analysis/

This information has been sourced, reviewed and adapted from materials provided by Iridian Spectral Technologies.
For more information on this source, please visit Iridian Spectral Technologies.